
This article is based on publicly available IR materials and is not a recommendation to buy or sell any specific securities.
Note: The company labels this fiscal year “FYE March 2026” (the year ended March 31, 2026); this site classifies the most recently completed fiscal year as FY2025. Labels in the text and tables below follow the source material. All figures are taken from the company’s English presentation “Financial Results for the Year Ended March 31, 2026” (released May 13, 2026) and are stated in hundred millions of yen unless otherwise noted.
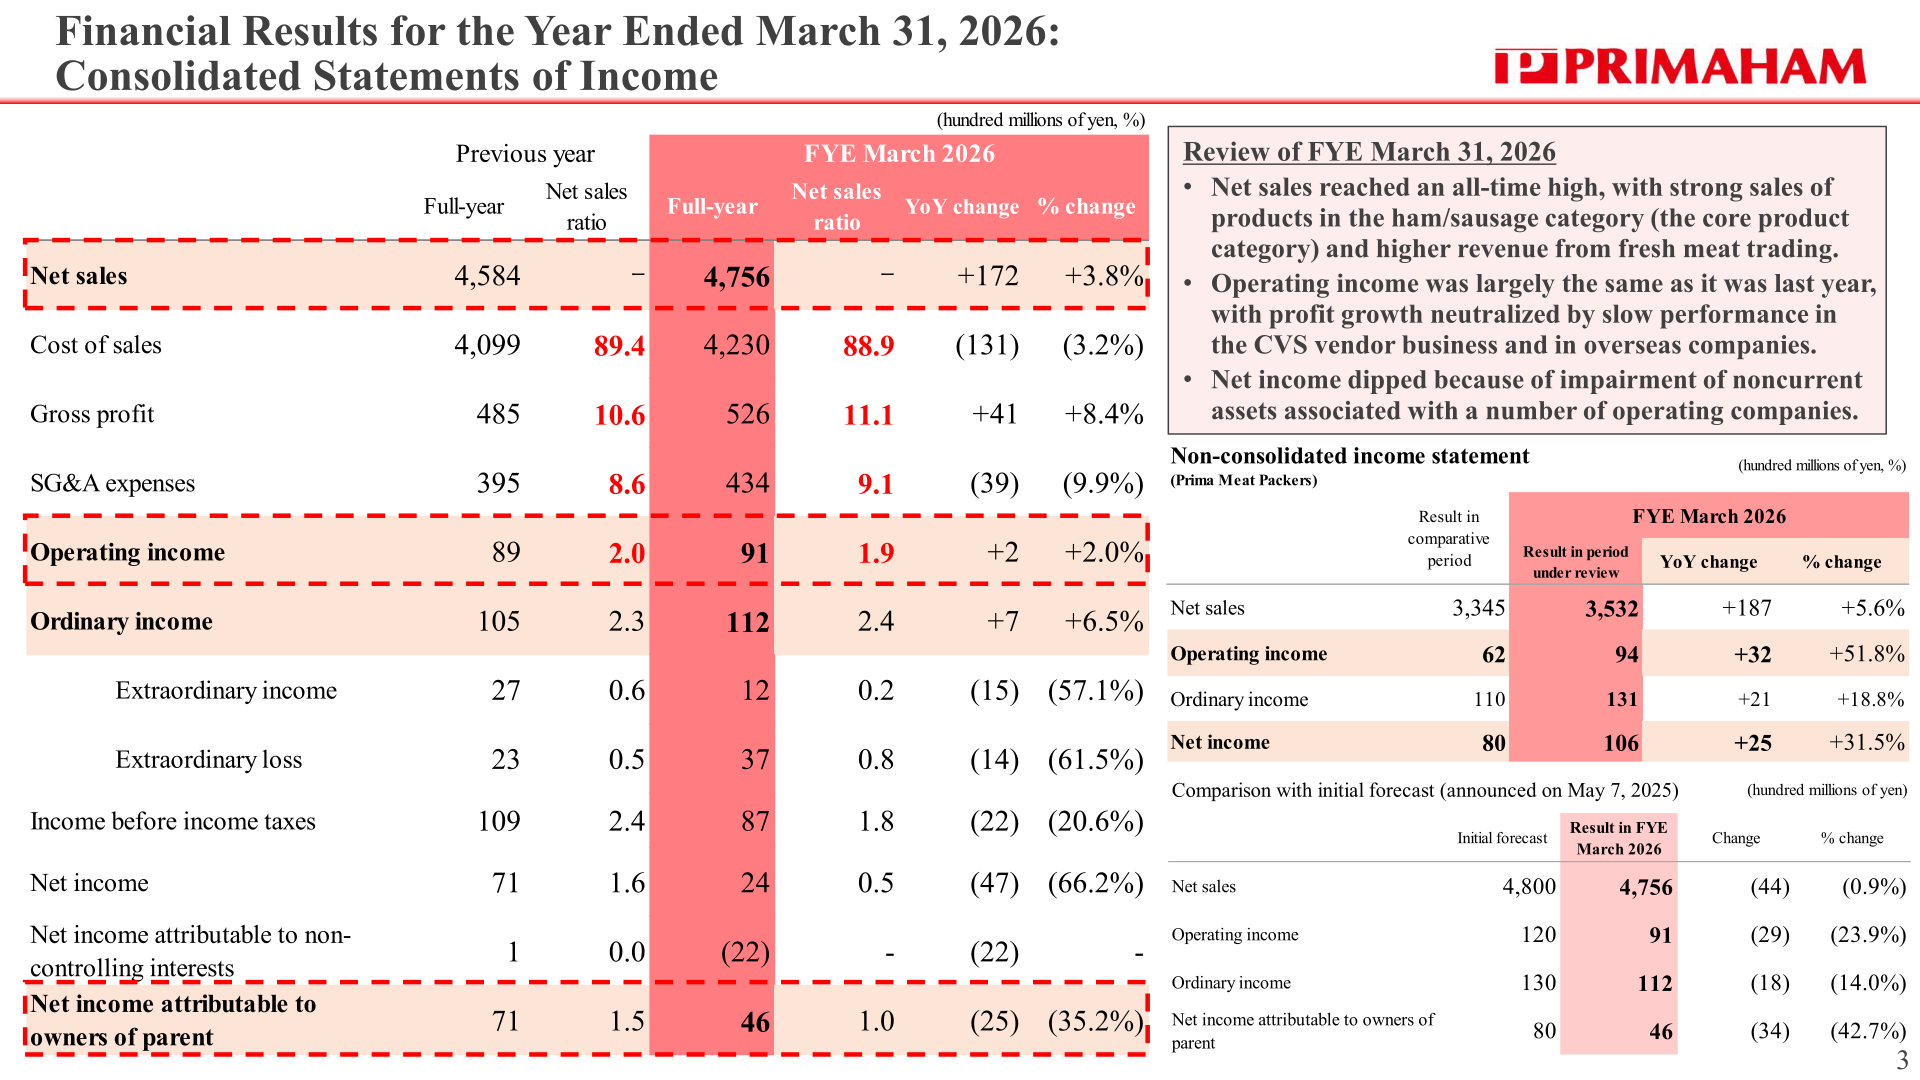
Prima Meat Packers, Ltd. reported net sales of 4,756 for the year ended March 31, 2026, up 172 (+3.8%) year on year and an all-time high. Operating income edged up 2 (+2.0%) to 91, while ordinary income rose 7 (+6.5%) to 112. Net income attributable to owners of parent fell 25 (-35.2%) to 46, which the company attributes to impairment of noncurrent assets associated with a number of operating companies.
Consolidated Results (Full-Year Actual)
In its review of the year, the company states that net sales reached an all-time high, with strong sales of products in the ham/sausage category (the core product category) and higher revenue from fresh meat trading. Operating income was largely the same as it was last year, with profit growth neutralized by slow performance in the CVS vendor business and in overseas companies. Net income dipped because of impairment of noncurrent assets associated with a number of operating companies. Extraordinary loss rose to 37 from 23, and net income attributable to non-controlling interests swung to (22) from 1.
| Item | Previous year (Full-year) | Net sales ratio | FYE March 2026 (Full-year) | Net sales ratio | YoY change | % change |
|---|---|---|---|---|---|---|
| Net sales | 4,584 | – | 4,756 | – | +172 | +3.8% |
| Cost of sales | 4,099 | 89.4 | 4,230 | 88.9 | (131) | (3.2%) |
| Gross profit | 485 | 10.6 | 526 | 11.1 | +41 | +8.4% |
| SG&A expenses | 395 | 8.6 | 434 | 9.1 | (39) | (9.9%) |
| Operating income | 89 | 2.0 | 91 | 1.9 | +2 | +2.0% |
| Ordinary income | 105 | 2.3 | 112 | 2.4 | +7 | +6.5% |
| Extraordinary income | 27 | 0.6 | 12 | 0.2 | (15) | (57.1%) |
| Extraordinary loss | 23 | 0.5 | 37 | 0.8 | (14) | (61.5%) |
| Income before income taxes | 109 | 2.4 | 87 | 1.8 | (22) | (20.6%) |
| Net income | 71 | 1.6 | 24 | 0.5 | (47) | (66.2%) |
| Net income attributable to non-controlling interests | 1 | 0.0 | (22) | – | (22) | – |
| Net income attributable to owners of parent | 71 | 1.5 | 46 | 1.0 | (25) | (35.2%) |
Against the initial forecast announced on May 7, 2025, net sales of 4,756 came in 44 (0.9%) below the 4,800 plan, operating income of 91 was 29 (23.9%) below the 120 plan, ordinary income of 112 was 18 (14.0%) below the 130 plan, and net income attributable to owners of parent of 46 was 34 (42.7%) below the 80 plan. On a non-consolidated basis (Prima Meat Packers), net sales rose from 3,345 to 3,532 (+187, +5.6%), operating income from 62 to 94 (+32, +51.8%), ordinary income from 110 to 131 (+21, +18.8%), and net income from 80 to 106 (+25, +31.5%).
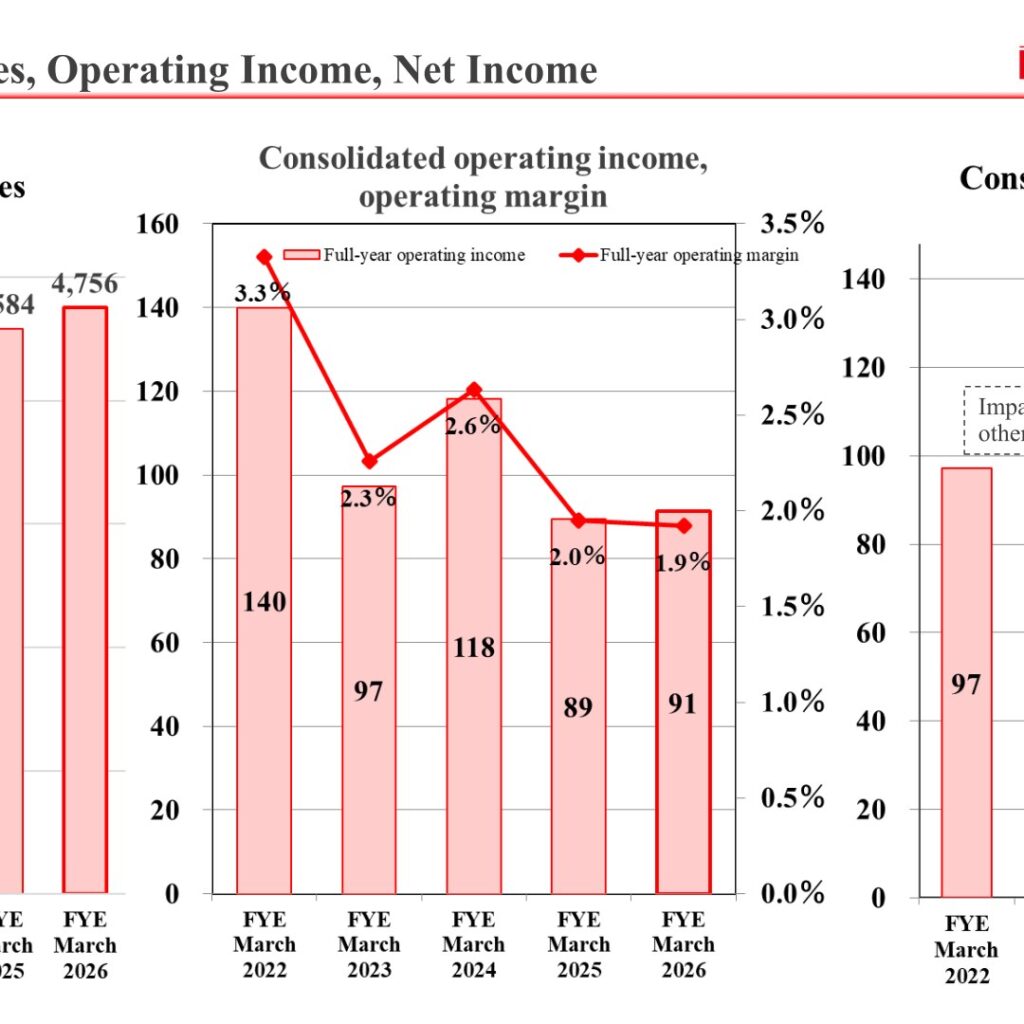
The company’s trend chart shows consolidated net income of 46 for FYE March 2026 against a dashed bar of 77, with the gap of 31 annotated as the impact of impairment loss, among other things, on net income. Consolidated net sales over the five years shown were 4,207, 4,307, 4,484, 4,584 and 4,756, and consolidated operating income was 140, 97, 118, 89 and 91, with operating margins of 3.3%, 2.3%, 2.6%, 2.0% and 1.9%.
Segment Results
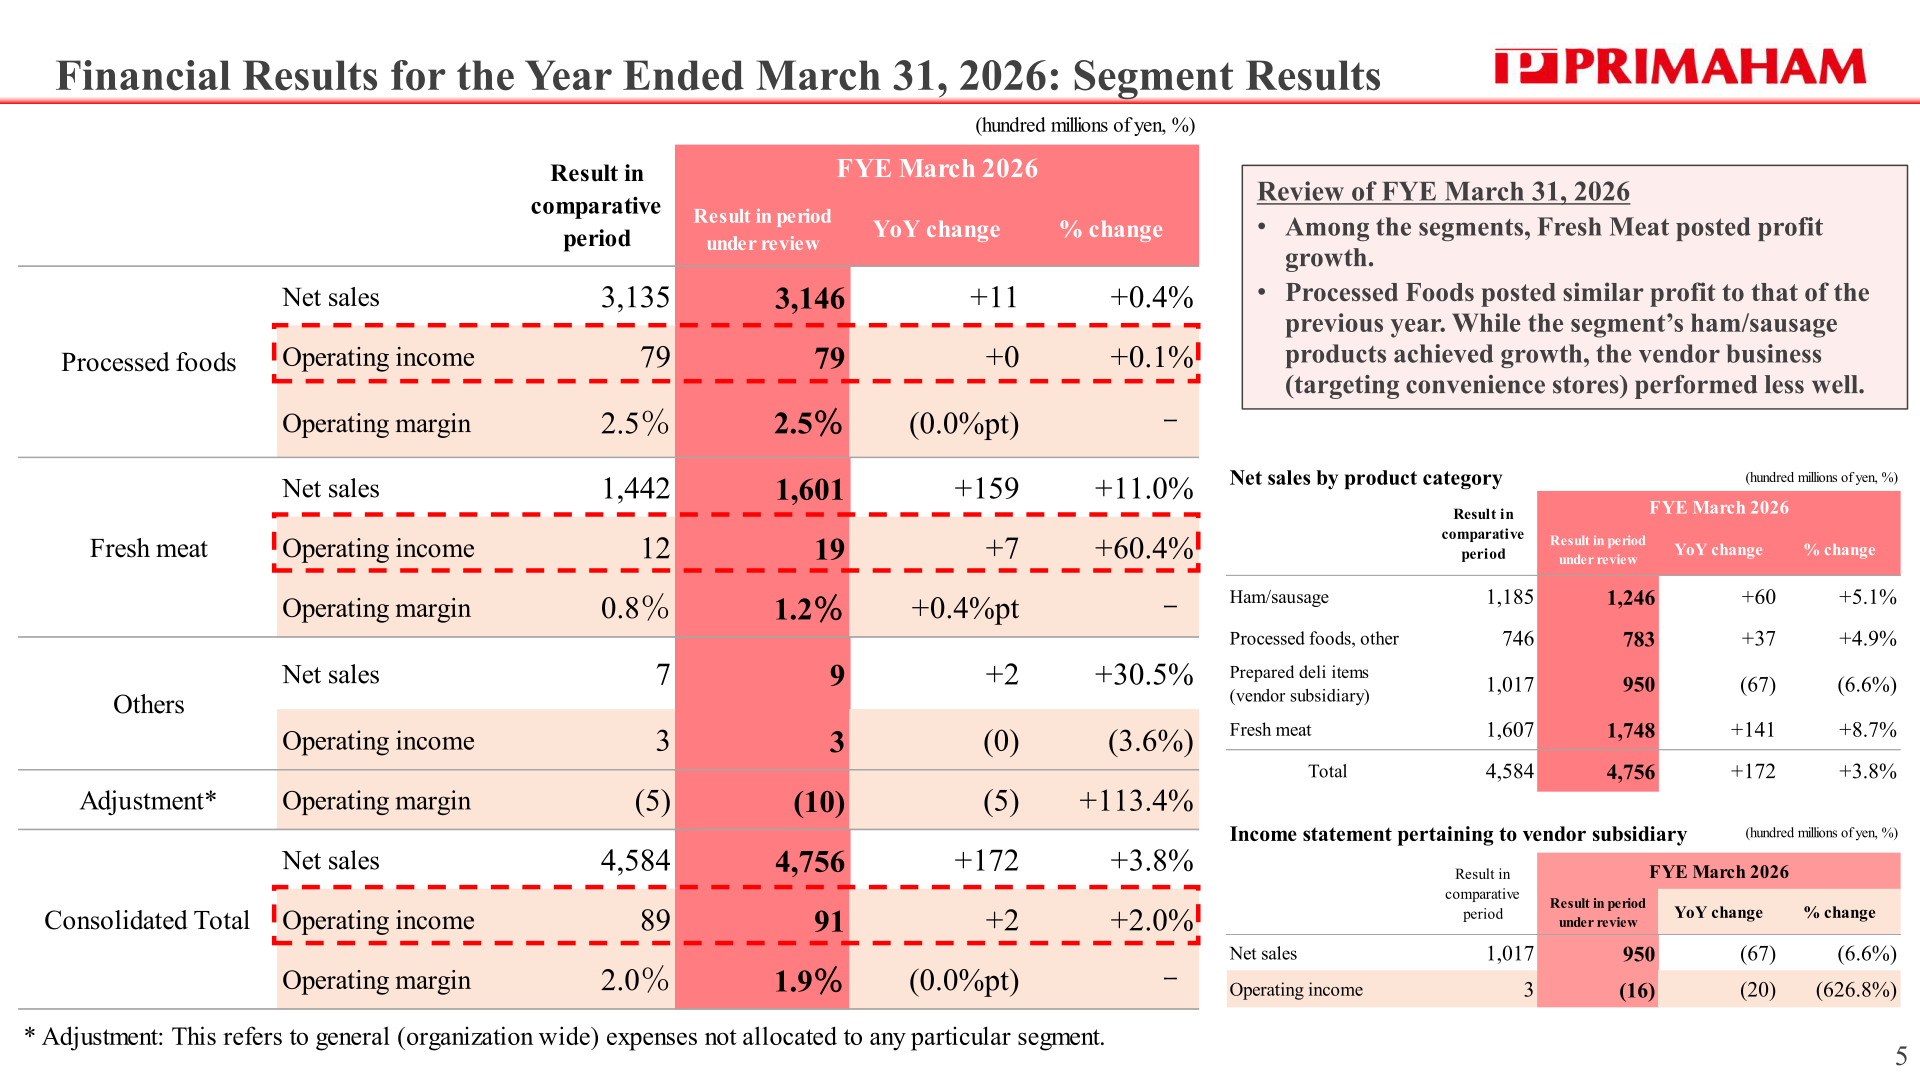
Among the segments, Fresh Meat posted profit growth. Processed Foods posted similar profit to that of the previous year: while the segment’s ham/sausage products achieved growth, the vendor business (targeting convenience stores) performed less well. For Processed Foods the company breaks the change in operating income into profitability improvements of +43 (sales price revisions +28, volume factor +13, better production efficiency +2), cost increases of (24) from higher prices for key raw materials and secondary raw materials and higher logistics costs, and vendor subsidiaries of (20). For Fresh Meat, sell-in and sales contributed +12, led by premium Thai-produced Komedori and Canada-produced Three Herb Pork, while hog farming was (5) as shipments decreased because of death loss despite higher carcass weight.
| Segment | Metric | Result in comparative period | FYE March 2026 | YoY change | % change |
|---|---|---|---|---|---|
| Processed foods | Net sales | 3,135 | 3,146 | +11 | +0.4% |
| Processed foods | Operating income | 79 | 79 | +0 | +0.1% |
| Processed foods | Operating margin | 2.5% | 2.5% | (0.0%pt) | – |
| Fresh meat | Net sales | 1,442 | 1,601 | +159 | +11.0% |
| Fresh meat | Operating income | 12 | 19 | +7 | +60.4% |
| Fresh meat | Operating margin | 0.8% | 1.2% | +0.4%pt | – |
| Others | Net sales | 7 | 9 | +2 | +30.5% |
| Others | Operating income | 3 | 3 | (0) | (3.6%) |
| Consolidated Total | Net sales | 4,584 | 4,756 | +172 | +3.8% |
| Consolidated Total | Operating income | 89 | 91 | +2 | +2.0% |
| Consolidated Total | Operating margin | 2.0% | 1.9% | (0.0%pt) | – |
| Net sales by product category | Result in comparative period | FYE March 2026 | YoY change | % change |
|---|---|---|---|---|
| Ham/sausage | 1,185 | 1,246 | +60 | +5.1% |
| Processed foods, other | 746 | 783 | +37 | +4.9% |
| Prepared deli items (vendor subsidiary) | 1,017 | 950 | (67) | (6.6%) |
| Fresh meat | 1,607 | 1,748 | +141 | +8.7% |
| Total | 4,584 | 4,756 | +172 | +3.8% |
The vendor subsidiary’s own income statement shows net sales falling from 1,017 to 950 ((67), (6.6%)) and operating income swinging from 3 to (16), a change of (20). In the ham/sausage business the company reports that its share of the consumer ham/sausage market (SCI data) rose by 1.0 percentage point as it coordinated price revisions with sales campaigns, with full-year sales volume of Koukun Sausage at 112 versus the prior year and the bacon group at 91.
Balance Sheet and Cash Flows
Total assets rose 17 to 2,413 and total net assets rose 3 to 1,305. Interest-bearing debt decreased 22 to 199, net interest-bearing debt was 98 (+1), and the net DER was unchanged at 0.08. Cash flows from operating activities improved 55 to 198, cash flows from investing activities were (138) versus (136), and free cash flow rose 54 to 60. Cash flows from financing activities were (64) versus (42), and cash and cash equivalents at end of period were 59 versus 63. Capital expenditures increased 64 to 194 against a full-year target of 272, of which capital expenditure for digital transformation (total) was 88 versus a target of 127, and depreciation/amortization was 118 versus 115 in the previous year.
Full-Year Forecast and Medium-Term Projections
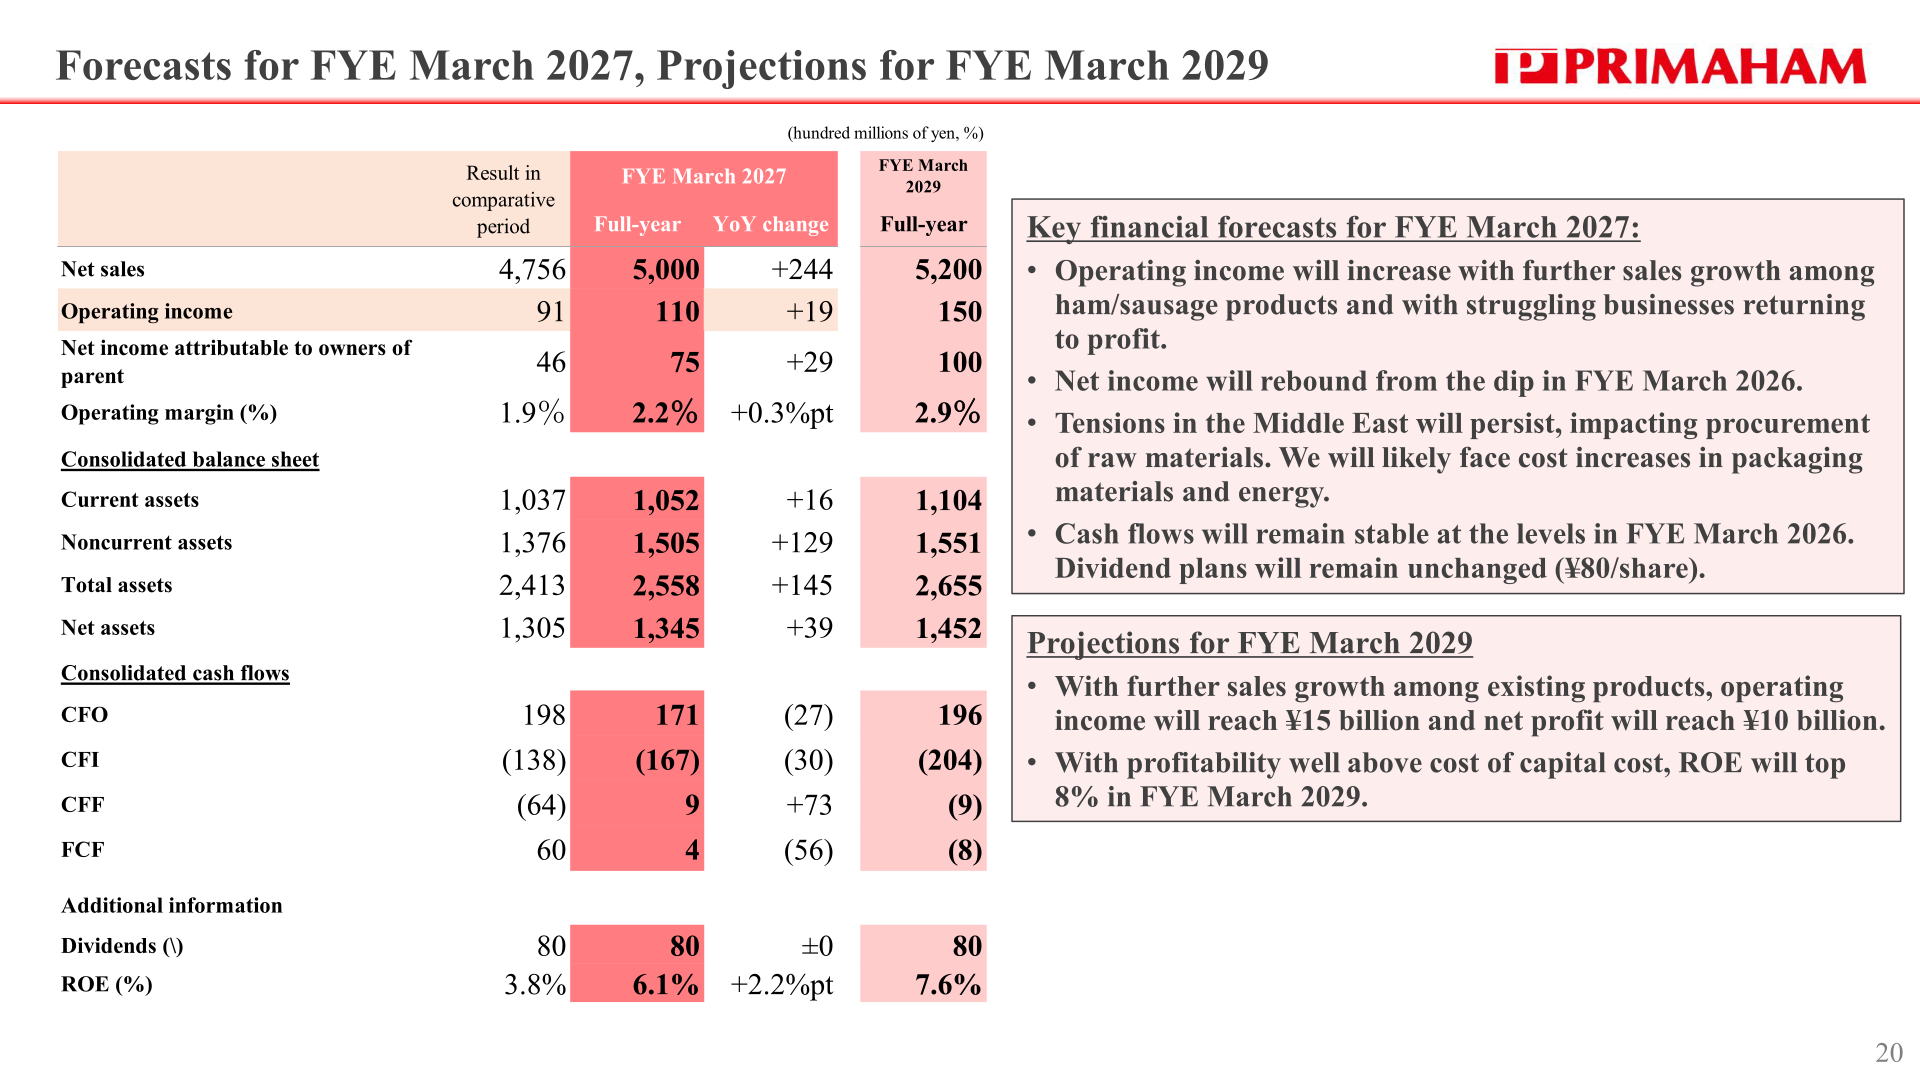
For FYE March 2027 the company forecasts net sales of 5,000 (+244), operating income of 110 (+19) and net income attributable to owners of parent of 75 (+29), with an operating margin of 2.2%. It states that operating income will increase with further sales growth among ham/sausage products and with struggling businesses returning to profit, that net income will rebound from the dip in FYE March 2026, that tensions in the Middle East will persist and it will likely face cost increases in packaging materials and energy, and that cash flows will remain stable at the levels in FYE March 2026. Projections for FYE March 2029 are net sales of 5,200, operating income of 150 and net income attributable to owners of parent of 100, with an operating margin of 2.9% and ROE of 7.6%.
| Item | Result in comparative period (FYE March 2026) | FYE March 2027 (Full-year) | YoY change | FYE March 2029 (Full-year) |
|---|---|---|---|---|
| Net sales | 4,756 | 5,000 | +244 | 5,200 |
| Operating income | 91 | 110 | +19 | 150 |
| Net income attributable to owners of parent | 46 | 75 | +29 | 100 |
| Operating margin (%) | 1.9% | 2.2% | +0.3%pt | 2.9% |
| Current assets | 1,037 | 1,052 | +16 | 1,104 |
| Noncurrent assets | 1,376 | 1,505 | +129 | 1,551 |
| Total assets | 2,413 | 2,558 | +145 | 2,655 |
| Net assets | 1,305 | 1,345 | +39 | 1,452 |
| CFO | 198 | 171 | (27) | 196 |
| CFI | (138) | (167) | (30) | (204) |
| CFF | (64) | 9 | +73 | (9) |
| FCF | 60 | 4 | (56) | (8) |
| Dividends (yen) | 80 | 80 | ±0 | 80 |
| ROE (%) | 3.8% | 6.1% | +2.2%pt | 7.6% |
By segment, the FYE March 2027 targets are net sales of 3,440 (+294, +9.3%) and operating income of 98 (+19, +23.6%) for Processed Foods, with an operating margin of 2.8%, and net sales of 1,550 ((51), (3.2%)) and operating income of 28 (+9, +45.0%) for Fresh Meat, with an operating margin of 1.8%.
Shareholder Returns
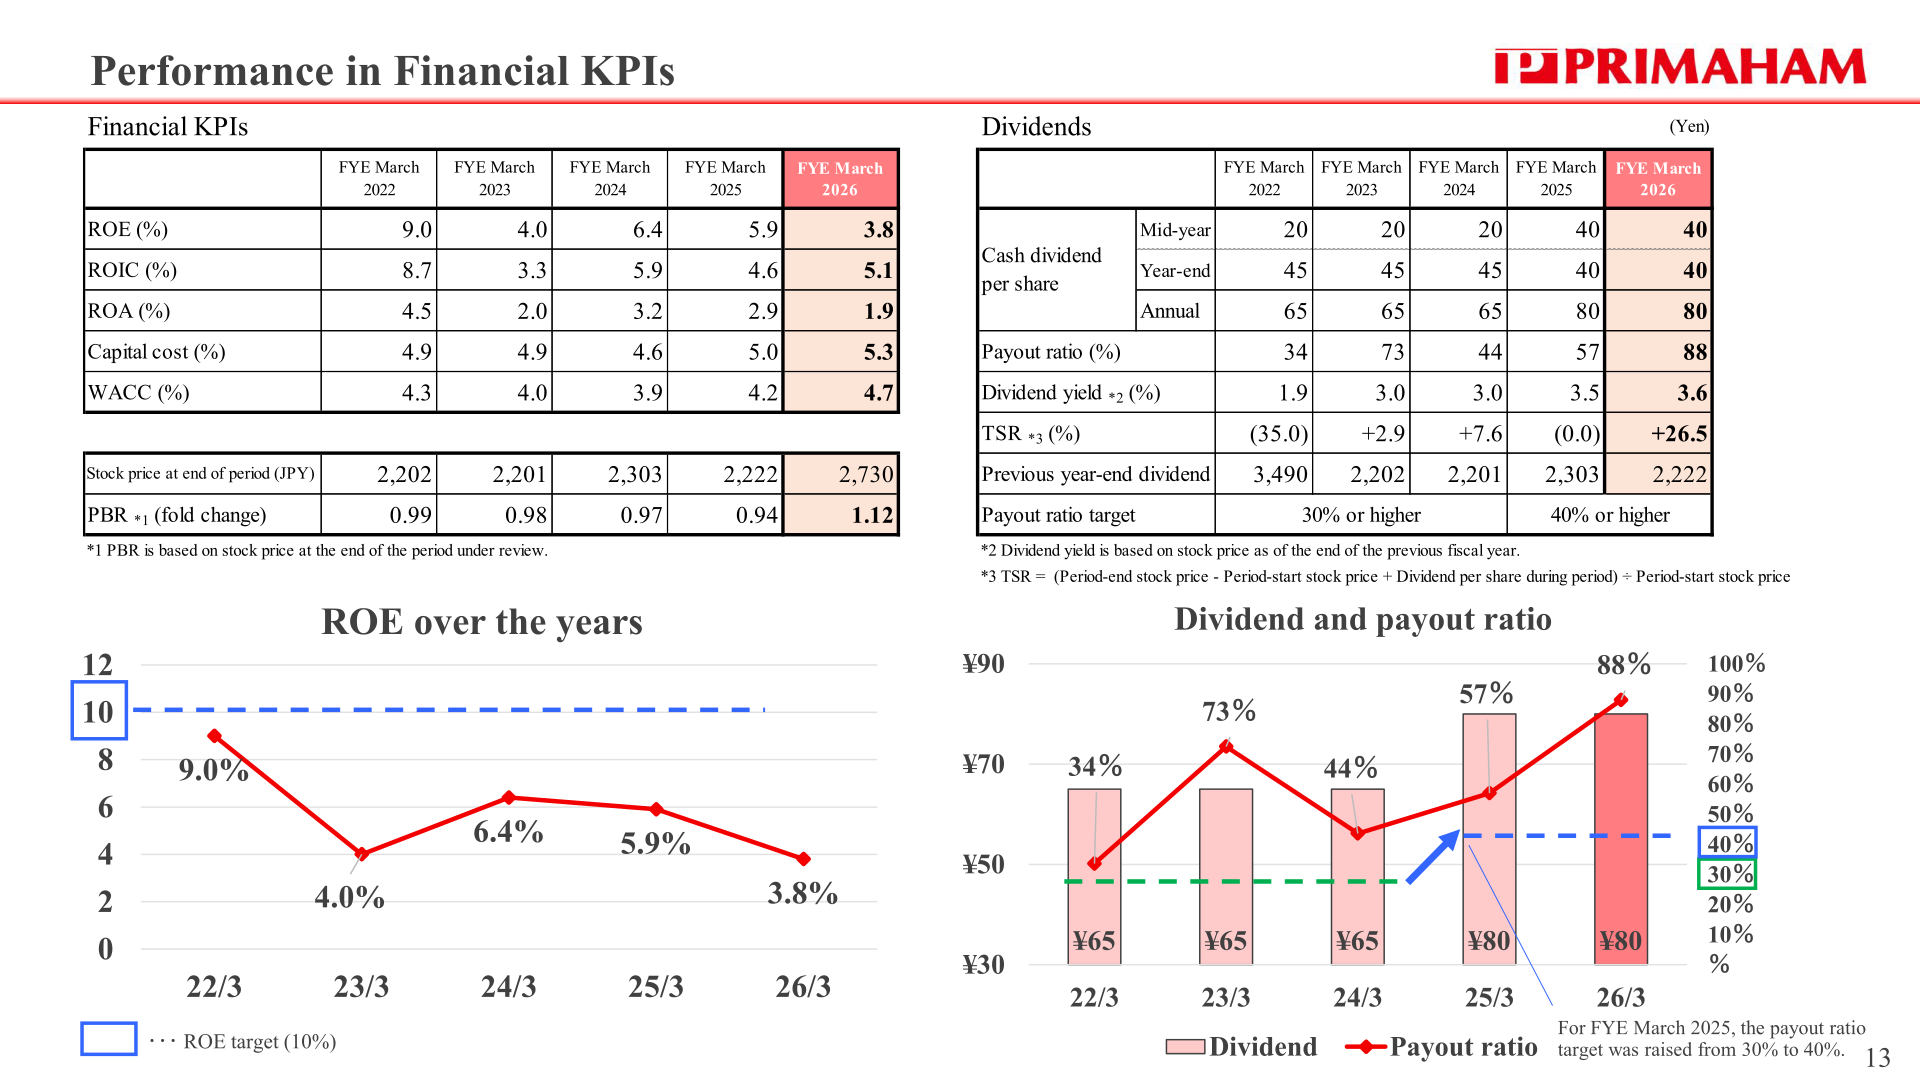
The annual cash dividend per share for FYE March 2026 was 80 yen (mid-year 40 yen, year-end 40 yen), unchanged from FYE March 2025, giving a payout ratio of 88% and a dividend yield of 3.6%. The payout ratio target was raised from 30% or higher to 40% or higher for FYE March 2025. The company’s forecast keeps the dividend at 80 yen per share for FYE March 2027 and in the FYE March 2029 projection. TSR for FYE March 2026 was +26.5%, and PBR at the end of the period was 1.12 times, with the stock price at the end of the period at 2,730 yen.
| Item | FYE March 2022 | FYE March 2023 | FYE March 2024 | FYE March 2025 | FYE March 2026 |
|---|---|---|---|---|---|
| Cash dividend per share: Mid-year (yen) | 20 | 20 | 20 | 40 | 40 |
| Cash dividend per share: Year-end (yen) | 45 | 45 | 45 | 40 | 40 |
| Cash dividend per share: Annual (yen) | 65 | 65 | 65 | 80 | 80 |
| Payout ratio (%) | 34 | 73 | 44 | 57 | 88 |
| Dividend yield (%) | 1.9 | 3.0 | 3.0 | 3.5 | 3.6 |
| ROE (%) | 9.0 | 4.0 | 6.4 | 5.9 | 3.8 |
| ROIC (%) | 8.7 | 3.3 | 5.9 | 4.6 | 5.1 |
| ROA (%) | 4.5 | 2.0 | 3.2 | 2.9 | 1.9 |
| WACC (%) | 4.3 | 4.0 | 3.9 | 4.2 | 4.7 |
Medium-Term Business Plan and Topics
The rolling medium-term business plan covers FYE March 2027 to FYE March 2029 under three strategies: adapting the earnings base to changes in the external environment, creating business and developing globally in order to capture growing markets, and making the business foundation more sustainable. Over the three years the company plans cash in of 65 billion yen in total (operating cash flow of 55 billion yen and borrowing of 10 billion yen) and cash out of 65 billion yen in total (investments of 53 billion yen and shareholder returns of 12 billion yen), with the dividend per share of 80 yen equating to 4 billion yen per year. The Prima Next Project, the group’s digital platform program, is in stage 1; group companies will transition to the new systems during the year ending March 2027 and Prima Meat Packers will transition in the year ending March 2028.
On sustainability, the preliminary result for total scope 1 and 2 emissions in FYE March 2026 (excluding emissions from overseas sources and from livestock) was 125,900 t-CO2e, a 27.1% reduction from the FYE March 2022 level, against an FYE March 2031 target of 130,800 t-CO2e (a 24.3% reduction from the FYE March 2022 level), which the company says it is on course to achieve. The take-up rate for paid leave in FYE March 2026 was 77%, up 10 percentage points year on year.
This article is an analysis based on publicly available information and is not a recommendation to buy or sell any specific securities. Investment decisions are your own responsibility.
















