
This article is based on publicly available IR materials and is not a recommendation to buy or sell any specific securities.
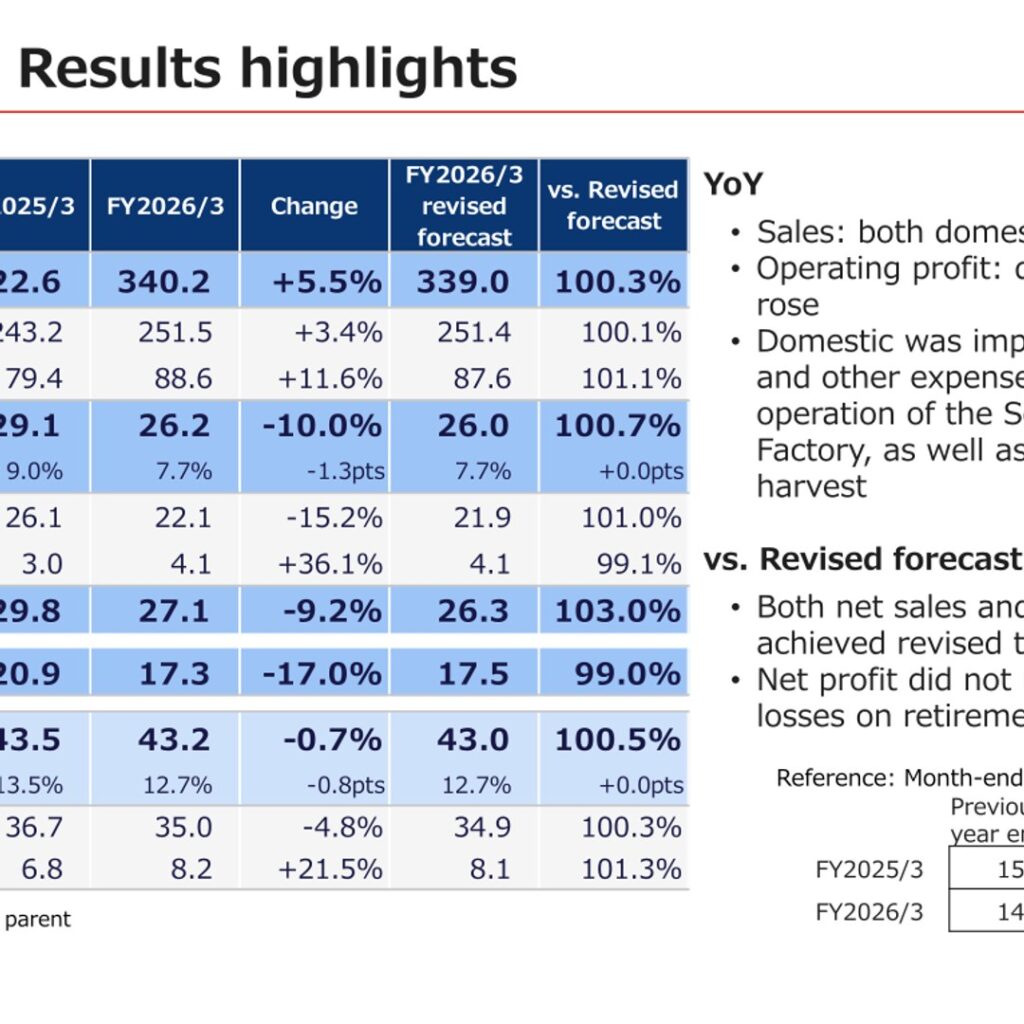
Note: Calbee’s fiscal year ends on March 31, and the company refers to the fiscal year ended March 31, 2026 as “FY2026/3”; that is the label used throughout the text and tables below, and it corresponds to what this site classifies as FY2025. Calbee reported net sales of 340.2 billion yen for FY2026/3, up 5.5% year on year, while operating profit fell 10.0% to 26.2 billion yen. In its executive summary the company notes that sales rose 17.6bn yen while profit fell 2.9bn yen, and that both net sales and operating profit achieved the revised targets. Overseas, sales and profit rose and set new records for both net sales and operating profit, while domestically the company overcame the impact of the smaller potato harvest and steadily carried out recovery measures.
Consolidated Results (Full-Year Actual)
Net sales rose in both the domestic and overseas businesses. Operating profit fell domestically and rose overseas: the domestic business was impacted by depreciation and other expenses related to the operation of the Setouchi Hiroshima Factory, as well as by the smaller potato harvest. Against the revised forecast, both net sales and operating profit achieved the revised target, while net profit did not reach target due to losses on retirement of assets, etc. Month-end forex rates were 159.88 yen/$ at the FY2026/3 year end, versus 149.52 yen/$ at the previous year end and a revised forecast rate of 147.6.
| Item (Billion yen) | FY2025/3 | FY2026/3 | Change | FY2026/3 Revised Forecast | vs. Revised Forecast |
|---|---|---|---|---|---|
| Net sales | 322.6 | 340.2 | +5.5% | 339.0 | 100.3% |
| Domestic | 243.2 | 251.5 | +3.4% | 251.4 | 100.1% |
| Overseas | 79.4 | 88.6 | +11.6% | 87.6 | 101.1% |
| Operating profit | 29.1 | 26.2 | -10.0% | 26.0 | 100.7% |
| Operating margin | 9.0% | 7.7% | -1.3pts | 7.7% | +0.0pts |
| Operating profit: Domestic | 26.1 | 22.1 | -15.2% | 21.9 | 101.0% |
| Operating profit: Overseas | 3.0 | 4.1 | +36.1% | 4.1 | 99.1% |
| Ordinary profit | 29.8 | 27.1 | -9.2% | 26.3 | 103.0% |
| Net profit (profit attributable to owners of parent) | 20.9 | 17.3 | -17.0% | 17.5 | 99.0% |
| EBITDA | 43.5 | 43.2 | -0.7% | 43.0 | 100.5% |
| EBITDA margin | 13.5% | 12.7% | -0.8pts | 12.7% | +0.0pts |
| EBITDA: Domestic | 36.7 | 35.0 | -4.8% | 34.9 | 100.3% |
| EBITDA: Overseas | 6.8 | 8.2 | +21.5% | 8.1 | 101.3% |
On the reference profit and loss statement (million yen), net sales were 340,151 (+5.5% YoY), gross profit 110,804 (32.6% of sales, +0.8%), SG&A expenses 84,630 (24.9% of sales, +4.7%), operating profit 26,173 (7.7%, -10.0%), ordinary profit 27,091 (8.0%, -9.2%) and net profit 17,329 (5.1%, -17.0%). Within SG&A, selling expenses were 14,190, distribution 25,861, labor 26,354 and others 18,224.
Segment Results: Domestic Business
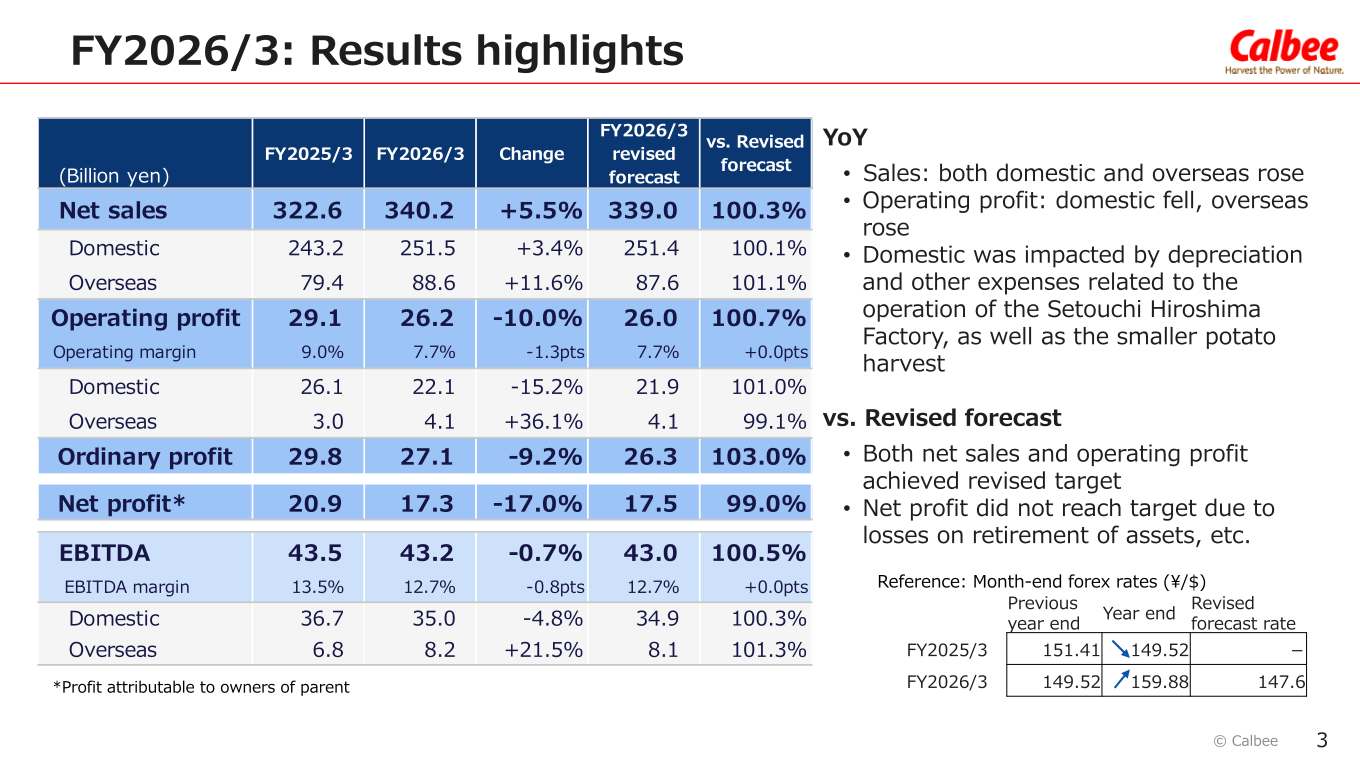
Domestic sales rose on the effect of price/content revisions and higher sales volumes of non-potato-based snacks and cereals. Potato Chips sales were flat YoY on the impact of the smaller potato harvest, and in Others the personalized food program Body Granola grew. In snacks (sales +4%), Potato Chips sales volume fell 1% on the impact of the smaller potato harvest and lower quality, with sales promotion activities resumed from late February and sales volume surpassing the revised target; JagaRico sales volume also fell 1% for the full year due to the continued impact of lower potato quality as well as a smaller harvest in H2. Net sales rose in all Other snacks categories, helped by the fabricated potato chip Crisp and the bean-based snack miino, and by Calbee’s marketing collaboration with affiliate Japan Frito-Lay in corn-based snacks. Cereals sales rose 2%, with a 38.5% cereals market share (+0.7pts).
| Item (Billion yen) | FY2026/3 | Change (YoY) | Change % |
|---|---|---|---|
| Domestic sales | 251.5 | +8.3 | +3.4% |
| Snacks | 234.2 | +8.8 | +3.9% |
| Potato Chips | 102.5 | -0.3 | -0.3% |
| JagaRico | 50.3 | +2.0 | +4.2% |
| Other snacks | 81.4 | +7.1 | +9.5% |
| Cereals | 30.1 | +0.7 | +2.2% |
| Others (Agri, Food and health, Services) | 17.2 | +0.3 | +1.9% |
| Rebates deducted from sales | -29.9 | -1.4 | — |
| Domestic operating profit | 22.1 | -4.0 | -15.2% |
| Operating margin | 8.8% | -1.9pts | — |
| EBITDA | 35.0 | -1.8 | -4.8% |
| EBITDA margin | 13.9% | -1.2pts | — |
| Gift snack items | 18.7 | +0.9 | +5.3% |
Amounts for sales of Snacks, Cereals and Others (Agri, Food and health, Services) are prior to deduction of rebates, etc. On domestic market share, the FY2026/3 totals were 66.8% for potato chips (1.9pt decline), 51.0% for snacks (0.9pt decline), 57.9% for granola (0.2pt decline) and 38.5% for cereals (0.7pt increase). By snack category, FY2026/3 shares were 72.3% for potato-based snacks (0.7pt decline), 56.4% for flour-based snacks (0.7pt decline), 21.7% for corn-based snacks (1.1pt increase) and 58.9% for bean-based snacks (3.8pt increase).
Segment Results: Overseas Business
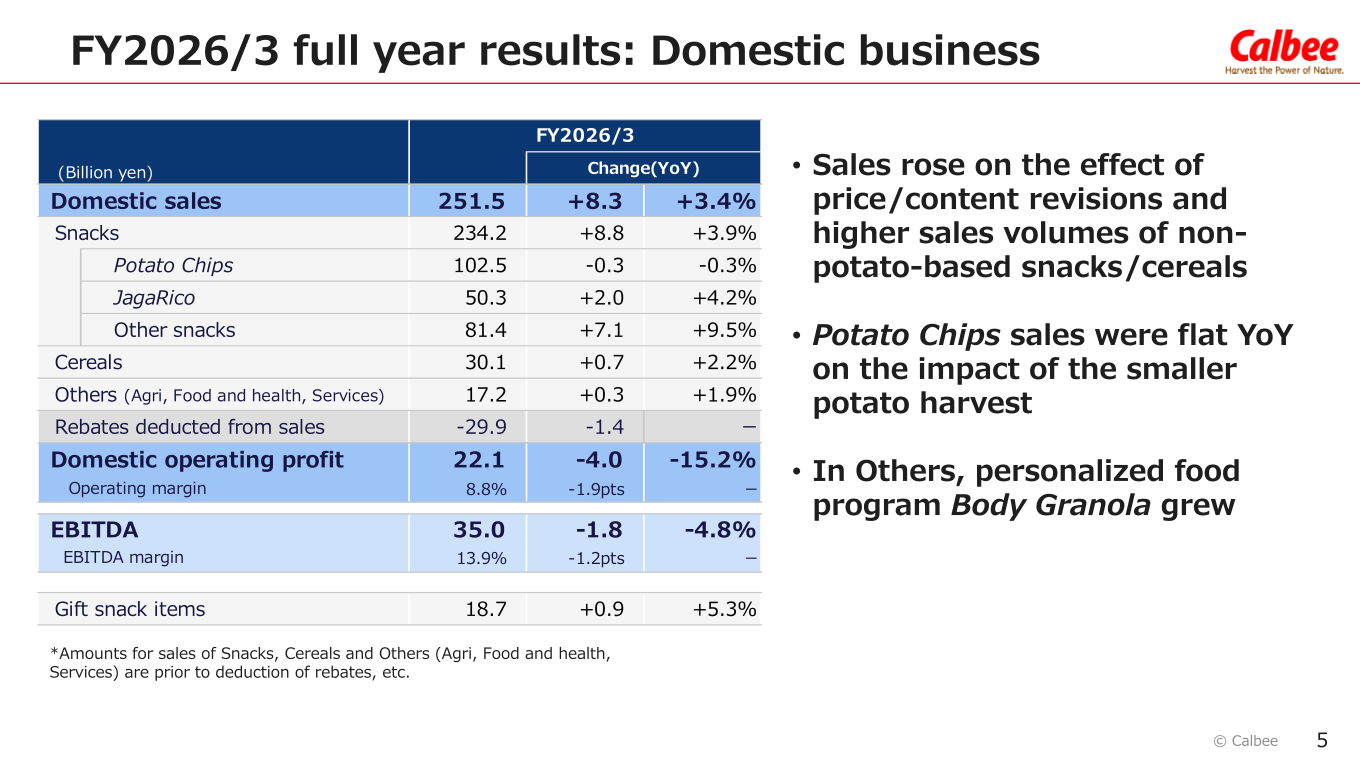
The company states that it leveraged its geographical portfolios to achieve record results, stably growing sales for double-digit increases in sales and profit. In Europe/Americas, net sales rose on contributions from sales expansion of core brands in North America and the UK, as well as sales from Hodo, Inc., which became a consolidated subsidiary in August, and operating income rose as lower profit in the UK was offset by successful measures to improve profit in North America (existing). In Asia/Oceania, net sales rose in all regions, with double-digit increases in sales and profit in Greater China and Australia/New Zealand offsetting lower profit in Indonesia.
| Item (Billion yen) | FY2026/3 | Change (YoY) | Change % | Change ex. Forex % |
|---|---|---|---|---|
| Overseas sales | 88.6 | +9.2 | +11.6% | +11.5% |
| Europe/Americas | 46.7 | +4.0 | +9.4% | +8.7% |
| North America (existing) | 28.5 | +0.2 | +0.5% | +1.6% |
| Asia/Oceania | 51.1 | +5.1 | +11.0% | +11.4% |
| Greater China | 17.5 | +2.0 | +12.8% | +12.4% |
| Rebates deducted from sales | -9.2 | +0.2 | — | — |
| Overseas operating profit | 4.06 | +1.08 | +36.1% | — |
| Operating margin | 4.6% | +0.8pts | — | — |
| Operating profit: Europe/Americas | 0.95 | +0.41 | +76.6% | — |
| Operating profit: North America (existing) | 1.20 | +0.99 | +470.0% | — |
| Operating profit: Asia/Oceania | 3.11 | +0.66 | +27.1% | — |
| Operating profit: Greater China | 1.48 | +0.66 | +80.1% | — |
| EBITDA | 8.25 | +1.46 | +21.5% | — |
| EBITDA margin | 9.3% | +0.8pts | — | — |
| EBITDA: Europe/Americas | 4.08 | +0.75 | +22.6% | — |
| EBITDA: North America (existing) | 2.79 | +0.84 | +42.8% | — |
| EBITDA: Asia/Oceania | 4.17 | +0.71 | +20.5% | — |
| EBITDA: Greater China | 1.77 | +0.66 | +59.6% | — |
Sales by region are amounts prior to deduction of rebates, etc. Europe/Americas includes the new business Hodo, Inc., while North America (existing) excludes it. From FY2026/3 the company changed the method of recording sales before rebates, etc., in Greater China, and sales for the prior fiscal year have also been adjusted accordingly. In North America (existing), sales rose 2% in US dollar terms, helped by expanded distribution of Harvest Snaps mainly to key retail chains and continued strong sales of locally produced Asian Style Chips, while sales for brands of Japanese origin fell amid an increasingly competitive environment for Asian/ethnic foods. Sales in Greater China rose 12% in renminbi terms, with retail store sales up 14% and EC up 8%.
FY2027/3 Forecast
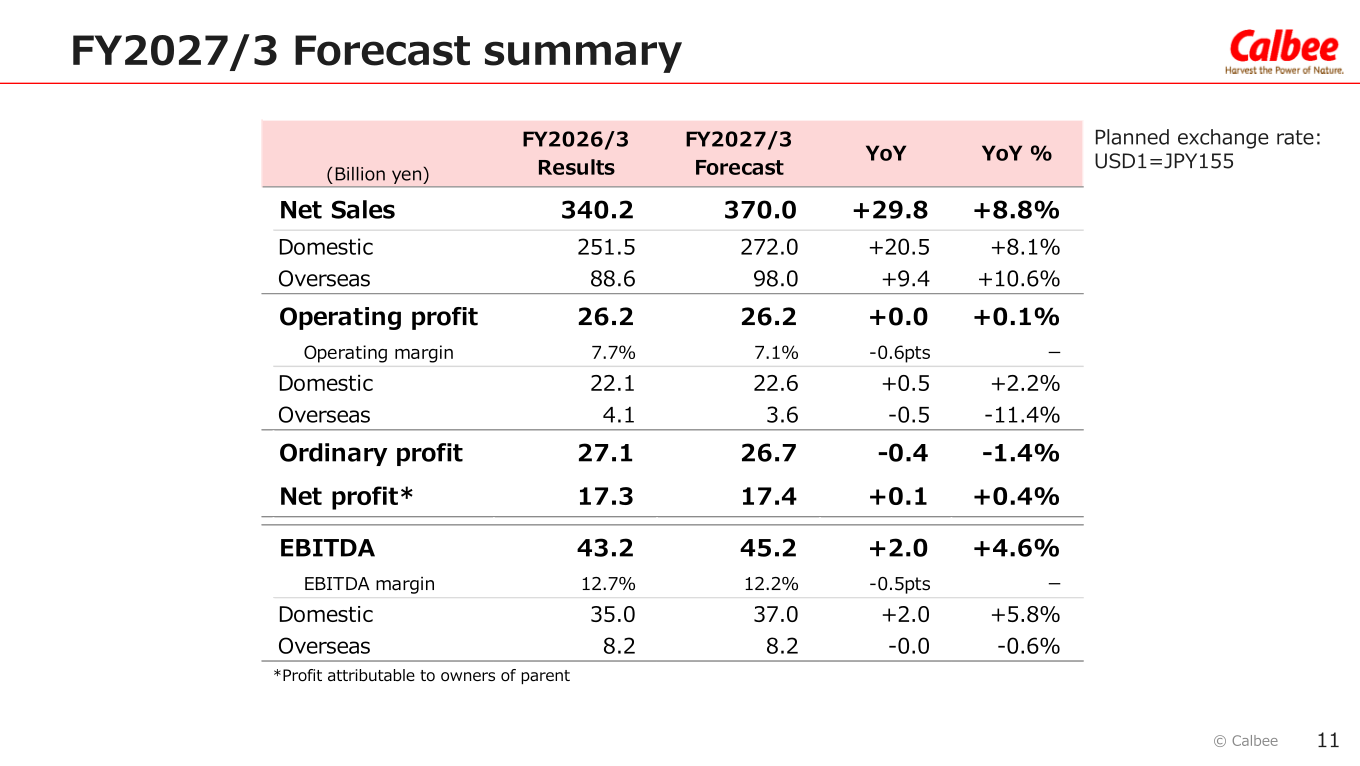
For FY2027/3 Calbee forecasts a 29.8 billion yen increase in net sales, with operating profit expected to be flat YoY. Due to the situation in the Middle East the company forecasts a negative impact on operating profit of 3.0bn yen this fiscal year, including measures such as price/content revisions and cost controls, and has incorporated this into the results forecast; it says it will make stable product supply its top priority. Responses include price/content revisions, securing supply of and warehousing for substitute ingredients, cost controls, and a change in packaging material from May — based on the impact on petrochemical products, core product packaging will use two ink colors to secure stable supply, with rollout from late May 2026. A further price and content revision is scheduled for September 2026 on gift snack items (partial), with prices up 3-10%. The forecast assumes a planned exchange rate of USD1=JPY155.
| Item (Billion yen) | FY2026/3 Results | FY2027/3 Forecast | YoY | YoY % |
|---|---|---|---|---|
| Net sales | 340.2 | 370.0 | +29.8 | +8.8% |
| Domestic | 251.5 | 272.0 | +20.5 | +8.1% |
| Overseas | 88.6 | 98.0 | +9.4 | +10.6% |
| Operating profit | 26.2 | 26.2 | +0.0 | +0.1% |
| Operating margin | 7.7% | 7.1% | -0.6pts | — |
| Operating profit: Domestic | 22.1 | 22.6 | +0.5 | +2.2% |
| Operating profit: Overseas | 4.1 | 3.6 | -0.5 | -11.4% |
| Ordinary profit | 27.1 | 26.7 | -0.4 | -1.4% |
| Net profit (profit attributable to owners of parent) | 17.3 | 17.4 | +0.1 | +0.4% |
| EBITDA | 43.2 | 45.2 | +2.0 | +4.6% |
| EBITDA margin | 12.7% | 12.2% | -0.5pts | — |
| EBITDA: Domestic | 35.0 | 37.0 | +2.0 | +5.8% |
| EBITDA: Overseas | 8.2 | 8.2 | -0.0 | -0.6% |
By business, the FY2027/3 forecast puts domestic sales at 272.0 billion yen (+20.5, +8.1%), comprising snacks of 246.7 (+12.5, +5.3%) — Potato Chips 110.9 (+8.4, +8.2%), JagaRico 53.3 (+3.0, +6.0%) and other snacks 82.5 (+1.1, +1.4%) — cereals of 32.4 (+2.3, +7.8%), new categories/others of 24.9 (+7.7, +44.9%) and rebates deducted from sales of -32.0 (-2.1). Overseas sales are forecast at 98.0 billion yen (+9.4, +10.6%), with Europe/Americas at 54.0 (+7.3, +15.7%), of which North America (existing) is 31.9 (+3.4, +11.9%), Asia/Oceania at 56.0 (+4.9, +9.6%) and rebates deducted from sales of -12.0 (-2.8).
Shareholder Returns
For FY2026/3 the dividend per share was 66 yen, an increase of 8 yen YoY, with a reference consolidated dividend payout ratio of 47.2% and DOE of 3.9%. For FY2027/3 the company plans to raise the dividend in line with its new policy of a “progressive dividend by +3 yen/year”, forecasting a dividend per share of 69 yen (+3 yen YoY), with a reference consolidated dividend payout ratio of 48.2% and DOE of 3.9%. Under the Change 2025 plan the shareholder returns policy was to aim for DOE of 4%, a total return ratio of over 50% and continually growing dividends; the total return ratio was 104% in FY2026/3 and 58% over the three years. Cash flows from financing activities for FY2026/3 included the purchase of treasury shares of -9,999 million yen and proceeds from long-term borrowings of -10,000 million yen as shown in the company’s notes.
| Item | FY2024/3 | FY2025/3 | FY2026/3 | FY2027/3 (Forecast) |
|---|---|---|---|---|
| Dividend per share (yen) | 56 | 58 | 66 | 69 |
| DOE | 3.8% | 3.7% | 3.9% | 3.9% |
| Total return ratio | 35% | 35% | 104% | — |
| Consolidated dividend payout ratio | — | — | 47.2% | 48.2% |
On capital investment, FY2026/3 efficiency investment covered the Setouchi Hiroshima Factory and automation and DX-related investment, while growth investment covered land acquisition for the new Kanto Factory, R&D facility establishment investment and the Hodo, Inc. acquisition cost. For FY2027/3, growth investment is to expand production facilities to raise domestic and overseas profitability, invest in utilization of low-quality potatoes and invest in building a DX foundation, while business continuity investment is to update aging equipment and invest in labor-saving.
Medium-Term Plan and Topics
FY2026/3 was the final year of the Change 2025 growth guidance covering FY2024/3-FY2026/3. Against a growth guidance of +4-6% for the organic sales growth ratio, results were +8% in FY2024/3, +6% in FY2025/3 and +5% in FY2026/3, with a three-year plan evaluation of +7%. Consolidated operating profit growth was guided at +6-8% and came in at +23%, +6% and -10% respectively, with a three-year evaluation of +6%. ROE was guided at 10% or more and was 10.9%, 10.5% and 8.3%. Domestic operating profit growth was guided at +6-8% and was +22%, +9% and -15%, with a three-year evaluation of +4%. The overseas sales ratio was guided at 30-35% and reached 24%, 25% and 26%, while the new areas sales ratio was guided at 5% and reached 4.3%, 4.3% and 4.8%.
The company says it will advance key initiatives to enhance medium- to long-term corporate value in line with the new “Accelerate the Future” growth strategy, even amid a fluid situation. Under the FY2027/3 forecast guideline, the organic sales growth ratio is +9% for FY2027/3 against +7% for FY2024/3-FY2026/3 results and a FY2027/3-FY2031/3 target of +7% to +9%; the EBITDA growth ratio is +5% against +8% and a target of +10% or more; the EBITDA margin is 12.2% against 12.7% in FY2026/3 and a target of 14% or more by FY2031/3; the growth areas (overseas/new categories) sales ratio is 33% against 31% in FY2026/3 and a target of 40-45% by FY2031/3; ROE is 8.1% against 8.3% in FY2026/3 and a target of 10% or more by FY2031/3; the net profit growth ratio is +0.4% against +5% and a target of +10% or more; and ROIC is 7.8% against 8.0% in FY2026/3 and a target of 8% or more by FY2031/3.
On the balance sheet, total assets stood at 327,609 million yen as of March 31, 2026 (+8,440 YoY), net assets at 221,774 million yen (+6,706) and the equity ratio at 64.3% (-0.0pts), with net cash of 13,503 million yen (-6,690). Cash flows from operating activities were 35,596 million yen, from investing activities -26,211 million yen and from financing activities -17,002 million yen. The FY2026/3 operating profit analysis attributes the year-on-year decline mainly to raw material and energy costs (-5.0bn yen), other costs (-5.2bn yen, including cost increases of -3.1bn yen due to the launch of the Setouchi Hiroshima Factory) and other SG&A expenses (-2.3bn yen), partly offset by the effect of sales volume and price/content revisions (+7.7bn yen).
This article is an analysis based on publicly available information and is not a recommendation to buy or sell any specific securities. Investment decisions are your own responsibility.
![[Obayashi] Investors’ Guide 2026 — The Complete 24-Article Breakdown](https://japan-equity.com/wp-content/uploads/2026/07/hub_cover-1024x1024.png)
![[Obayashi] IR & SR Policy — Feeding Dialogue Back into Management](https://japan-equity.com/wp-content/uploads/2026/07/p32_sq-1024x1024.jpg)
![[Obayashi] Domestic Civil Engineering — Resilience Spending Supports 9.6% Margin](https://japan-equity.com/wp-content/uploads/2026/07/p11_sq-1024x1024.jpg)
![[Obayashi] Overseas Construction — Orders Reach ¥1.2tn](https://japan-equity.com/wp-content/uploads/2026/07/p15_sq-1024x1024.jpg)
![[Obayashi] Share Price & External Ratings — vs TOPIX, ESG Index Inclusion](https://japan-equity.com/wp-content/uploads/2026/07/p40_sq-1024x1024.jpg)
![[Construction] ¥75.5tn Investment, Shrinking Workforce — Big-5 Market Share](https://japan-equity.com/wp-content/uploads/2026/07/p12_sq-1024x1024.jpg)



![[Obayashi] Capital Policy & Shareholder Returns — ROE 10%+, DOE ~5%, ¥100bn Buyback](https://japan-equity.com/wp-content/uploads/2026/07/p27_sq-1024x1024.jpg)
![[Obayashi] Reducing Cross-Shareholdings — ¥285.2bn Sold in Five Years](https://japan-equity.com/wp-content/uploads/2026/07/p29_sq-1024x1024.jpg)
![[Obayashi] ¥750bn Investment Plan — ¥300bn to Development, ¥190bn to Tech/DX](https://japan-equity.com/wp-content/uploads/2026/07/p30_sq-1024x1024.jpg)
![[Obayashi] MTP2022 KPIs — Operating Profit ~2x Target, ROE 14.4%](https://japan-equity.com/wp-content/uploads/2026/07/p25_sq-1024x1024.jpg)
![[Obayashi] Cash Allocation — ¥420bn Investment CF Over Five Years](https://japan-equity.com/wp-content/uploads/2026/07/p26_sq-1024x1024.jpg)
![[Obayashi] Green Energy — 44 Plants, 344MW, and the Green Hydrogen Challenge](https://japan-equity.com/wp-content/uploads/2026/07/p21_sq-1024x1024.jpg)
![[Obayashi] Tackling the Labor Shortage — Robotics Construction®](https://japan-equity.com/wp-content/uploads/2026/07/p14_sq-1024x1024.jpg)
