
This article is based on publicly available IR materials and is not a recommendation to buy or sell any specific securities.
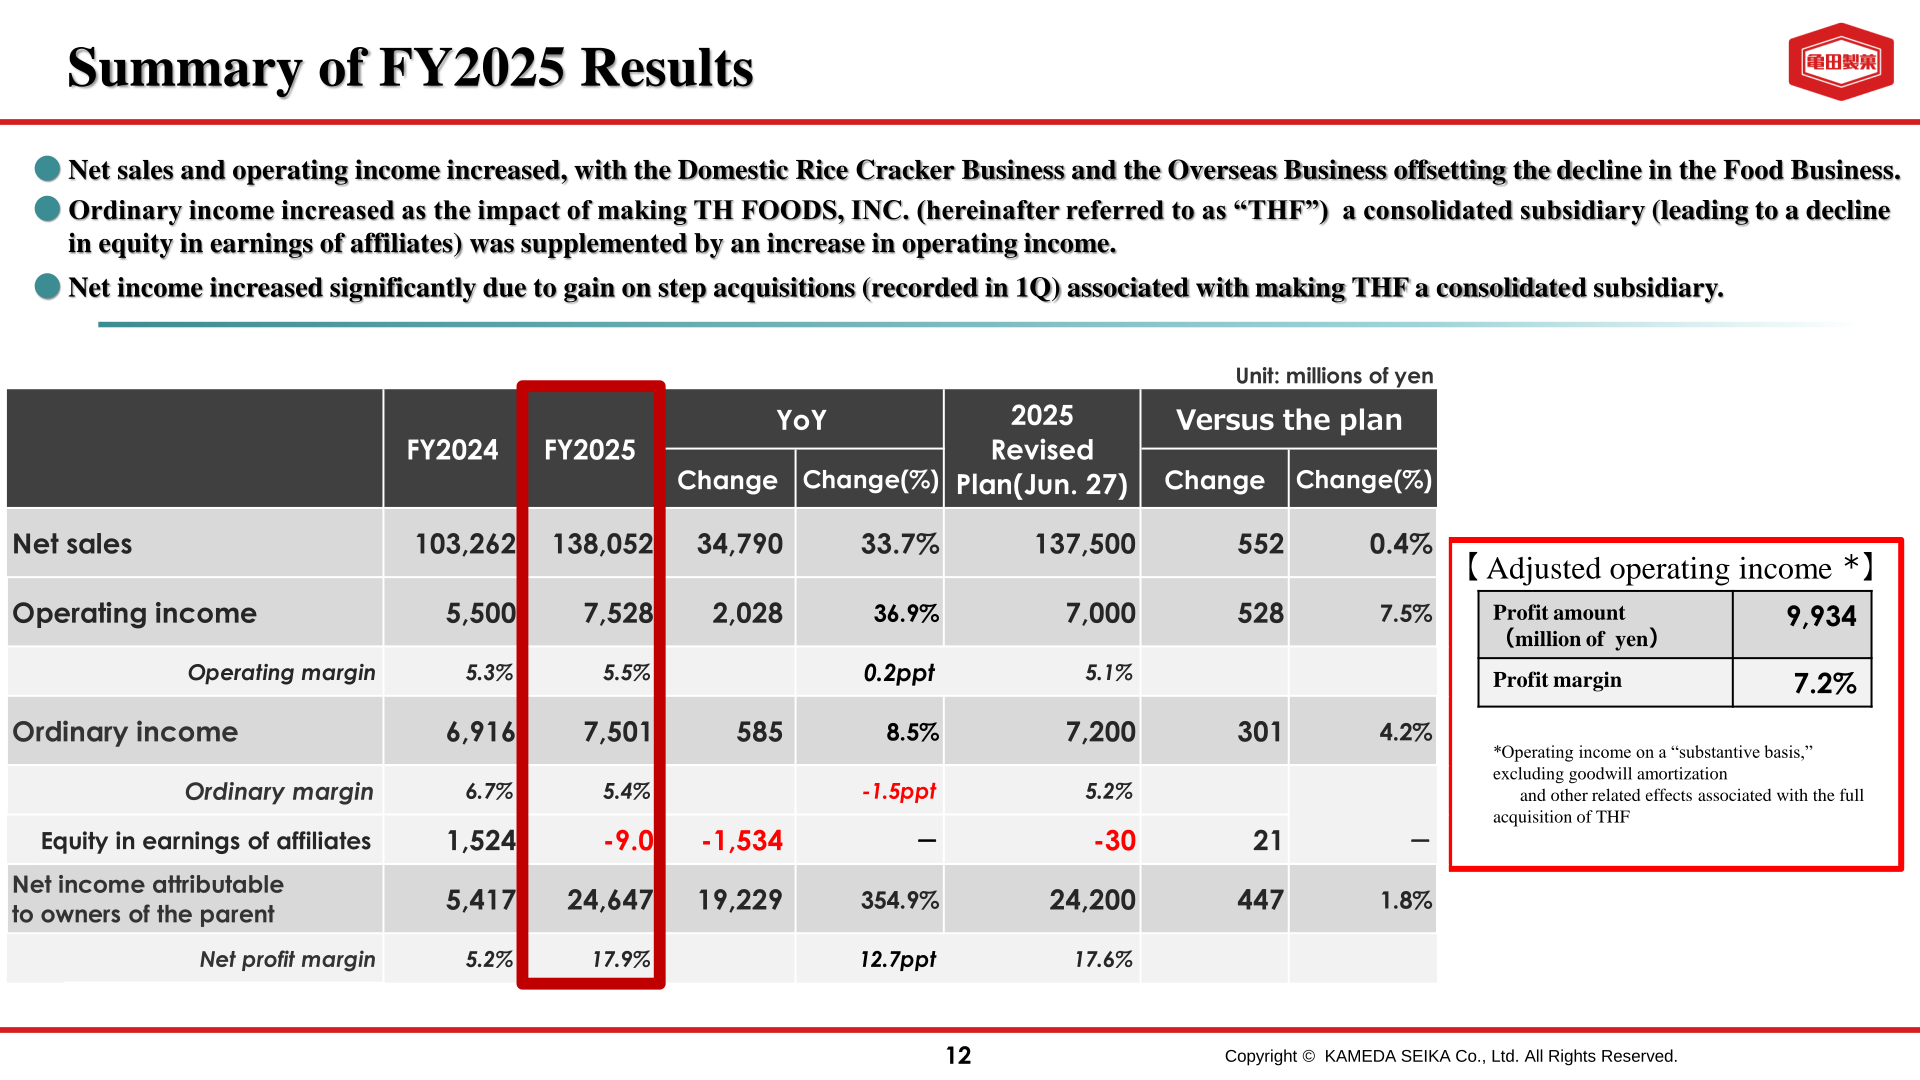
Kameda Seika Co., Ltd. reported record-high results for FY2025, the fiscal year ended March 31, 2026. Net sales rose 33.7% year on year to 138,052 million yen and operating income rose 36.9% to 7,528 million yen, with the Domestic Rice Cracker Business and the Overseas Business offsetting a decline in the Food Business. Net income attributable to owners of the parent jumped 354.9% to 24,647 million yen, reflecting a gain on step acquisitions recorded in the first quarter in connection with making TH FOODS, INC. (“THF”) a consolidated subsidiary. The company describes FY2025 as a smooth first year following the update of its Medium-term Business Plan.
Consolidated Results (Full-Year Actual)
Net sales, operating income, adjusted operating income and EBITDA were all flagged as record highs in the presentation. Ordinary income rose 8.5% to 7,501 million yen, as the decline in equity in earnings of affiliates caused by the consolidation of THF was supplemented by the increase in operating income. All four headline lines also came in ahead of the revised plan announced on June 27, 2025: net sales beat the 137,500 million yen plan by 552 million yen (+0.4%), operating income beat the 7,000 million yen plan by 528 million yen (+7.5%), ordinary income beat the 7,200 million yen plan by 301 million yen (+4.2%) and net income beat the 24,200 million yen plan by 447 million yen (+1.8%).
| Item (millions of yen) | FY2024 | FY2025 | Change | Change (%) |
|---|---|---|---|---|
| Net sales | 103,262 | 138,052 | 34,790 | 33.7% |
| Operating income | 5,500 | 7,528 | 2,028 | 36.9% |
| Operating margin | 5.3% | 5.5% | 0.2ppt | — |
| Ordinary income | 6,916 | 7,501 | 585 | 8.5% |
| Ordinary margin | 6.7% | 5.4% | -1.5ppt | — |
| Equity in earnings of affiliates | 1,524 | -9.0 | -1,534 | — |
| Net income attributable to owners of the parent | 5,417 | 24,647 | 19,229 | 354.9% |
| Net profit margin | 5.2% | 17.9% | 12.7ppt | — |
| Adjusted operating income | — | 9,934 | — | — |
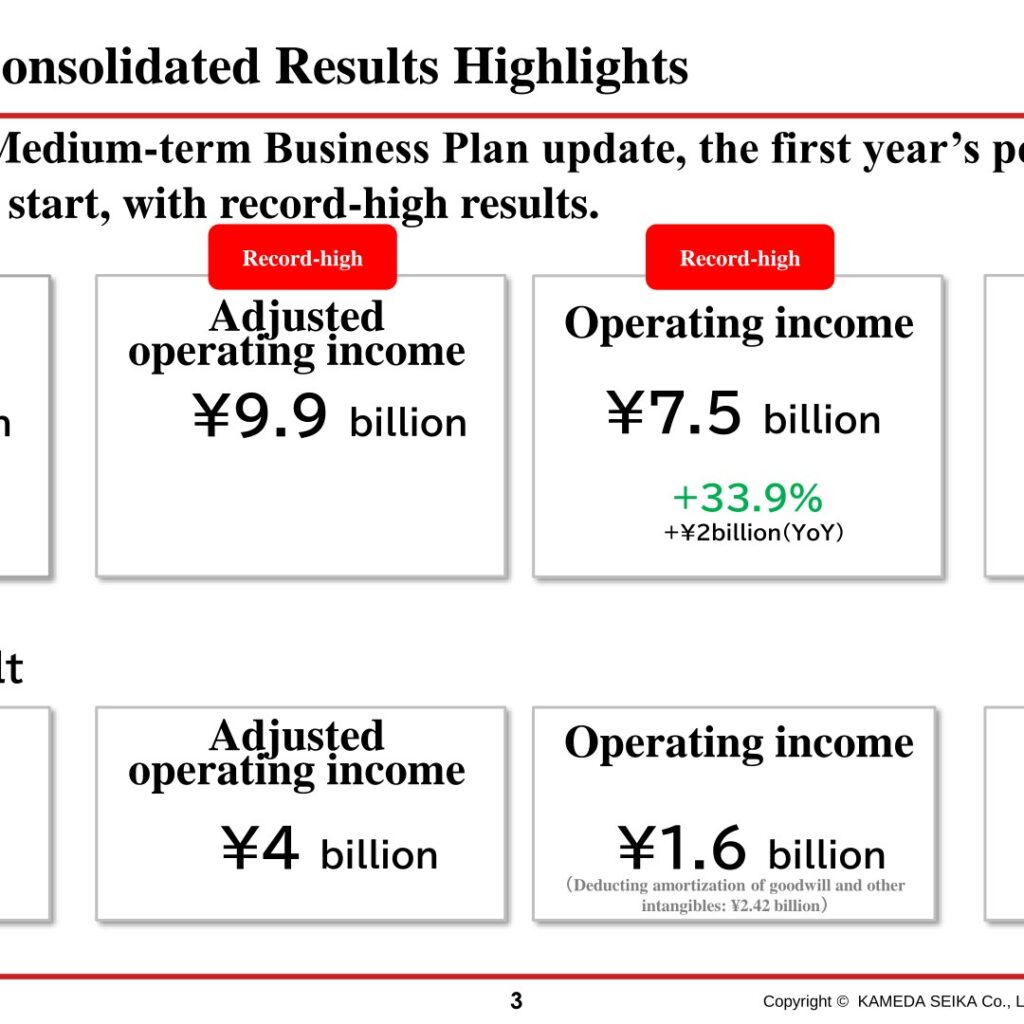
Adjusted operating income, defined in the materials as operating income on a “substantive basis” excluding goodwill amortization and other related effects associated with the full acquisition of THF, was 9,934 million yen for a 7.2% profit margin. On a group-wide basis, the presentation also shows net sales of 138.1 billion yen, adjusted operating income of 9.9 billion yen, operating income of 7.5 billion yen and EBITDA of 18 billion yen. TH FOODS contributed net sales of 39.2 billion yen, adjusted operating income of 4 billion yen, operating income of 1.6 billion yen (after deducting amortization of goodwill and other intangibles of 2.42 billion yen) and EBITDA of 6.3 billion yen.
Segment Results
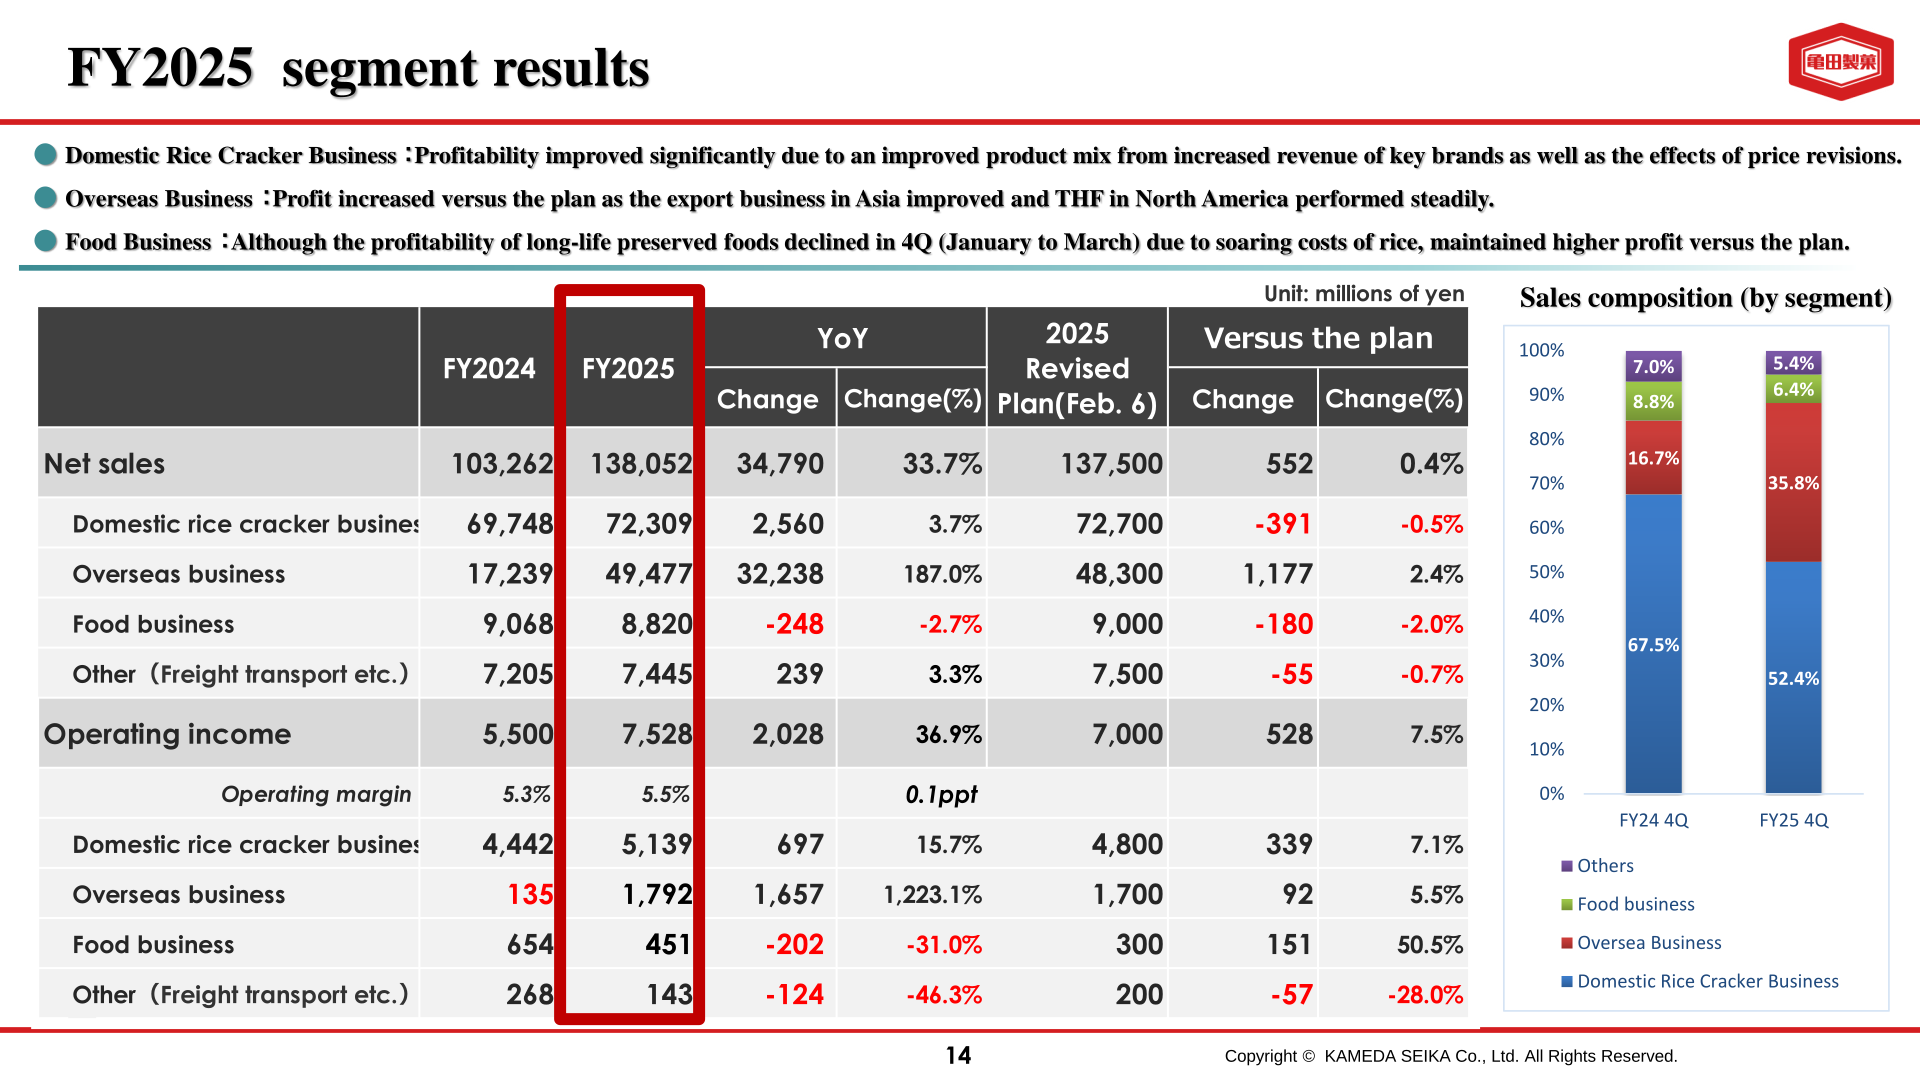
In the Domestic Rice Cracker Business, profitability improved significantly on an improved product mix from higher revenue of key brands and the effects of price revisions implemented in July (“Kaki-no-Tane”) and September (soft series brands). In the Overseas Business, profit exceeded the plan as the Asian export business improved and THF in North America performed steadily; the segment’s net sales nearly tripled as THF was consolidated. In the Food Business, profitability of long-life preserved foods declined in the fourth quarter (January to March) on soaring rice costs, although profit still came in above plan. Operating income by segment was compared against the revised plan of February 6, 2025.
| Segment (millions of yen) | Metric | FY2024 | FY2025 | Change (%) |
|---|---|---|---|---|
| Domestic rice cracker business | Net sales | 69,748 | 72,309 | 3.7% |
| Overseas business | Net sales | 17,239 | 49,477 | 187.0% |
| Food business | Net sales | 9,068 | 8,820 | -2.7% |
| Other (Freight transport etc.) | Net sales | 7,205 | 7,445 | 3.3% |
| Domestic rice cracker business | Operating income | 4,442 | 5,139 | 15.7% |
| Overseas business | Operating income | 135 | 1,792 | 1,223.1% |
| Food business | Operating income | 654 | 451 | -31.0% |
| Other (Freight transport etc.) | Operating income | 268 | 143 | -46.3% |
Sales composition by segment shifted sharply with the consolidation of THF: the Domestic Rice Cracker Business fell from 67.5% of sales in FY24 4Q to 52.4% in FY25 4Q, while the Overseas Business rose from 16.7% to 35.8%. The Food business accounted for 8.8% and 6.4% and Others for 7.0% and 5.4% respectively. Among overseas group companies, TH FOODS, INC. posted net sales of 260,201 thousand USD against 254,944 thousand USD a year earlier (+2.1%), Qingdao Kameda Foods Co., Ltd. 110,145 thousand CNY (+15.4%) and THIEN HA KAMEDA, JSC. 507,687 million VND (+7.0%), while Singha Kameda (Thailand) Co., Ltd. recorded 890,715 thousand THB (-12.2%) and LYLY KAMEDA CO., LTD. 11,915 thousand USD (-23.8%).
Balance Sheet and Cash Flow
With the acquisition of TH FOODS as a subsidiary, total assets expanded 52.0% (+64.3 billion yen) from 123,862 million yen as of March 31, 2025 to 188,223 million yen as of March 31, 2026. Intangible assets including goodwill grew 9.6 times (+43.2 billion yen) to 48,318 million yen, long-term liabilities rose to 53,083 million yen and net assets to 106,466 million yen, with the equity ratio at 54.7% (down 6.3pt). The reference breakdown of THF amortization of goodwill and other intangibles totals 2,421 million yen, comprising goodwill of 730 million yen (weighted-average amortization period of 20 years), customer-related intangible assets of 525 million yen (34 years), trademark assets of 281 million yen (37 years) and property, plant and equipment of 885 million yen (7 years). Consolidated operating cash flow increased 26.0% (+2,458 million yen) from 9.4 billion yen in FY2024 to 11.9 billion yen in FY2025.
FY2026 Plan
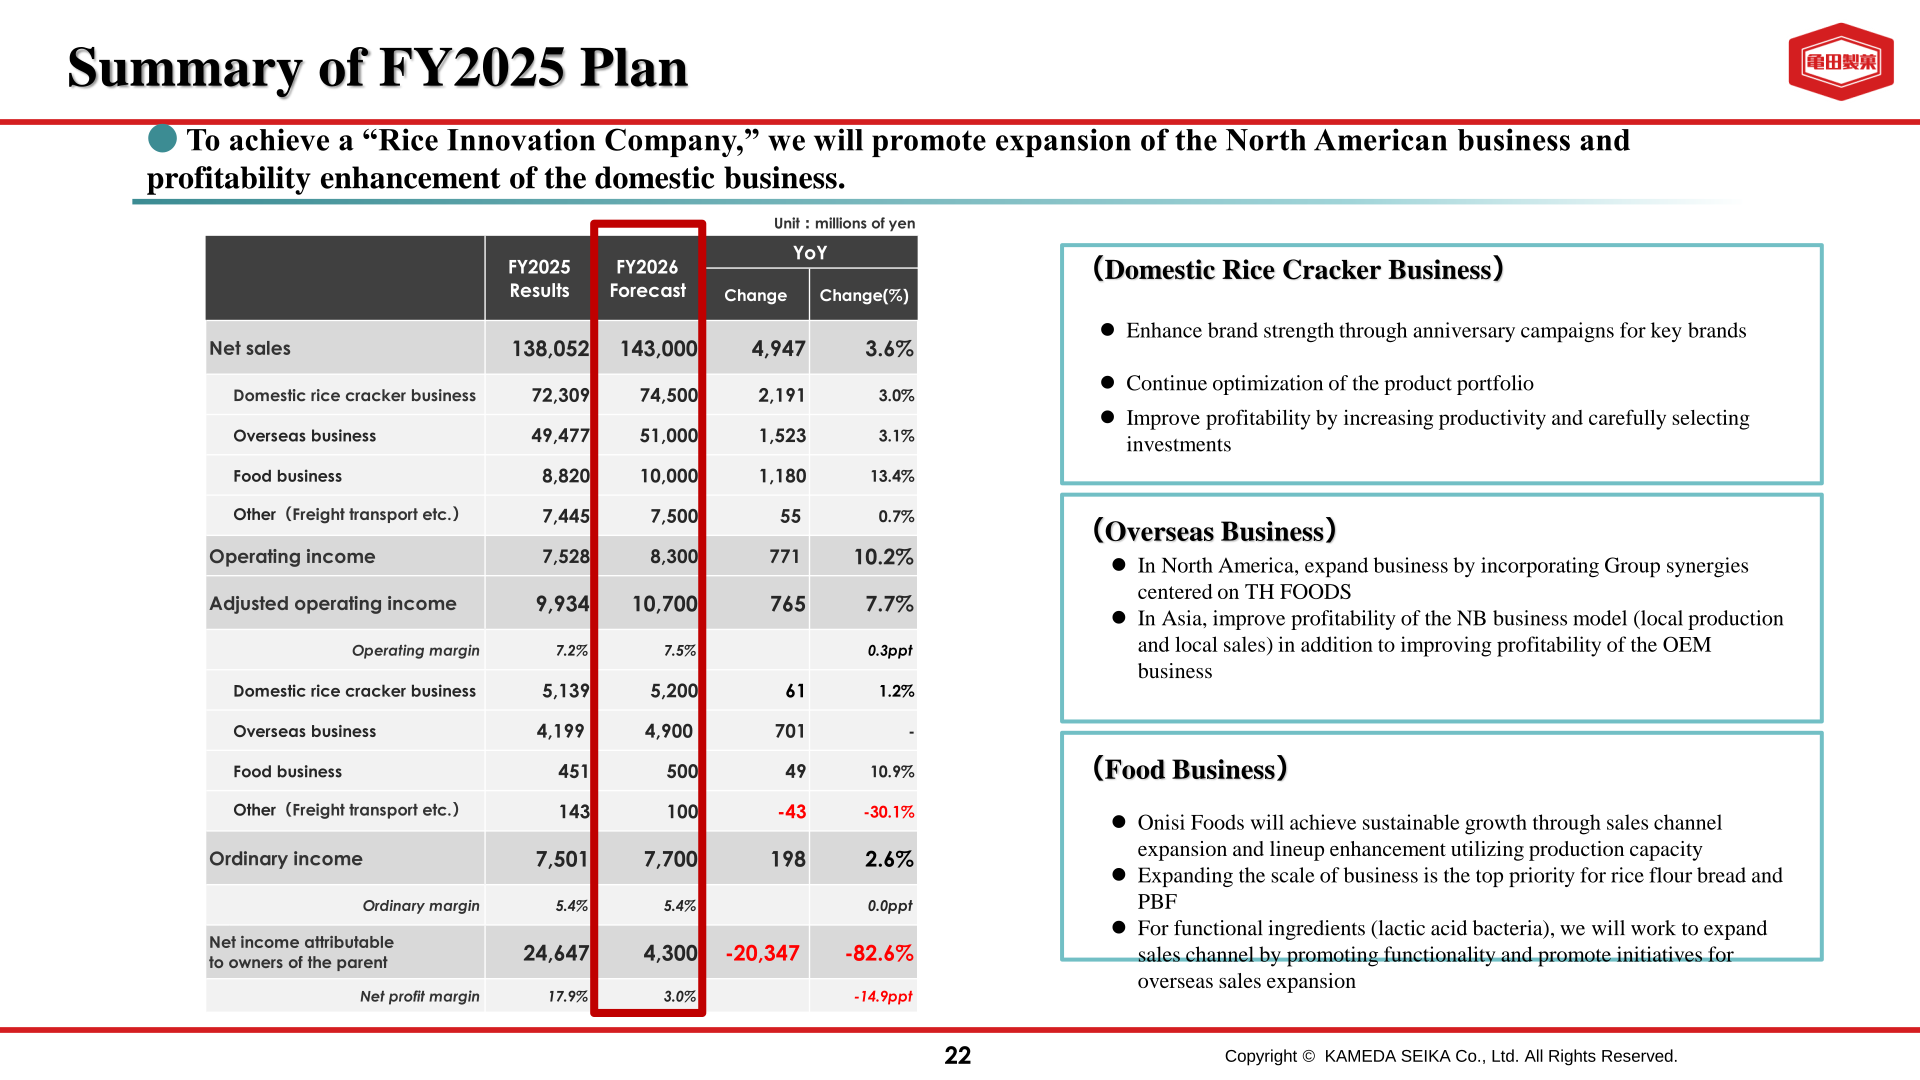
For FY2026, the company plans record-high profits through expansion of the North American business and profitability improvements in the Domestic Rice Cracker Business. Net sales are planned at 143,000 million yen (+3.6%), operating income at 8,300 million yen (+10.2%) and adjusted operating income at 10,700 million yen (+7.7%). Net income attributable to owners of the parent is planned at 4,300 million yen, down 82.6% against the FY2025 figure that included the gain on step acquisitions.
| Item (millions of yen) | FY2025 Results | FY2026 Forecast | Change | Change (%) |
|---|---|---|---|---|
| Net sales | 138,052 | 143,000 | 4,947 | 3.6% |
| Domestic rice cracker business | 72,309 | 74,500 | 2,191 | 3.0% |
| Overseas business | 49,477 | 51,000 | 1,523 | 3.1% |
| Food business | 8,820 | 10,000 | 1,180 | 13.4% |
| Other (Freight transport etc.) | 7,445 | 7,500 | 55 | 0.7% |
| Operating income | 7,528 | 8,300 | 771 | 10.2% |
| Adjusted operating income | 9,934 | 10,700 | 765 | 7.7% |
| Ordinary income | 7,501 | 7,700 | 198 | 2.6% |
| Net income attributable to owners of the parent | 24,647 | 4,300 | -20,347 | -82.6% |
Within the adjusted operating income plan, the Domestic Rice Cracker Business is set at 5,200 million yen (+1.2%), the Overseas Business at 4,900 million yen (+701 million yen), the Food Business at 500 million yen (+10.9%) and Other (Freight transport etc.) at 100 million yen (-30.1%), against FY2025 results of 5,139 million yen, 4,199 million yen, 451 million yen and 143 million yen respectively. The bridge for adjusted operating income from 9,934 million yen in FY2025 to 10,700 million yen in FY2026 assumes a 1,100 million yen effect from increased sales, 700 million yen from the Overseas Business and 300 million yen from manufacturing cost, offset by -540 million yen from raw material unit prices, -380 million yen from promotion and advertising expenses and -260 million yen from logistics cost; the plan includes effects of price revisions of 700 million yen.
Shareholder Returns
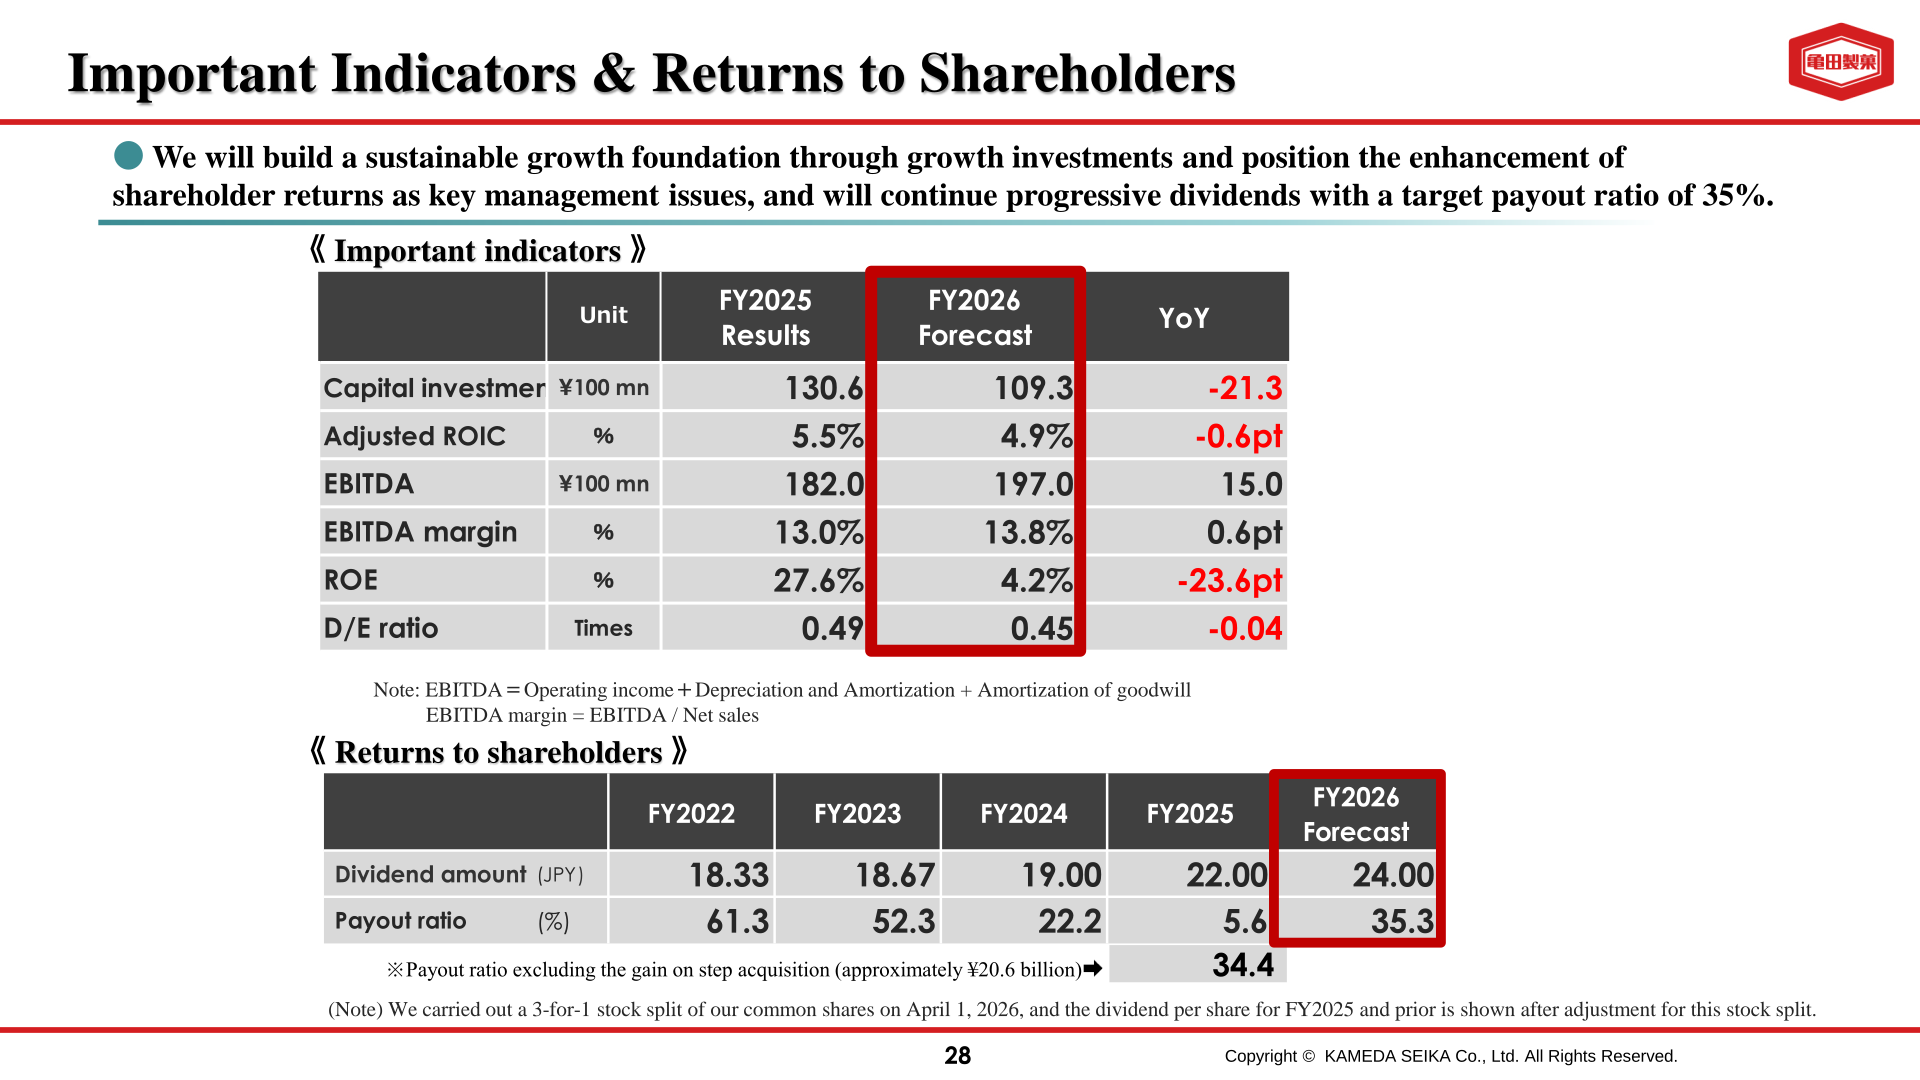
The company positions the enhancement of shareholder returns as a key management issue and will continue progressive dividends with a target payout ratio of 35%. The annual dividend for FY2025 was 22.00 yen per share, with a forecast of 24.00 yen for FY2026. The reported payout ratio for FY2025 was 5.6%, which becomes 34.4% when the gain on step acquisition of approximately 20.6 billion yen is excluded. A 3-for-1 stock split of common shares was carried out on April 1, 2026, and the dividend per share for FY2025 and prior years is shown after adjustment for this split.
| Item | FY2022 | FY2023 | FY2024 | FY2025 | FY2026 Forecast |
|---|---|---|---|---|---|
| Dividend amount (JPY) | 18.33 | 18.67 | 19.00 | 22.00 | 24.00 |
| Payout ratio (%) | 61.3 | 52.3 | 22.2 | 5.6 | 35.3 |
Among the important indicators disclosed, capital investment was 130.6 (100 million yen) in FY2025 against a 109.3 forecast for FY2026, adjusted ROIC was 5.5% against 4.9%, ROE was 27.6% against 4.2% and the D/E ratio was 0.49 times against 0.45 times. The company notes that current ROE has not yet reached its targeted level of capital efficiency — substantive ROE excluding the gain on step acquisitions was 4.5% — and that capital efficiency has been below the cost of capital over the short term as a result of prioritizing North American structural reform and growth investments. Cost of shareholders’ equity is estimated at 4-5% based on CAPM estimates and 6-7% based on investor interviews.
Medium-to-Long-Term Growth Strategy 2030
Under the updated “Medium-to-Long-Term Growth Strategy 2030 — Rice Crackers for the World, Rice for the Future,” the group is moving from “KAMEDA 2.0,” which focuses on structural reform of the North American business, sustainable growth in domestic rice crackers and full-scale expansion of the food business, to “KAMEDA 3.0,” aimed at becoming a “Rice Innovation Company” by FY2030. For the FY2027 milestone the strategy describes an overseas sales ratio reaching 37% and cumulative operating cash flow over the past three years totaling 46 billion yen, and for FY2030 an overseas sales ratio of 43% and cumulative three-year operating cash flow of 54 billion yen. For reference, in FY2024 the overseas business net sales ratio was 17% and single-year operating cash flow was 9.4 billion yen.
| Item | FY2025 (Actual) | FY2026 (Plan) | FY2027 (Target) | FY2030 (Target) |
|---|---|---|---|---|
| Consolidated net sales (hundreds of millions of yen) | 1,381 | 1,430 | 1,470 | 1,600 |
| Overseas sales ratio | 35.8% | 35.7% | 37% | 43% |
| Adjusted operating income (hundreds of millions of yen) | 99 | 107 | 115 | 145 |
| Adjusted operating income margin | 7.2% | 7.5% | 7.8% | 9.1% |
| Adjusted ROIC | 5.5% | 4.9% | 5.1% | 5.7% |
| EBITDA (hundreds of millions of yen) | 180 | 197 | 223 | 260 |
| EBITDA margin | 13.0% | 13.8% | 15.2% | 16.3% |
| Operating income (hundreds of millions of yen) | 75 | 83 | 90 | 120 |
| ROIC | 4.1% | 3.8% | 4.1% | 5.0% |
The North American structural reform is presented as the core of the strategy. TH FOODS is guided to net sales of 265 million USD and adjusted operating income of 32 million USD in FY2026, 280 million USD and 36 million USD in FY2027, and 360 million USD and 41 million USD in FY2030, against FY2025 results of 260 million USD and 26 million USD, with an ambition of 500 million USD of net sales and 50 million USD of adjusted operating income in the early 2030s. Growth is to come from the CRUNCHMASTER own brand, expansion of co-manufacturing (OEM) and private label, and “Lift & Shift” of Kameda products into new categories such as “Usuyaki.”
This article is an analysis based on publicly available information and is not a recommendation to buy or sell any specific securities. Investment decisions are your own responsibility.
















