
This article is based on publicly available IR materials and is not a recommendation to buy or sell any specific securities.
PERSOL HOLDINGS posted record highs in revenue and in all stages of profit for FY2025, the fiscal year ended March 31, 2026. Revenue rose 7.2% year on year to 1,555,833 million yen, operating profit rose 15.8% to 66,512 million yen, and adjusted EBITDA rose 12.6% to 88,176 million yen, with every result exceeding the company’s full-year forecasts. ROIC of 18.2% and ROE of 20.9% both achieved the targets set out in the Mid-term Management Plan 2026. For FY2026 the company plans a further 10.0% increase in adjusted EBITDA and forecasts a record annual dividend of 13.0 yen.
Consolidated Results (Full-Year Actual)
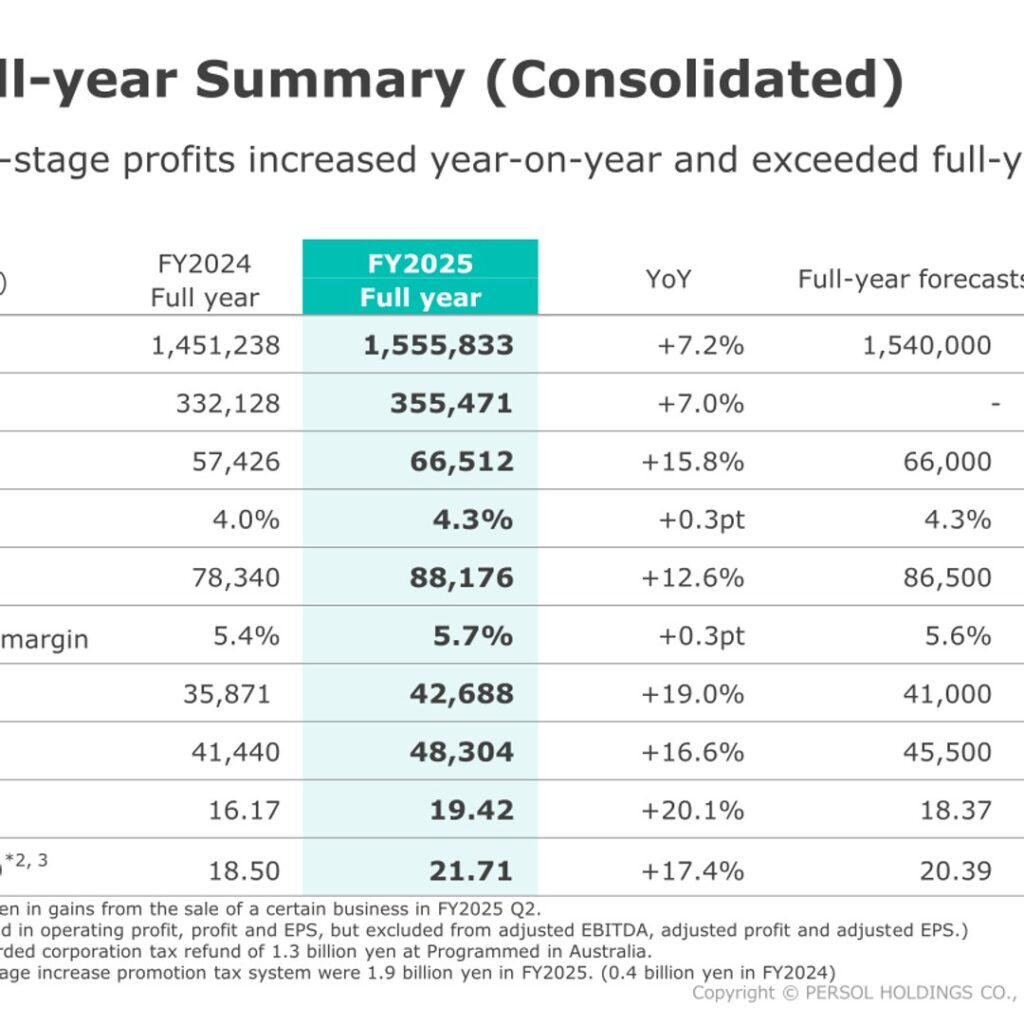
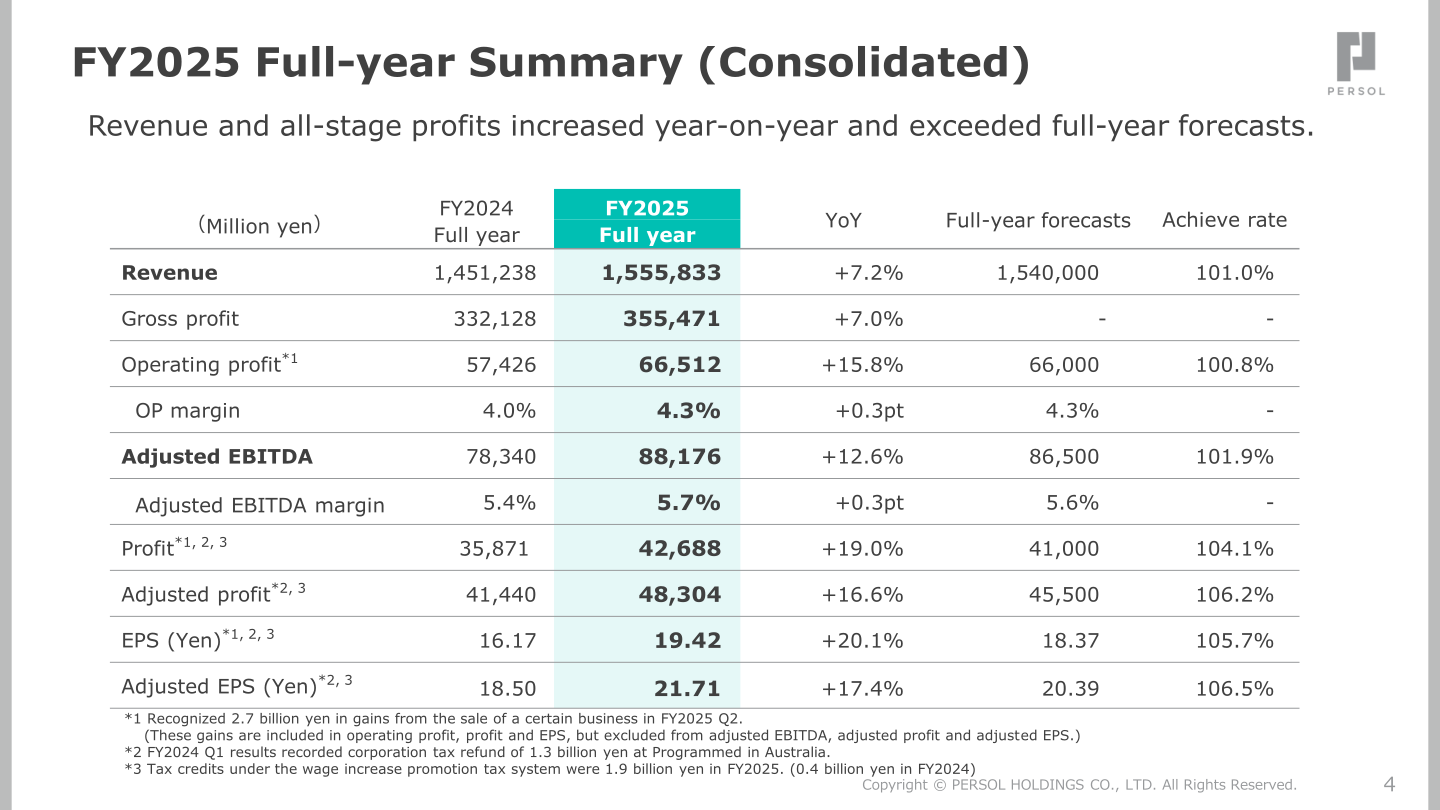
Revenue and all-stage profits increased year on year and exceeded the full-year forecasts. Gross profit grew 7.0% to 355,471 million yen, while the operating profit margin improved 0.3pt to 4.3% and the adjusted EBITDA margin improved 0.3pt to 5.7%. Profit attributable to owners of parent rose 19.0% to 42,688 million yen, an achievement rate of 104.1% against the forecast of 41,000 million yen. The company notes that it recognized 2.7 billion yen in gains from the sale of a certain business in FY2025 Q2 — included in operating profit, profit and EPS, but excluded from adjusted EBITDA, adjusted profit and adjusted EPS — and that tax credits under the wage increase promotion tax system were 1.9 billion yen in FY2025 (0.4 billion yen in FY2024).
| Item (Million yen) | FY2025 Full year | FY2024 Full year | YoY | Full-year forecasts | Achieve rate |
|---|---|---|---|---|---|
| Revenue | 1,555,833 | 1,451,238 | +7.2% | 1,540,000 | 101.0% |
| Gross profit | 355,471 | 332,128 | +7.0% | – | – |
| Operating profit | 66,512 | 57,426 | +15.8% | 66,000 | 100.8% |
| OP margin | 4.3% | 4.0% | +0.3pt | 4.3% | – |
| Adjusted EBITDA | 88,176 | 78,340 | +12.6% | 86,500 | 101.9% |
| Adjusted EBITDA margin | 5.7% | 5.4% | +0.3pt | 5.6% | – |
| Profit | 42,688 | 35,871 | +19.0% | 41,000 | 104.1% |
| Adjusted profit | 48,304 | 41,440 | +16.6% | 45,500 | 106.2% |
| EPS (Yen) | 19.42 | 16.17 | +20.1% | 18.37 | 105.7% |
| Adjusted EPS (Yen) | 21.71 | 18.50 | +17.4% | 20.39 | 106.5% |
Segment Results
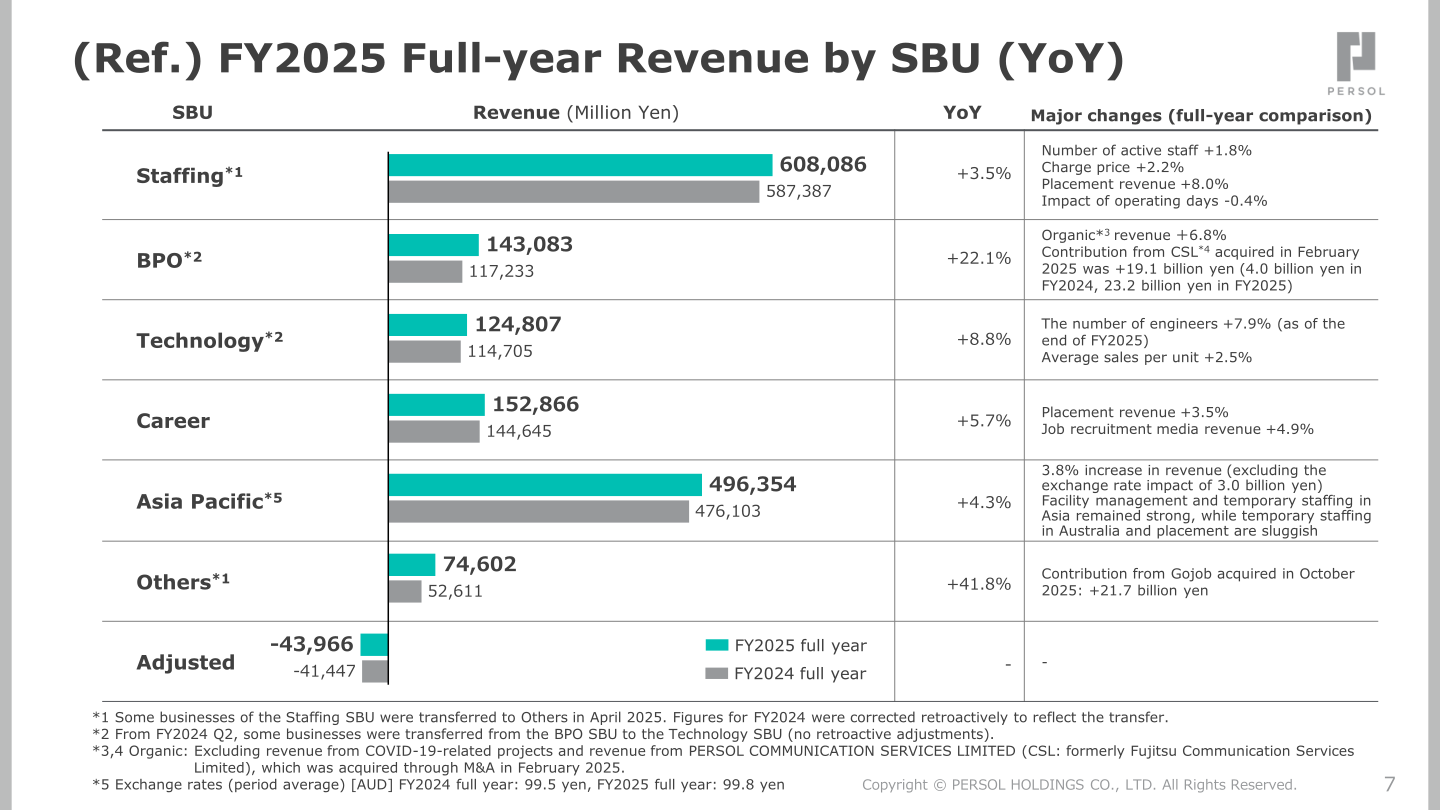
Revenue grew at all six SBUs. In Staffing, the number of active staff rose 1.8% and the charge price rose 2.2%, with placement revenue up 8.0% and an operating-days impact of -0.4%. BPO revenue grew 22.1%, with organic revenue up 6.8% and a contribution of 19.1 billion yen from PERSOL COMMUNICATION SERVICES LIMITED (CSL), acquired in February 2025 (4.0 billion yen in FY2024, 23.2 billion yen in FY2025). Technology revenue grew 8.8% as the number of engineers rose 7.9% at the end of FY2025 and average sales per unit rose 2.5%. Career revenue grew 5.7%, with placement revenue up 3.5% and job recruitment media revenue up 4.9%. Asia Pacific revenue grew 4.3%, or 3.8% excluding an exchange rate impact of 3.0 billion yen, as facility management and temporary staffing in Asia remained strong while temporary staffing in Australia and the placement business were sluggish. Others revenue grew 41.8%, including a 21.7 billion yen contribution from Gojob, acquired in October 2025.
On adjusted EBITDA, BPO rose 54.9% on improved margins from measures such as optimizing SG&A expenses, and Career rose 15.0% on higher revenue and a 12.1% productivity improvement. Asia Pacific declined 10.2%, held back by 2.5 billion yen of temporary factors (system renewal costs of 1.7 billion yen and a year-on-year subsidy difference of 0.8 billion yen in total for Q1 and Q4). The Others deficit narrowed on higher revenue and cost optimization, including a 0.3 billion yen contribution from Gojob, while the Adjusted line worsened on higher SG&A expenses related to system costs and M&A.
| SBU | Revenue FY2025 (Million yen) | Revenue FY2024 (Million yen) | Revenue YoY | Adj. EBITDA FY2025 (Million yen) | Adj. EBITDA FY2024 (Million yen) | Adj. EBITDA YoY |
|---|---|---|---|---|---|---|
| Staffing | 608,086 | 587,387 | +3.5% | 34,804 | 30,996 | +12.3% |
| BPO | 143,083 | 117,233 | +22.1% | 10,329 | 6,667 | +54.9% |
| Technology | 124,807 | 114,705 | +8.8% | 10,136 | 8,640 | +17.3% |
| Career | 152,866 | 144,645 | +5.7% | 34,932 | 30,369 | +15.0% |
| Asia Pacific | 496,354 | 476,103 | +4.3% | 10,511 | 11,704 | -10.2% |
| Others | 74,602 | 52,611 | +41.8% | -983 | -3,156 | – |
| Adjusted | -43,966 | -41,447 | – | -11,555 | -6,883 | – |
Capital Efficiency and Financial Position
ROIC was 18.2% and ROE was 20.9%, both new record highs and both above the Mid-term Management Plan 2026 targets of 15% or higher for ROIC and 20% or higher for ROE. Total assets stood at 620,535 million yen as of March 31, 2026, up 80,789 million yen from a year earlier, with goodwill rising from 70,065 million yen to 94,019 million yen; the company notes that asset and liability items such as trade receivables, trade payables and goodwill increased as a result of the Gojob acquisition. Total equity attributable to owners of parent was 219,499 million yen. Cash flows from operating activities were 77,440 million yen (68,854 million yen in FY2024) and free cash flow was 43,124 million yen (39,089 million yen in FY2024), leaving cash and cash equivalents of 85,018 million yen at the end of the period.
FY2026 Forecast
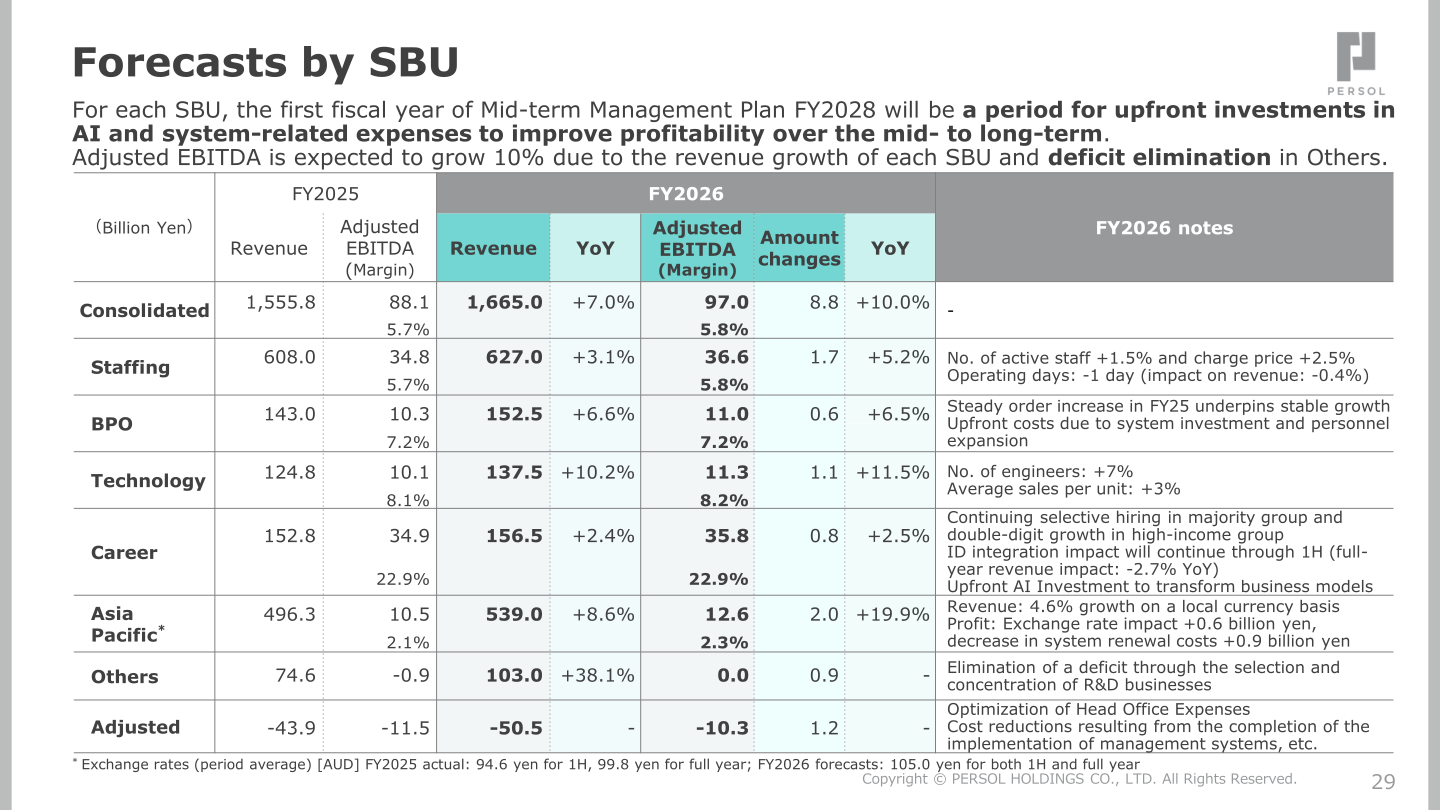
For FY2026 the company is aiming for 10% growth in adjusted EBITDA, supported by stable business growth at each SBU. Revenue is forecast at 1,665.0 billion yen (+7.0%) with adjusted EBITDA of 97.0 billion yen (+10.0%) and operating profit of 71.0 billion yen (+6.7%). The profit plan is more heavily weighted toward the second half than in previous years, with adjusted EBITDA guided to +6.4% in 1H and +13.6% in 2H. By SBU, Technology is expected to grow revenue 10.2% and Asia Pacific 8.6%, while the Others deficit in adjusted EBITDA is expected to be eliminated. The company states that the first fiscal year of Mid-term Management Plan FY2028 will be a period for upfront investments in AI and system-related expenses to improve profitability over the mid- to long-term.
| Item (Billion yen) | FY2026 Full-year Forecast | FY2025 Full year (Actual) | YoY |
|---|---|---|---|
| Revenue | 1,665.0 | 1,555.8 | +7.0% |
| Operating profit | 71.0 | 66.5 | +6.7% |
| OP margin | 4.3% | 4.3% | -0.0pt |
| Adjusted EBITDA | 97.0 | 88.1 | +10.0% |
| Adjusted EBITDA margin | 5.8% | 5.7% | +0.2pt |
| Profit | 44.5 | 42.6 | +4.2% |
| Adjusted profit | 51.5 | 48.3 | +6.6% |
| EPS (Yen) | 19.60 | 19.42 | +0.9% |
| Adjusted EPS (Yen) | 22.68 | 21.71 | +4.5% |
Shareholder Returns
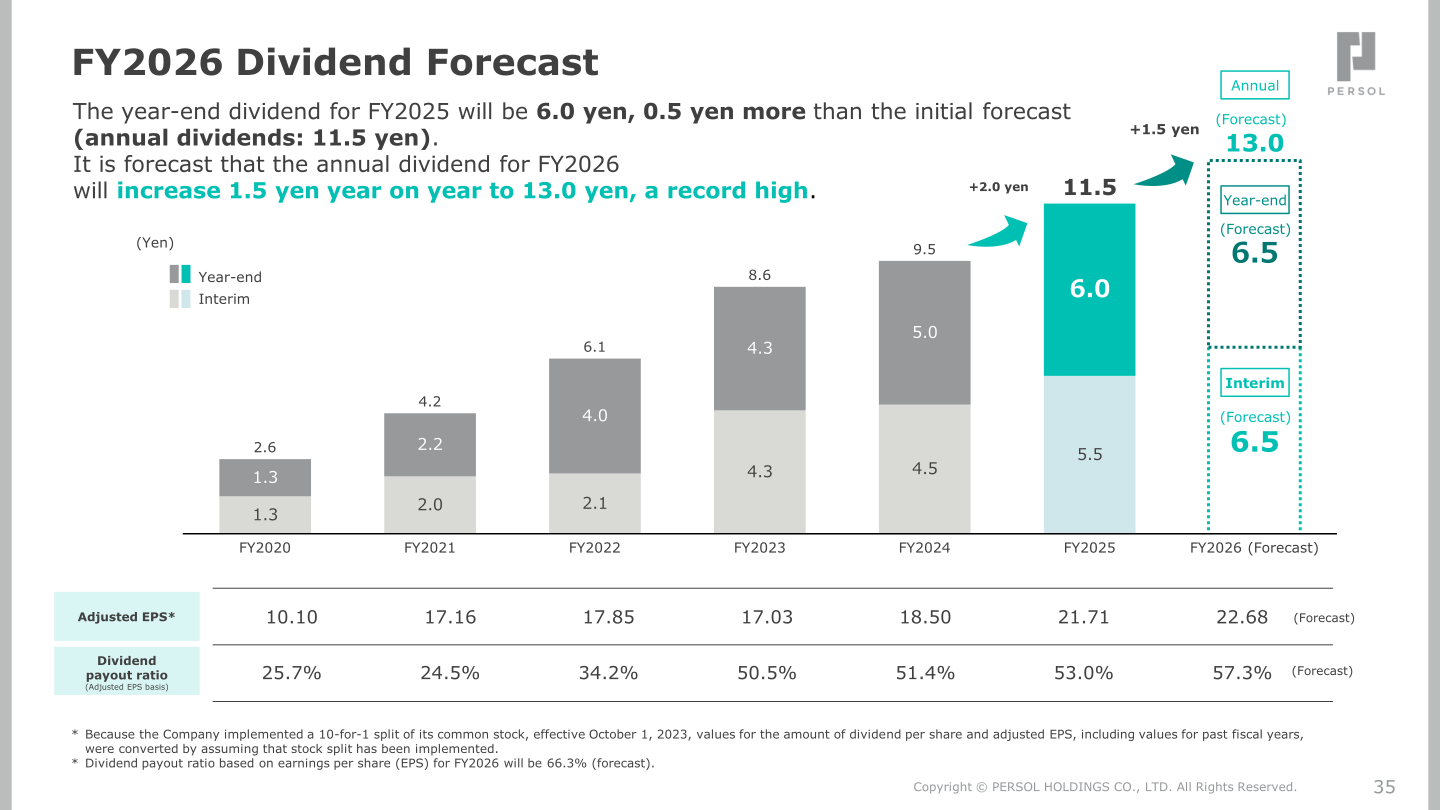
The year-end dividend for FY2025 will be 6.0 yen, 0.5 yen more than the initial forecast, bringing the annual dividend to 11.5 yen. For FY2026 the company forecasts an annual dividend of 13.0 yen — an interim dividend of 6.5 yen and a year-end dividend of 6.5 yen — an increase of 1.5 yen year on year and a record high. The dividend payout ratio on an adjusted EPS basis is 53.0% for FY2025 and a forecast 57.3% for FY2026; the payout ratio based on EPS for FY2026 will be 66.3% (forecast). Under the Mid-term Management Plan 2026, adjusted EBITDA is a key performance indicator, more emphasis is placed on shareholder return, and the payout ratio will be approx. 50% of adjusted EPS.
| Item (Yen) | FY2024 | FY2025 | FY2026 (Forecast) |
|---|---|---|---|
| Interim dividend | 4.5 | 5.5 | 6.5 |
| Year-end dividend | 5.0 | 6.0 | 6.5 |
| Annual dividend | 9.5 | 11.5 | 13.0 |
| Adjusted EPS | 18.50 | 21.71 | 22.68 |
| Dividend payout ratio (Adjusted EPS basis) | 51.4% | 53.0% | 57.3% |
Medium-Term Plan and Topics
The new Mid-term Management Plan FY2028 targets a 10% CAGR for adjusted EBITDA, with a 10% growth rate planned for the first year, FY2026. To improve profitability over the medium to long term, the company is reinforcing investments in AI and systems, making FY2026 a year of upfront investment. Among group topics, PERSOL was newly selected in the Digital Transformation Stock Selection (DX Stock) 2026 program for the first time, in recognition of the formulation and external announcement of its AI Basic Policy and the acquisition of Gojob in France, which operates an AI-driven temporary staffing platform. The company also announced IR Day 2026, to be held online for institutional investors and analysts on Monday, July 6, 2026 from 10:00 a.m. to 12:00 p.m. (JST) on the theme of Mid-term Management Plan FY2028: SBU Strategy.
This article is an analysis based on publicly available information and is not a recommendation to buy or sell any specific securities. Investment decisions are your own responsibility.
![[Obayashi] Investors’ Guide 2026 — The Complete 24-Article Breakdown](https://japan-equity.com/wp-content/uploads/2026/07/hub_cover-1024x1024.png)
![[Obayashi] IR & SR Policy — Feeding Dialogue Back into Management](https://japan-equity.com/wp-content/uploads/2026/07/p32_sq-1024x1024.jpg)
![[Obayashi] Real Estate Development — 18.7% Margin, ¥287.7bn Unrealized Gains](https://japan-equity.com/wp-content/uploads/2026/07/p20_sq-1024x1024.jpg)
![[Obayashi] Domestic Civil Engineering — Resilience Spending Supports 9.6% Margin](https://japan-equity.com/wp-content/uploads/2026/07/p11_sq-1024x1024.jpg)
![[Obayashi] Share Price & External Ratings — vs TOPIX, ESG Index Inclusion](https://japan-equity.com/wp-content/uploads/2026/07/p40_sq-1024x1024.jpg)
![[Construction] ¥75.5tn Investment, Shrinking Workforce — Big-5 Market Share](https://japan-equity.com/wp-content/uploads/2026/07/p12_sq-1024x1024.jpg)



![[Obayashi] Capital Policy & Shareholder Returns — ROE 10%+, DOE ~5%, ¥100bn Buyback](https://japan-equity.com/wp-content/uploads/2026/07/p27_sq-1024x1024.jpg)
![[Obayashi] Reducing Cross-Shareholdings — ¥285.2bn Sold in Five Years](https://japan-equity.com/wp-content/uploads/2026/07/p29_sq-1024x1024.jpg)
![[Obayashi] ¥750bn Investment Plan — ¥300bn to Development, ¥190bn to Tech/DX](https://japan-equity.com/wp-content/uploads/2026/07/p30_sq-1024x1024.jpg)
![[Obayashi] MTP2022 KPIs — Operating Profit ~2x Target, ROE 14.4%](https://japan-equity.com/wp-content/uploads/2026/07/p25_sq-1024x1024.jpg)
![[Obayashi] Cash Allocation — ¥420bn Investment CF Over Five Years](https://japan-equity.com/wp-content/uploads/2026/07/p26_sq-1024x1024.jpg)
![[Obayashi] Green Energy — 44 Plants, 344MW, and the Green Hydrogen Challenge](https://japan-equity.com/wp-content/uploads/2026/07/p21_sq-1024x1024.jpg)
![[Obayashi] Tackling the Labor Shortage — Robotics Construction®](https://japan-equity.com/wp-content/uploads/2026/07/p14_sq-1024x1024.jpg)
