
This article is based on publicly available IR materials and is not a recommendation to buy or sell any specific securities.
Note: UT Group labels this fiscal year “FY3/2026” (the fiscal year ended March 31, 2026); this site classifies the most recently completed fiscal year as FY2025, and the labels used in the text, tables and segment data below follow the company’s materials.
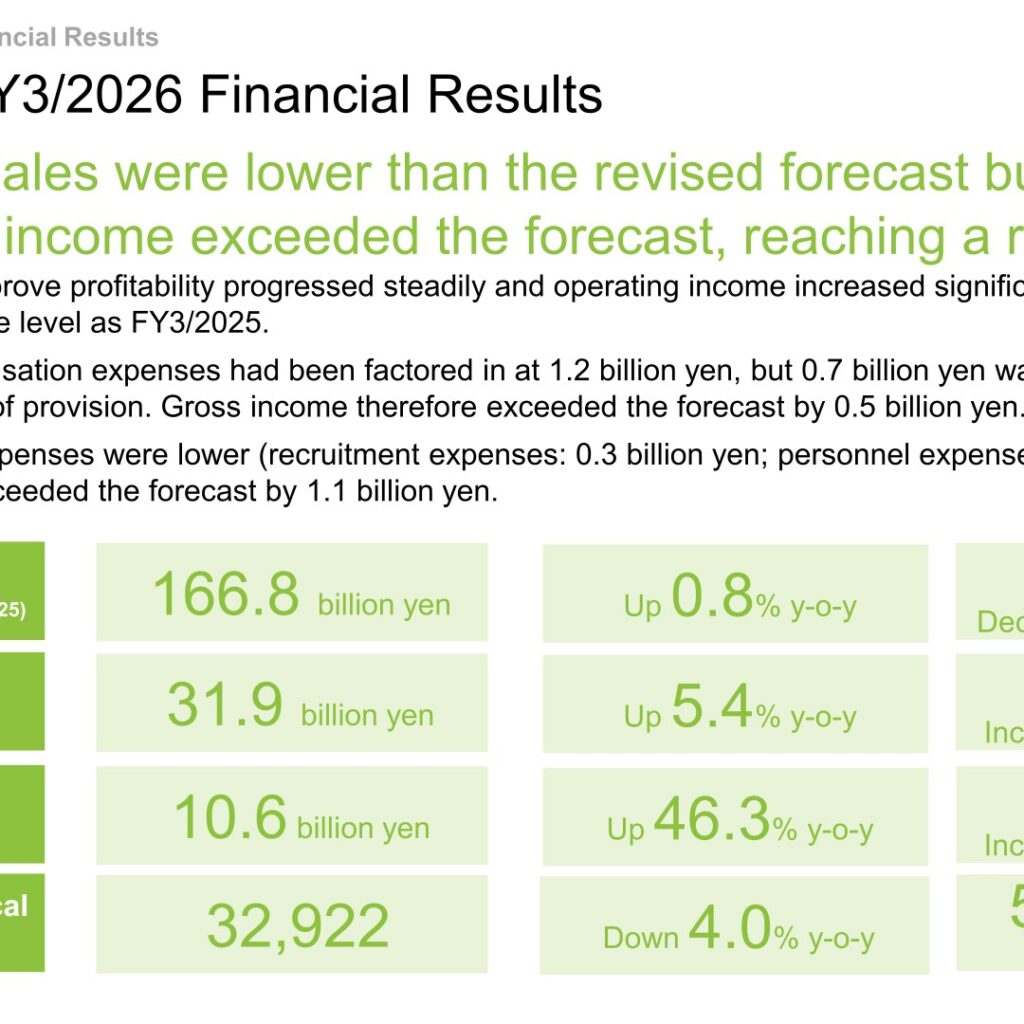
UT Group Co., Ltd. announced its results for the fiscal year ended March 31, 2026 on May 14, 2026. Excluding the business sold in FY3/2025, net sales were 166.8 billion yen (up 0.8% y-o-y), gross income was 31.9 billion yen (up 5.4% y-o-y) and operating income was 10.6 billion yen (up 46.3% y-o-y). The number of technical employees was 32,922, down 4.0% y-o-y. Sales came in below the revised forecast, but operating income exceeded the forecast and reached a record high.
Consolidated Results (Full-Year Actual)
The company presents its income statement on three bases: FY3/2025 consolidated, FY3/2025 excluding special factors (the Vietnam Business and extraordinary gains), and FY3/2026 consolidated. Against FY3/2025 consolidated, net sales fell 14.3% because of the business sales, while operating income rose 31.5% and ordinary income rose 31.0%. Against FY3/2025 excluding special factors, net sales rose 0.7%, operating income rose 47.2% and net income attributable to UT Group rose 61.4%.
| Item (Oku yen) | FY3/2025 Consolidated | FY3/2025 Excl. special factors | FY3/2026 Consolidated | Change vs FY3/2025 consolidated | Change vs FY3/2025 excl. special factors |
|---|---|---|---|---|---|
| Net sales | 1,947 | 1,656 | 1,668 | △278 (△14.3%) | 12 (0.7%) |
| Gross income | 319 | 303 | 319 | 0 (0.1%) | 16 (5.3%) |
| SG&A expenses | 238 | 231 | 213 | △24 (△10.5%) | △18 (△7.8%) |
| Operating income | 80 | 72 | 106 | 25 (31.5%) | 34 (47.2%) |
| Ordinary income | 82 | 74 | 108 | 25 (31.0%) | 34 (45.9%) |
| Net income attributable to UT Group | 89 | 44 | 71 | △18 (△20.6%) | 27 (61.4%) |
| EPS (yen) | 15.02 | 7.50 | 12.37 | △2.65 | △4.87 |
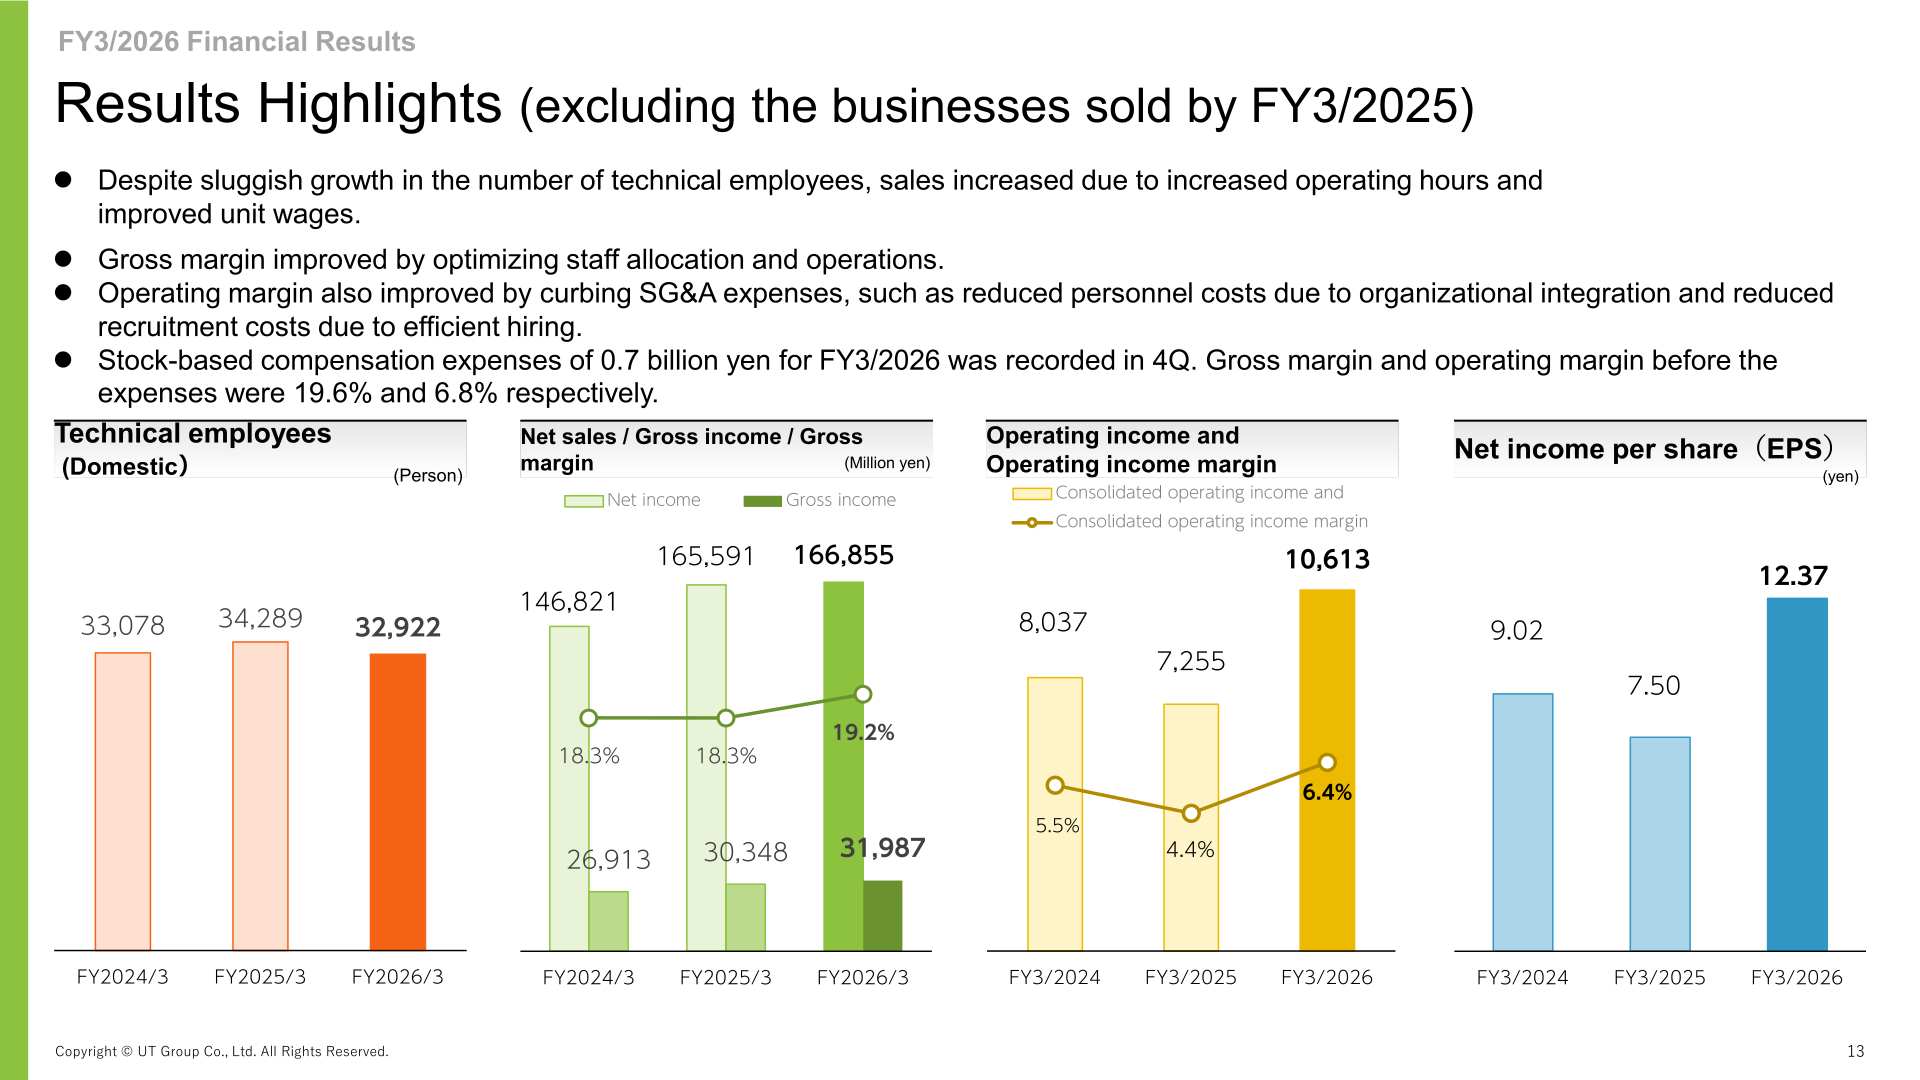
| No. of technical employees (Domestic) | 34,289 | 34,289 | 32,922 | △1,367 (△4.0%) | △1,367 (△4.0%) |
Gross margin was 19.2% and operating margin was 6.4% in FY3/2026. Stock-based compensation expenses of 0.7 billion yen for FY3/2026 were recorded in the fourth quarter; before those expenses, gross margin and operating margin were 19.6% and 6.8% respectively. The company had factored in 1.2 billion yen of stock-based compensation expenses, but recorded 0.7 billion yen after a careful examination of the provision, so gross income exceeded the forecast by 0.5 billion yen. SG&A expenses were also lower (recruitment expenses 0.3 billion yen; personnel expenses 0.3 billion yen), and operating income exceeded the forecast by 1.1 billion yen, while sales fell 1.2 billion yen short of the forecast. Of the year-on-year decrease of 2.49 billion yen in SG&A expenses, personnel expenses decreased by 1.29 billion yen, recruitment expenses by 0.62 billion yen, and amortization of goodwill, depreciation and other SG&A expenses by 0.57 billion yen.
Segment Results
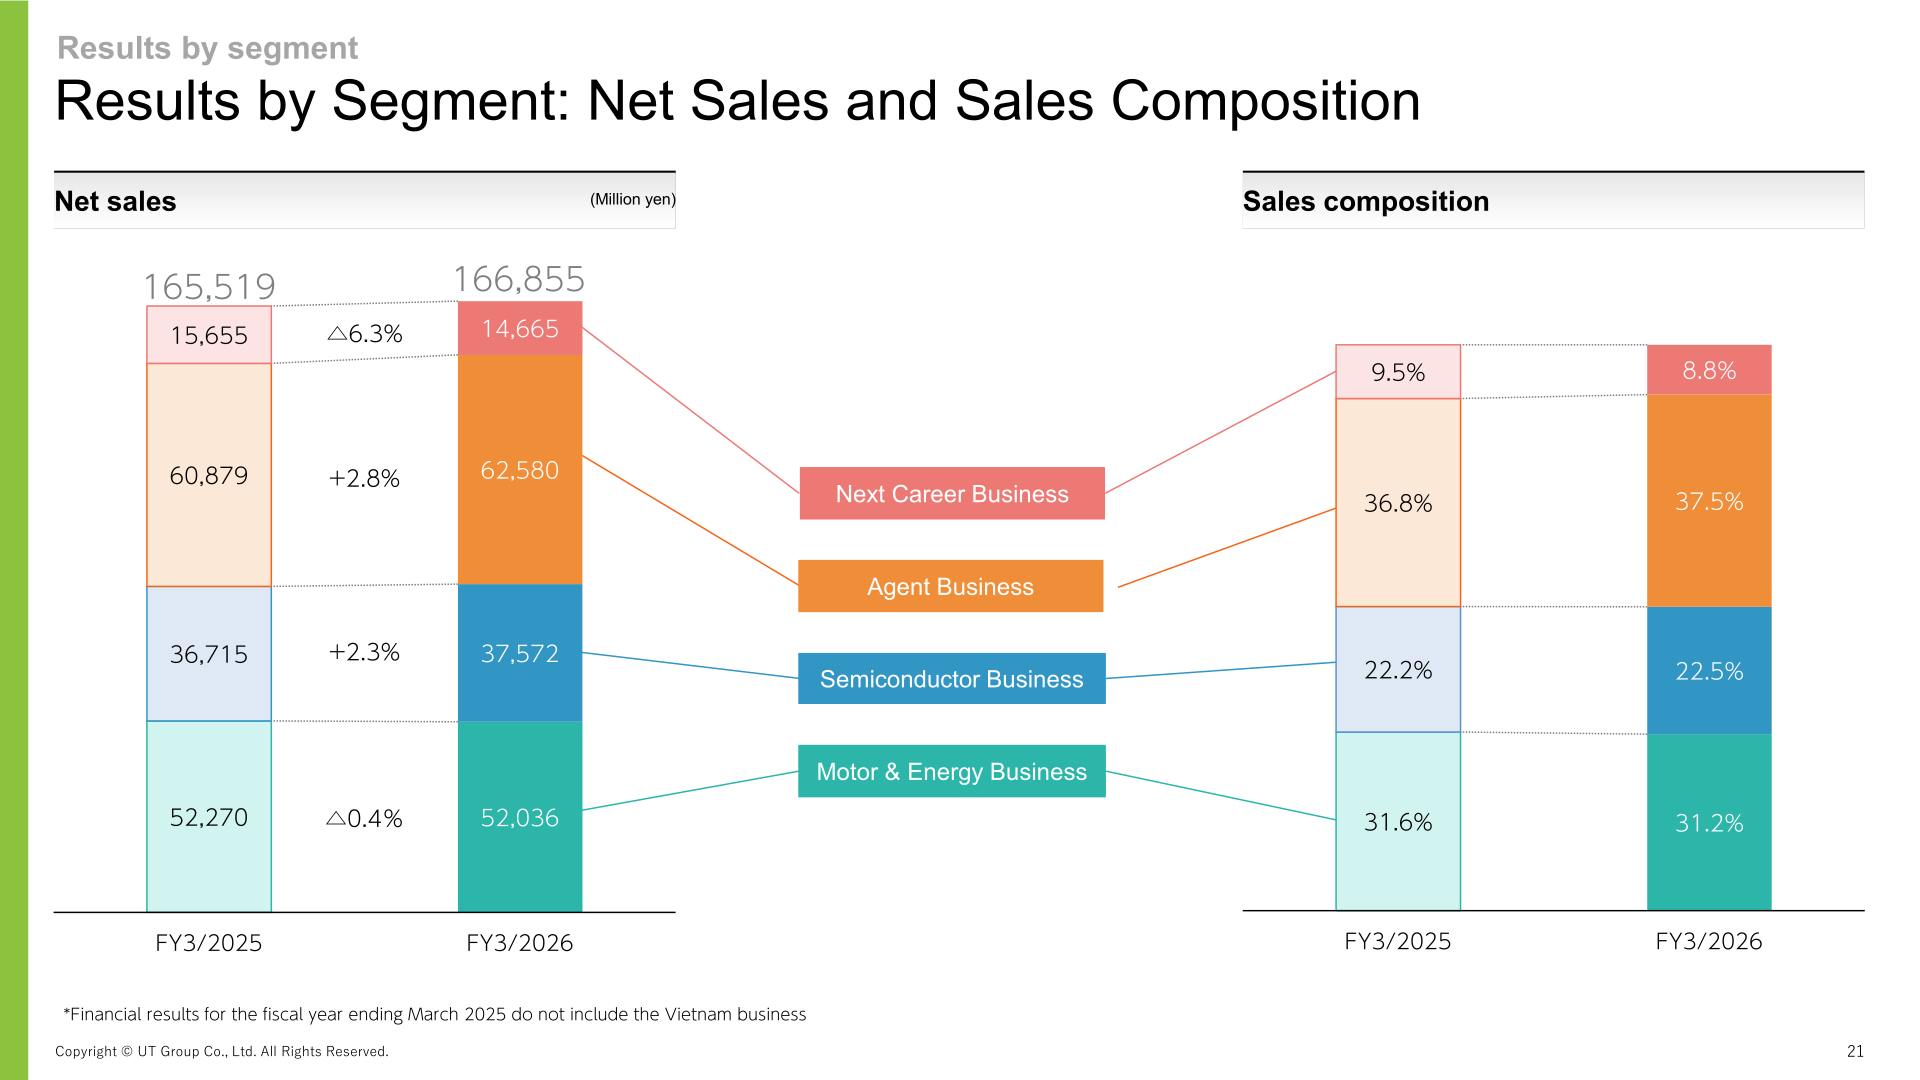
Net sales rose year on year in the Semiconductor Business and the Agent Business, were broadly flat in the Motor & Energy Business, and declined in the Next Career Business. Sales composition in FY3/2026 was 37.5% for the Agent Business, 31.2% for the Motor & Energy Business, 22.5% for the Semiconductor Business and 8.8% for the Next Career Business, against 36.8%, 31.6%, 22.2% and 9.5% respectively in FY3/2025. Operating income increased in the Motor & Energy, Semiconductor and Agent businesses. FY3/2025 segment figures exclude the Vietnam Business, and segment figures have been retrospectively restated.
| Segment | Net sales FY3/2025 (million yen) | Net sales FY3/2026 (million yen) | Change | Operating income FY3/2025 (million yen) | Operating income FY3/2026 (million yen) |
|---|---|---|---|---|---|
| Motor & Energy Business | 52,270 | 52,036 | △0.4% | 4,050 | 4,691 |
| Semiconductor Business | 36,715 | 37,572 | +2.3% | 2,482 | 3,422 |
| Agent Business | 60,879 | 62,580 | +2.8% | 239 | 1,989 |
| Next Career Business | 15,655 | 14,665 | △6.3% | 558 | 554 |
In the Motor & Energy Business, demand was stagnant throughout the year and reduced hiring led to a decrease in the number of technical employees, leaving sales flat year on year; operating income rose significantly on curbed recruitment expenses in the fourth quarter. In the Semiconductor Business, fourth-quarter sales increased on rising unit wages despite a year-on-year decrease in technical employees. In the Agent Business, sales increased in all quarters on continued unit wage negotiations and more operating hours, and an optimized operating workforce drove a significant improvement in gross income and operating income in all quarters. In the Next Career Business, the number of technical employees increased on an expanded older workforce while sales continued to decrease. In April 2026 UT Group reorganized from an industry-based to a function-based structure, and reportable segmentation will change to a single segment from FY3/2027, although the company plans to continue disclosing sales trends by field as subsegments.
FY3/2027 Forecast
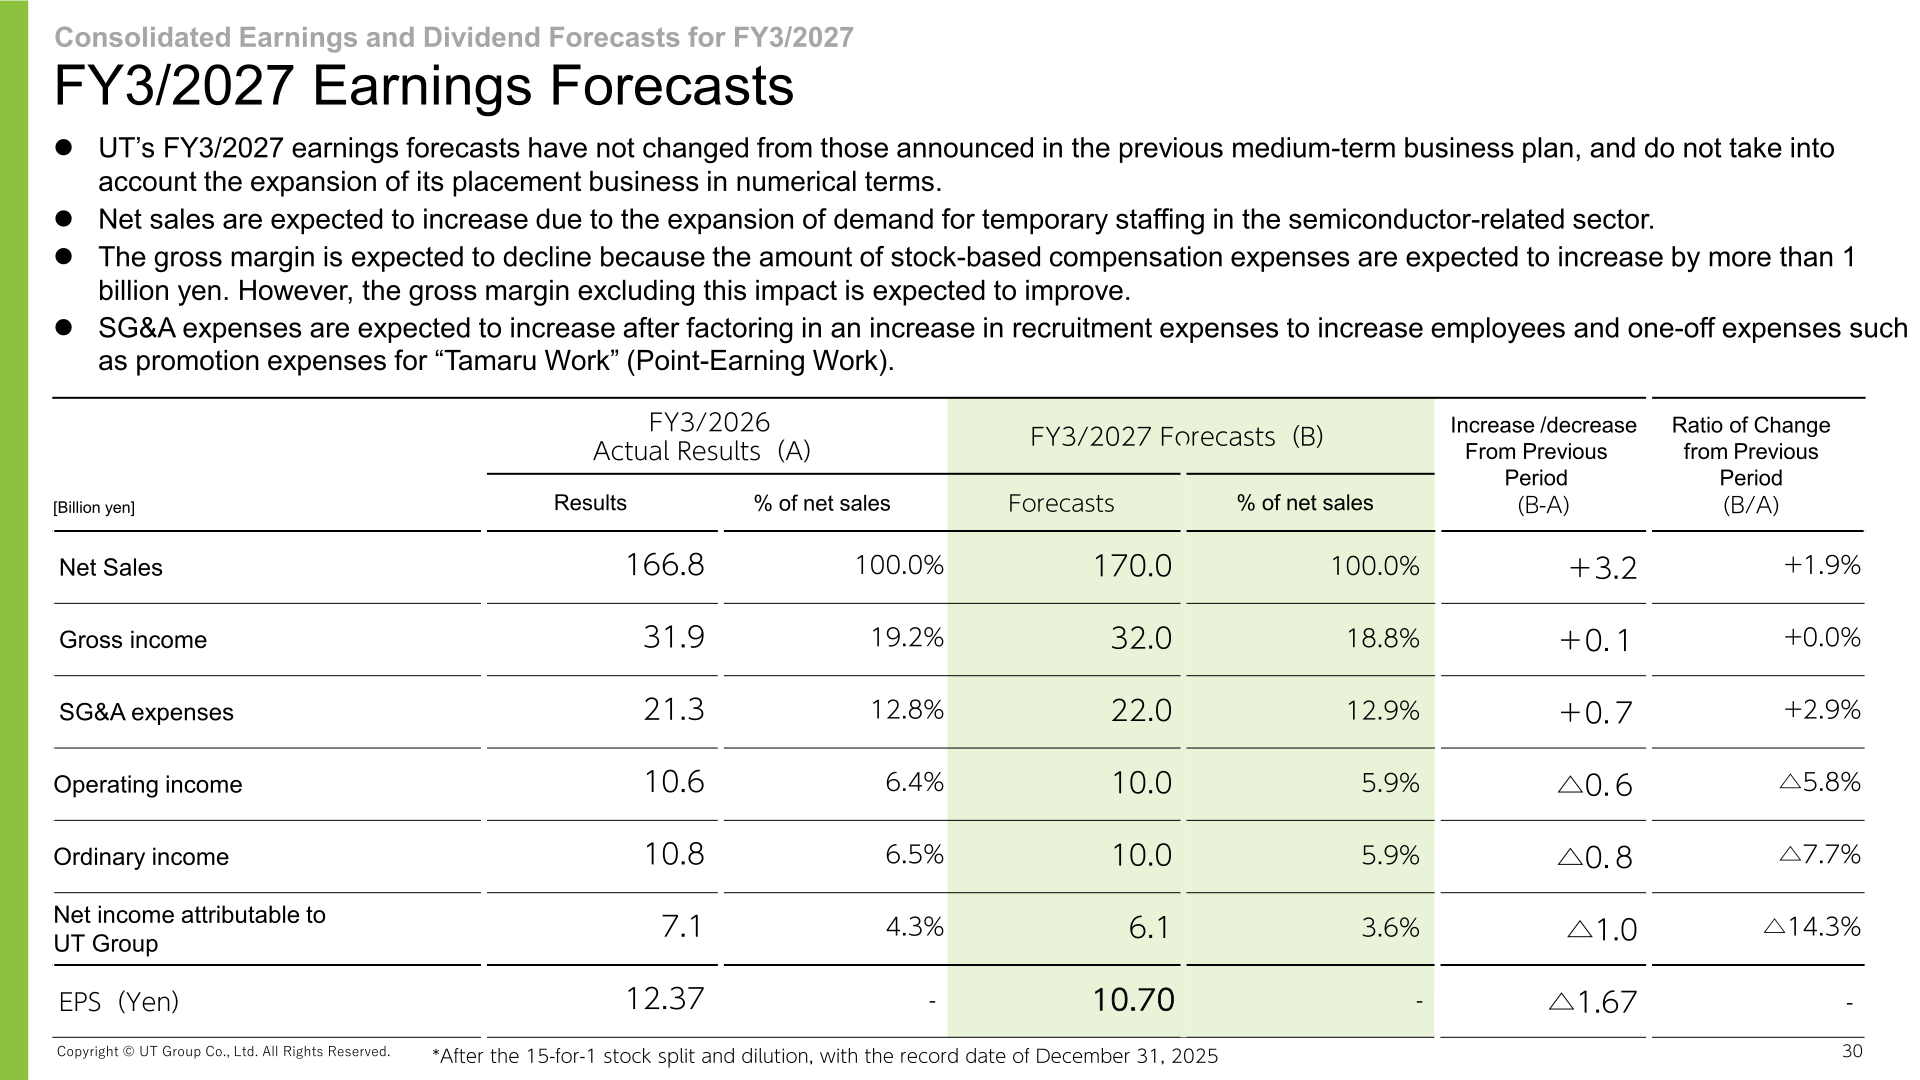
The FY3/2027 earnings forecasts are unchanged from those announced in the previous medium-term business plan and do not take into account the expansion of the placement business in numerical terms. Net sales are expected to increase on expanding demand for temporary staffing in the semiconductor-related sector. The gross margin is expected to decline because stock-based compensation expenses are expected to increase by more than 1 billion yen, although the gross margin excluding this impact is expected to improve. SG&A expenses are expected to increase after factoring in higher recruitment expenses to increase employees and one-off expenses such as promotion expenses for “Tamaru Work” (Point-Earning Work).
| Item (Billion yen) | FY3/2026 Actual Results (A) | FY3/2027 Forecasts (B) | Increase/decrease (B-A) | Ratio of change (B/A) |
|---|---|---|---|---|
| Net Sales | 166.8 | 170.0 | +3.2 | +1.9% |
| Gross income | 31.9 | 32.0 | +0.1 | +0.0% |
| SG&A expenses | 21.3 | 22.0 | +0.7 | +2.9% |
| Operating income | 10.6 | 10.0 | △0.6 | △5.8% |
| Ordinary income | 10.8 | 10.0 | △0.8 | △7.7% |
| Net income attributable to UT Group | 7.1 | 6.1 | △1.0 | △14.3% |
| EPS (Yen) | 12.37 | 10.70 | △1.67 | – |
As a percentage of net sales, gross income is forecast at 18.8% (19.2% in FY3/2026), SG&A expenses at 12.9% (12.8%), operating income at 5.9% (6.4%), ordinary income at 5.9% (6.5%) and net income attributable to UT Group at 3.6% (4.3%). EPS figures are after the 15-for-1 stock split and dilution, with the record date of December 31, 2025.
Shareholder Returns
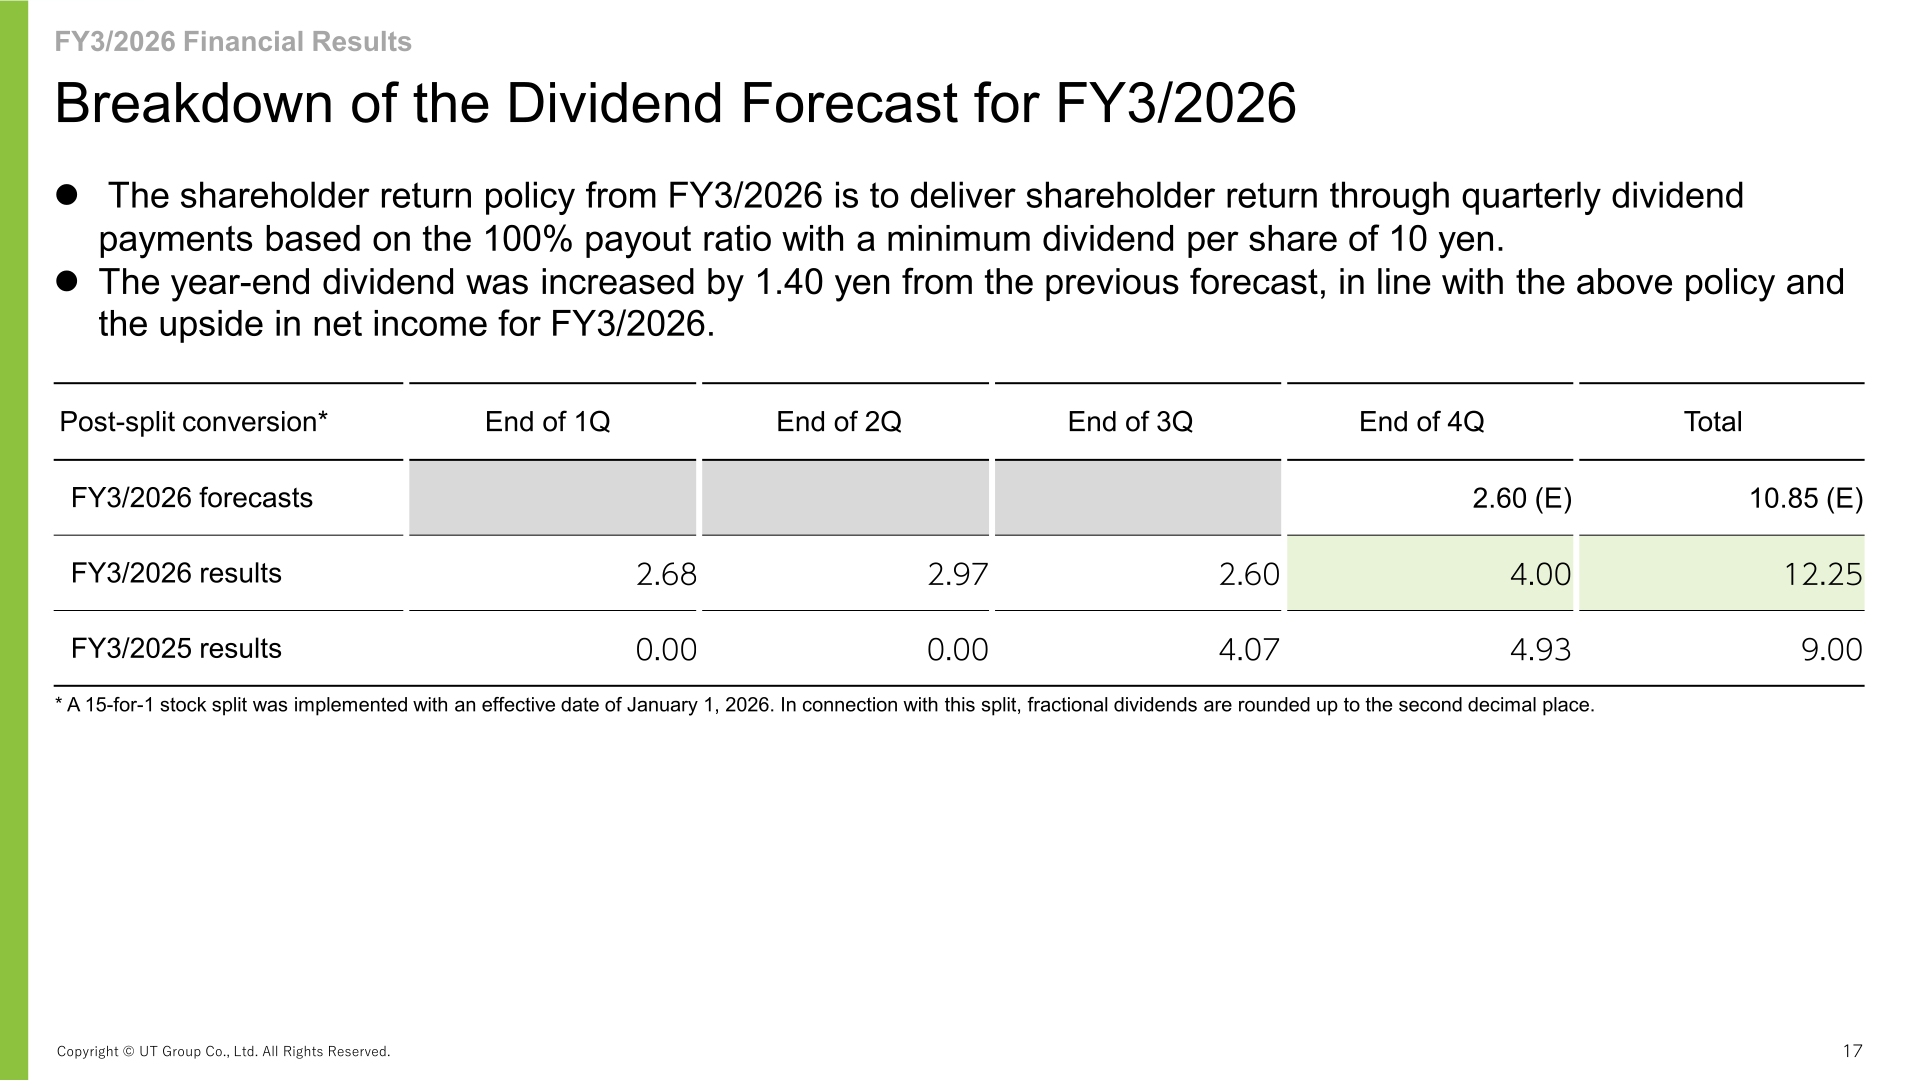
From FY3/2026, UT Group’s shareholder return policy is to deliver returns through quarterly dividend payments based on a 100% payout ratio with a minimum annual dividend per share of 10 yen. The year-end dividend for FY3/2026 was increased by 1.40 yen from the previous forecast in line with that policy and the upside in net income, taking the annual dividend to 12.25 yen, which was 3.25 yen higher than FY3/2025 and 1.40 yen above the forecast. The expected dividend amount for 2026 is 12.25 yen per share, or 7.1 billion yen in total. For FY3/2027 the annual dividend is expected to be 10.23 yen based on a 100% payout ratio, with the quarterly breakdown to be determined in consideration of quarterly results and other factors.
| Dividend per share (yen, post-split conversion) | End of 1Q | End of 2Q | End of 3Q | End of 4Q | Total |
|---|---|---|---|---|---|
| FY3/2025 results | 0.00 | 0.00 | 4.07 | 4.93 | 9.00 |
| FY3/2026 forecasts | – | – | – | 2.60 (E) | 10.85 (E) |
| FY3/2026 results | 2.68 | 2.97 | 2.60 | 4.00 | 12.25 |
| FY3/2027 initial forecasts | TBD | TBD | TBD | TBD | 10.23 (E) |
A 15-for-1 stock split was implemented with an effective date of January 1, 2026 and a record date of December 31, 2025; in connection with this split, fractional dividends are rounded up to the second decimal place, and dividend amounts for periods prior to the split have been adjusted to reflect it. The total number of issued shares was 39,902,683 before the split, with 558,637,562 shares added by the split for a post-split total of 598,540,245 shares, and the total number of shares authorized to be issued after the split is 2,300,000,000. Shares outstanding at the end of the fourth quarter were 601,193,745, an increase of 3,288,000 shares from the end of FY3/2025.
Medium-Term Plan and Topics
FY3/2026 was the first year of the Fifth Medium-Term Business Plan, whose targets for the final year (FY3/2029) are net sales of 185.0 billion yen, gross income of 35.0 billion yen, operating income of 15.0 billion yen, net income of 9.1 billion yen, a dividend per share of 15.20 yen and 38,000 employees. The plan aims to return the operating margin to 8%, the record high level achieved in 2023, by 2029, and sets an internal target for the placement business of 3 to 6 billion yen in gross income in 2029, which is not included in the medium-term plan. The dividend payout ratio will be 100% until FY3/2029, with a committed minimum dividend of 10 yen per share after the 15-for-1 stock split. Financial strategy targets include maintaining and improving an ROE of 20% and a net D/E ratio of less than 0.5 times, with the total amount of shares granted during the plan period at approximately 10 billion yen at maximum.
In the first year of the plan, job openings at UT Group’s clients rose by 227 year on year to 4,798 and job openings at UT alliances’ clients reached 12,877, an increase of 12,877 year on year. Successful placements to workplaces of client companies were 934 (up 82 year on year) and successful placements to workplaces of alliance partners were 296 (up 296 year on year). The number of closed placement cases, covering full-time, permanent, Next UT and alliance cases, rose 44% from 852 in FY3/2025 to 1,230 in FY3/2026. Approximately 3.3 million shares are expected to be granted in June 2026, with the number of employee shareholders expected to increase by 8,867. Key measures for FY3/2027 include promoting the transfer of employees to higher-salary workplaces, expanding job opportunities in the placement business, the first share grant in June 2026, the launch of an external recruitment app in July 2026 and its integration with in-house apps in January 2027.
This article is an analysis based on publicly available information and is not a recommendation to buy or sell any specific securities. Investment decisions are your own responsibility.
















