
This article is based on publicly available IR materials and is not a recommendation to buy or sell any specific securities.
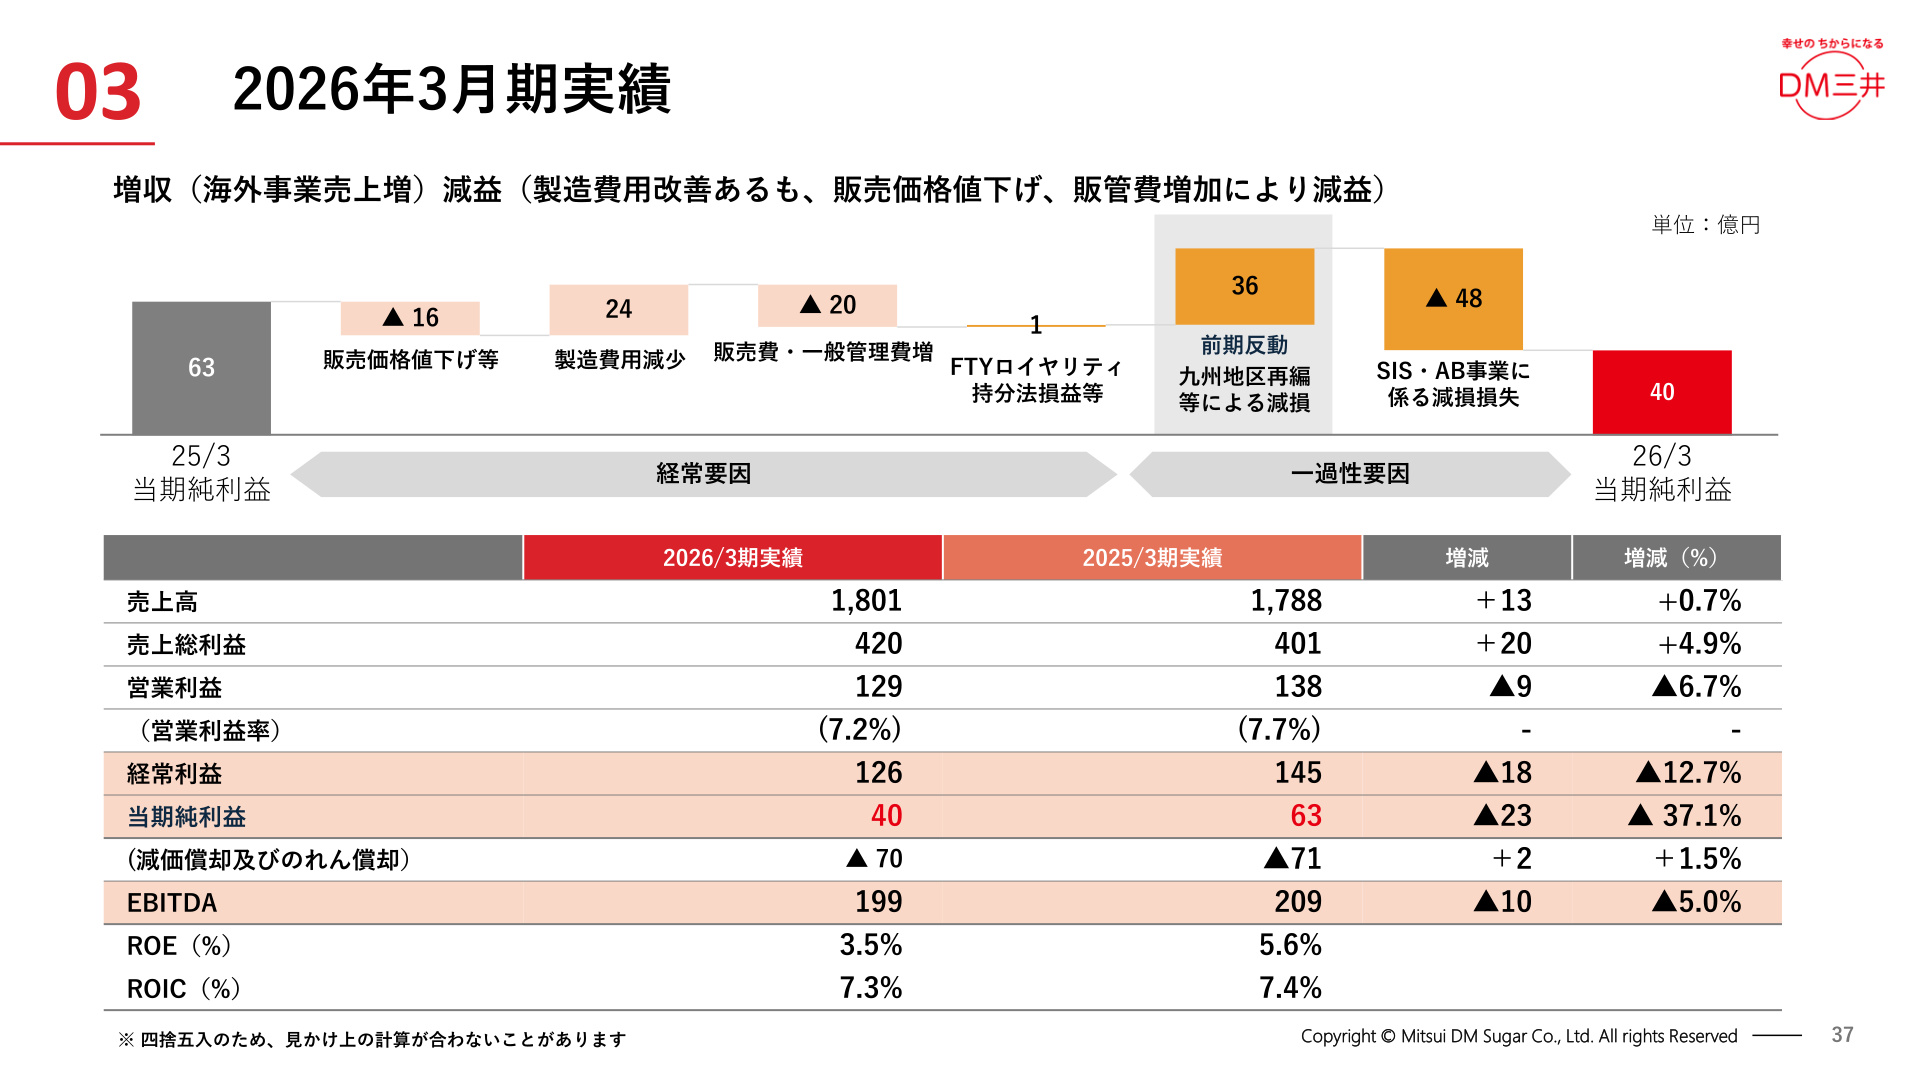
Note: the company labels this period the fiscal year ended March 2026 (FY3/26); it is classified as FY2025 on this site, while the labels in the text and tables below follow the source materials. Note: Mitsui DM Sugar does not publish an English results presentation; this article is an English translation of the Japanese-language article on our sister site Investalk, which is based on the company’s Japanese-language IR materials, with figures transcribed as reported. In its consolidated results for the fiscal year ended March 2026, Mitsui DM Sugar secured higher sales, with net sales of 180.1 billion yen (+0.7% year on year), while profits declined: operating profit was 12.9 billion yen (▲6.7%), ordinary profit was 12.6 billion yen (▲12.7%) and net income was 4.0 billion yen (▲37.1%). Sales increased on higher sales in the overseas business, but although manufacturing costs improved, reductions in selling prices and an increase in selling, general and administrative expenses weighed on profits. EBITDA was 19.9 billion yen (▲5.0%), ROE was 3.5% and ROIC was 7.3%. At the same time, the company formulated a new medium-term management plan, “Medium-Term Management Plan 2030: Mitsui DM Group 2.0,” covering the fiscal years ending March 2027 through March 2030.
Consolidated Results (FY March 2026 Actual)
Net sales were 180.1 billion yen (up 1.3 billion yen year on year, +0.7%) and gross profit was 42.0 billion yen (up 2.0 billion yen, +4.9%), for higher sales and higher gross profit, but operating profit was 12.9 billion yen (▲0.9 billion yen, ▲6.7%) and the operating margin fell to 7.2% (from 7.7% in the previous year). Ordinary profit was 12.6 billion yen (▲1.8 billion yen, ▲12.7%) and net income was 4.0 billion yen (▲2.3 billion yen, ▲37.1%). Depreciation and goodwill amortization was ▲7.0 billion yen (previous year ▲7.1 billion yen), and EBITDA was 19.9 billion yen (▲1.0 billion yen, ▲5.0%). ROE was 3.5% (previous year 5.6%) and ROIC was 7.3% (previous year 7.4%).
| Item | FY March 2026 Actual | FY March 2025 Actual | Change | Change (%) |
|---|---|---|---|---|
| Net sales | 180.1 billion yen | 178.8 billion yen | +1.3 billion yen | +0.7% |
| Gross profit | 42.0 billion yen | 40.1 billion yen | +2.0 billion yen | +4.9% |
| Operating profit | 12.9 billion yen | 13.8 billion yen | ▲0.9 billion yen | ▲6.7% |
| (Operating margin) | 7.2% | 7.7% | – | – |
| Ordinary profit | 12.6 billion yen | 14.5 billion yen | ▲1.8 billion yen | ▲12.7% |
| Net income | 4.0 billion yen | 6.3 billion yen | ▲2.3 billion yen | ▲37.1% |
| EBITDA | 19.9 billion yen | 20.9 billion yen | ▲1.0 billion yen | ▲5.0% |
| ROE | 3.5% | 5.6% | – | – |
| ROIC | 7.3% | 7.4% | – | – |
Segment Results
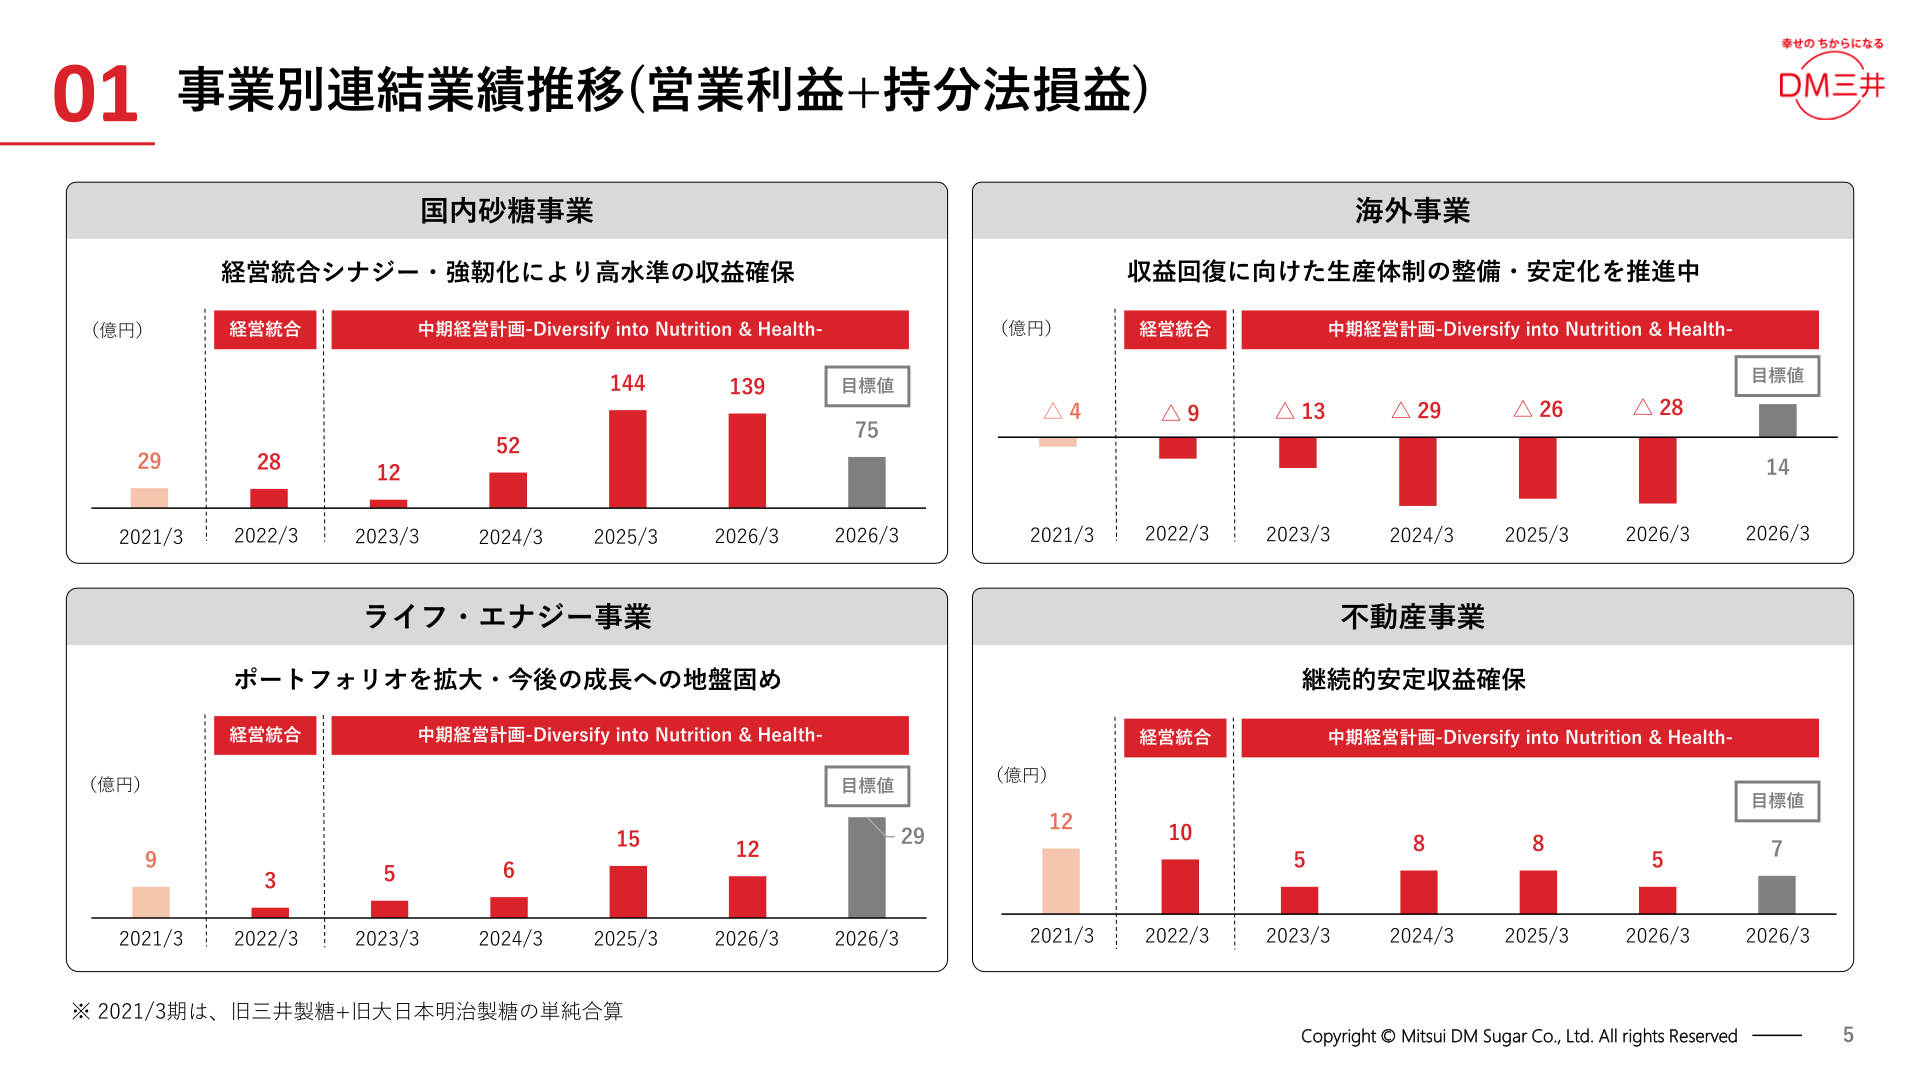
In the fiscal year ended March 2026, operating profit declined in every segment. The Sugar segment posted net sales of 152.2 billion yen (up 0.9 billion yen year on year) and operating profit of 11.4 billion yen (▲0.3 billion yen), reflecting the impact of reductions in selling prices. The Life & Energy segment posted net sales of 25.3 billion yen (up 0.3 billion yen) and operating profit of 1.0 billion yen (▲0.3 billion yen), due to an increase in selling, general and administrative expenses at a subsidiary. The Real Estate segment posted net sales of 2.6 billion yen (up 0.1 billion yen) and operating profit of 0.5 billion yen (▲0.3 billion yen), affected by an increase in the allowance for doubtful accounts on lease receivables. In total, net sales were 180.1 billion yen (up 1.3 billion yen) and operating profit was 12.9 billion yen (▲0.9 billion yen).
| Segment | Net sales (actual) | Net sales (YoY) | Operating profit (actual) | Operating profit (YoY) | Reason for the difference |
|---|---|---|---|---|---|
| Sugar | 152.2 billion yen | +0.9 billion yen | 11.4 billion yen | ▲0.3 billion yen | Impact of reductions in selling prices |
| Life & Energy | 25.3 billion yen | +0.3 billion yen | 1.0 billion yen | ▲0.3 billion yen | Increase in selling, general and administrative expenses at a subsidiary |
| Real Estate | 2.6 billion yen | +0.1 billion yen | 0.5 billion yen | ▲0.3 billion yen | Increase in the allowance for doubtful accounts on lease receivables |
| Total | 180.1 billion yen | +1.3 billion yen | 12.9 billion yen | ▲0.9 billion yen | – |
Full-Year Forecast
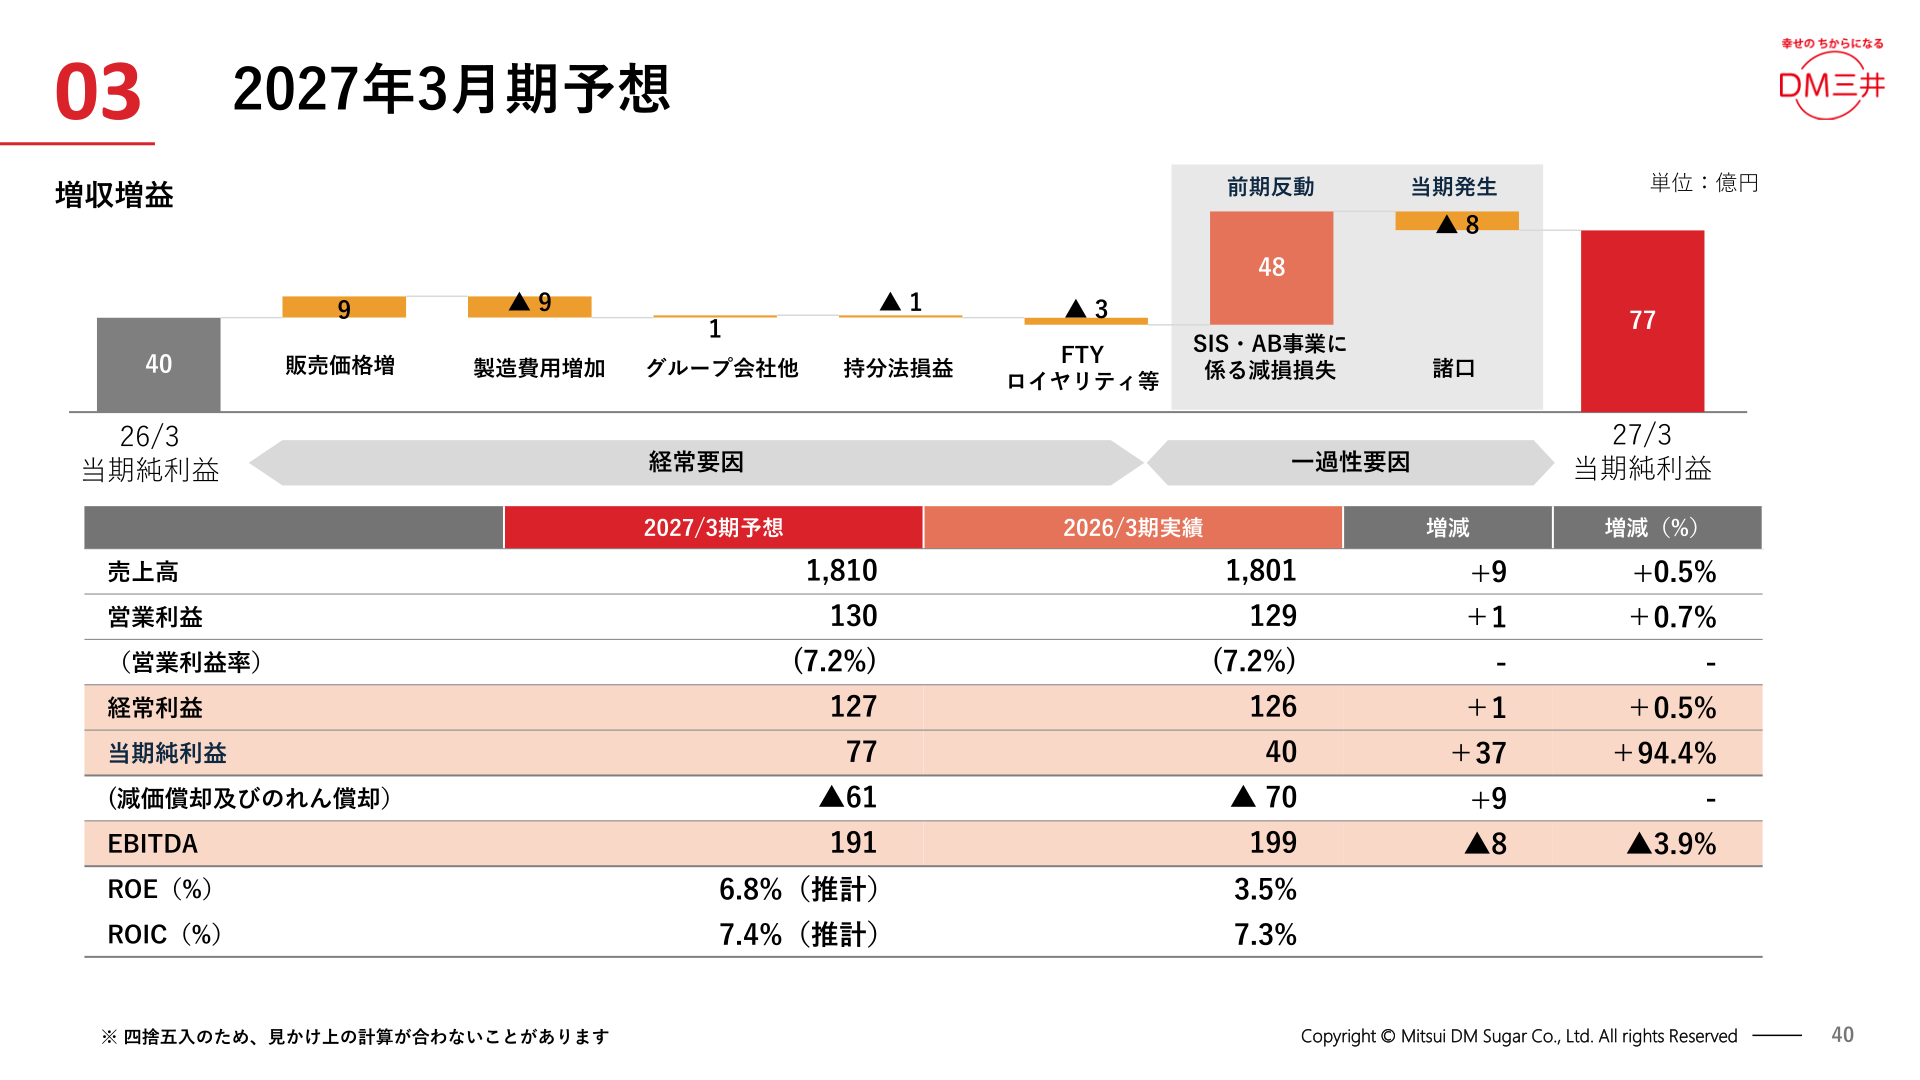
For the fiscal year ending March 2027, the company forecasts higher sales and higher profits, with net sales of 181.0 billion yen (up 0.9 billion yen year on year, +0.5%), operating profit of 13.0 billion yen (up 0.1 billion yen, +0.7%, operating margin 7.2%), ordinary profit of 12.7 billion yen (up 0.1 billion yen, +0.5%) and net income of 7.7 billion yen (up 3.7 billion yen, +94.4%). EBITDA is forecast at 19.1 billion yen (▲0.8 billion yen, ▲3.9%), which includes the effect of depreciation and goodwill amortization declining to ▲6.1 billion yen (previous year ▲7.0 billion yen). ROE is expected to be 6.8% (estimate) and ROIC 7.4% (estimate).
| Item | FY March 2027 Forecast | FY March 2026 Actual | Change | Change (%) |
|---|---|---|---|---|
| Net sales | 181.0 billion yen | 180.1 billion yen | +0.9 billion yen | +0.5% |
| Operating profit | 13.0 billion yen | 12.9 billion yen | +0.1 billion yen | +0.7% |
| (Operating margin) | 7.2% | 7.2% | – | – |
| Ordinary profit | 12.7 billion yen | 12.6 billion yen | +0.1 billion yen | +0.5% |
| Net income | 7.7 billion yen | 4.0 billion yen | +3.7 billion yen | +94.4% |
| EBITDA | 19.1 billion yen | 19.9 billion yen | ▲0.8 billion yen | ▲3.9% |
| ROE | 6.8% (estimate) | 3.5% | – | – |
| ROIC | 7.4% (estimate) | 7.3% | – | – |
Shareholder Returns
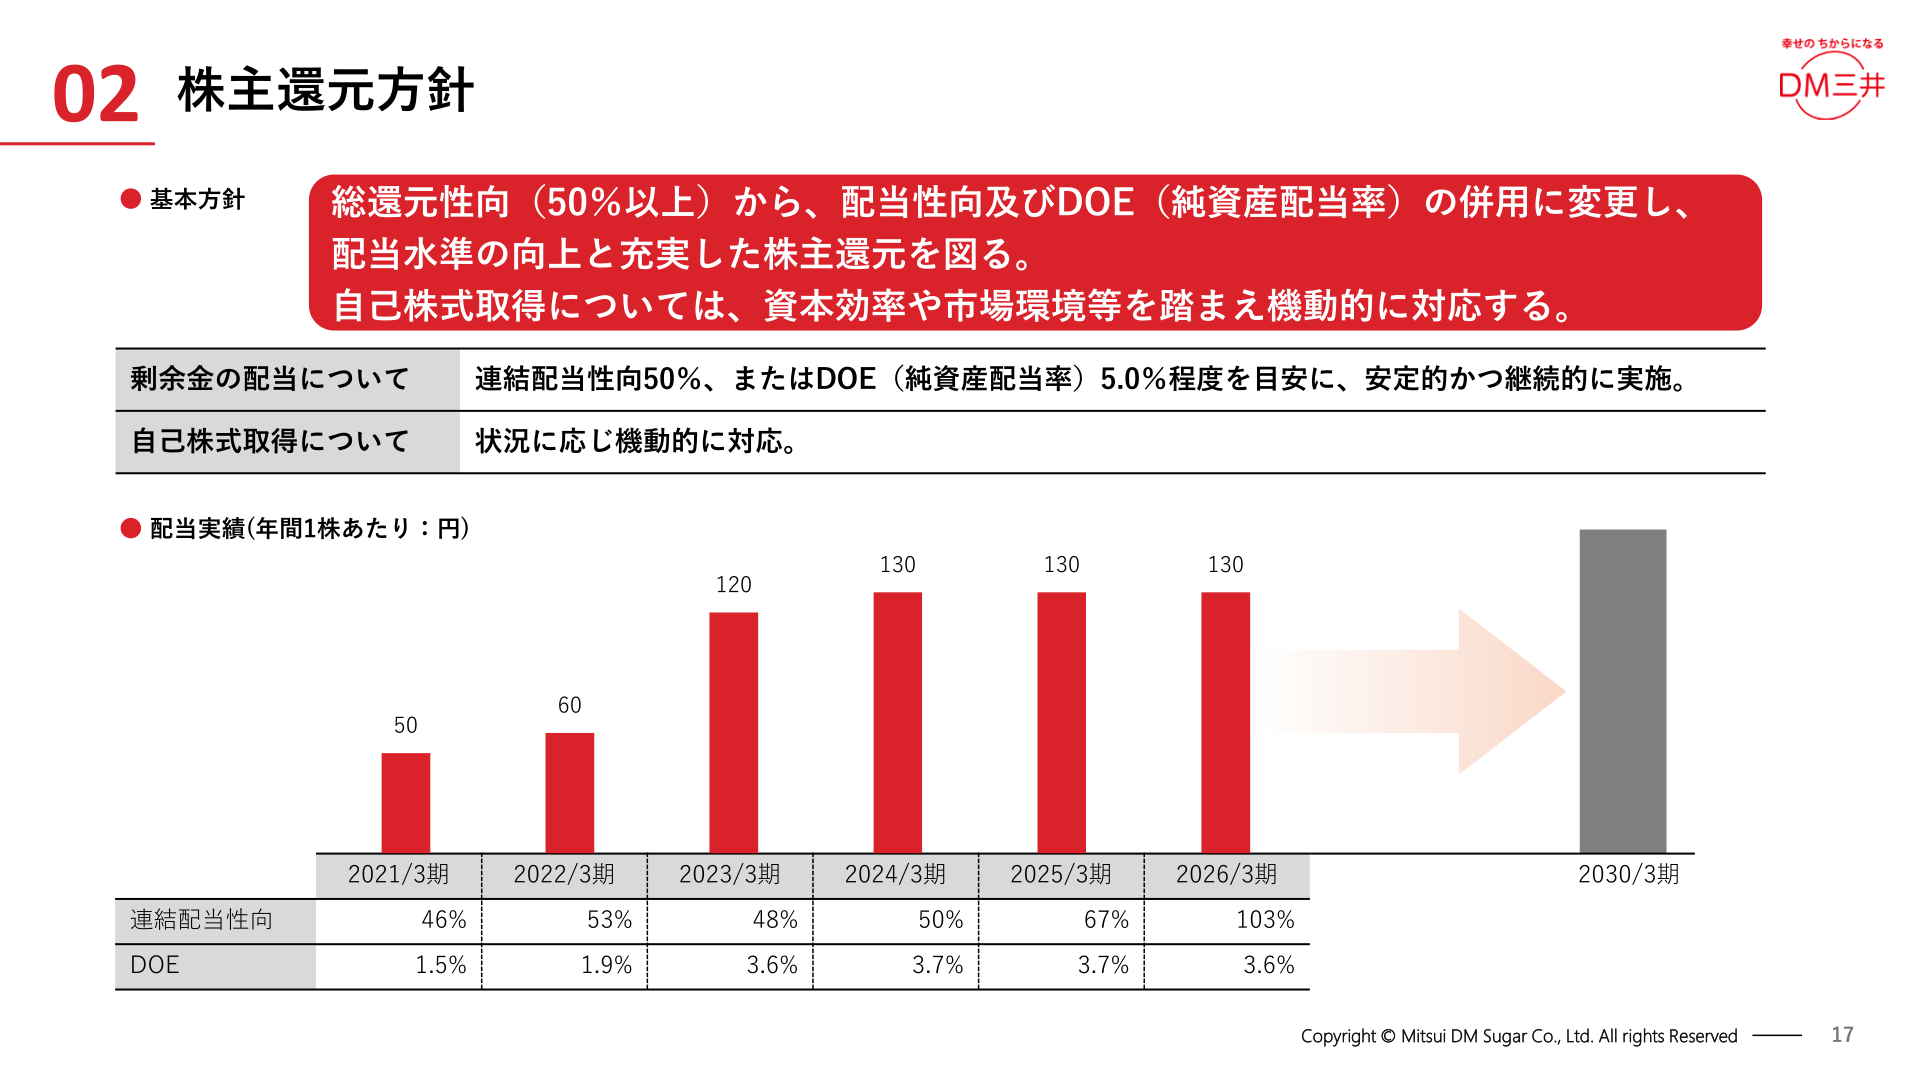
For dividends from surplus, the company’s policy is to pay stably and continuously, using a consolidated dividend payout ratio of 50% or a DOE (dividend on equity ratio) of around 5.0% as a guide. Share buybacks will be handled flexibly according to circumstances. The company has changed its policy from the previous “total return ratio of 50% or more” to a “combined use of the payout ratio and DOE,” and states that it will raise the level of dividends and provide enhanced shareholder returns. For the fiscal year ended March 2026, the consolidated dividend payout ratio was 103% and DOE was 3.6%.
| Item | FY3/2021 | FY3/2022 | FY3/2023 | FY3/2024 | FY3/2025 | FY3/2026 |
|---|---|---|---|---|---|---|
| Consolidated dividend payout ratio | 46% | 53% | 48% | 50% | 67% | 103% |
| DOE | 1.5% | 1.9% | 3.6% | 3.7% | 3.7% | 3.6% |
Medium-Term Management Plan 2030 “Mitsui DM Group 2.0”
The company formulated Medium-Term Management Plan 2030, “Mitsui DM Group 2.0 — Value Creation through Transformation, Toward the Next Growth Stage,” covering the fiscal years ending March 2027 through March 2030. It will promote three transformations — “transformation of the business model (BX),” “transformation of the management foundation (IX)” and “transformation of sustainability management (SX)” — with four pillars as priority themes: restructuring the business portfolio, expanding human capital and fostering an organizational culture that takes on challenges, improving creativity and efficiency as an organization, and contributing to the realization of a sustainable society. The targeted management indicators for the fiscal year ending March 2030 are consolidated net sales of 220.0 billion yen, EBITDA of 23.0 billion yen, ROIC of 9% or more and ROE of 9% or more (the fiscal year ended March 2026 actual figures were 180.1 billion yen, 19.9 billion yen, 7.3% and 3.5%, respectively). In the cash allocation for the four-year cumulative period from the fiscal year ending March 2027 to the fiscal year ending March 2030, the company plans total investment of 55.0 to 72.0 billion yen (of which 30.0 to 40.0 billion yen is for new business and R&D investment, including M&A) and shareholder returns (dividends) of 18.0 to 21.0 billion yen.
This article is an analysis based on publicly available information and is not a recommendation to buy or sell any specific securities. Investment decisions are your own responsibility.
















