
This article is based on publicly available IR materials and is not a recommendation to buy or sell any specific securities.
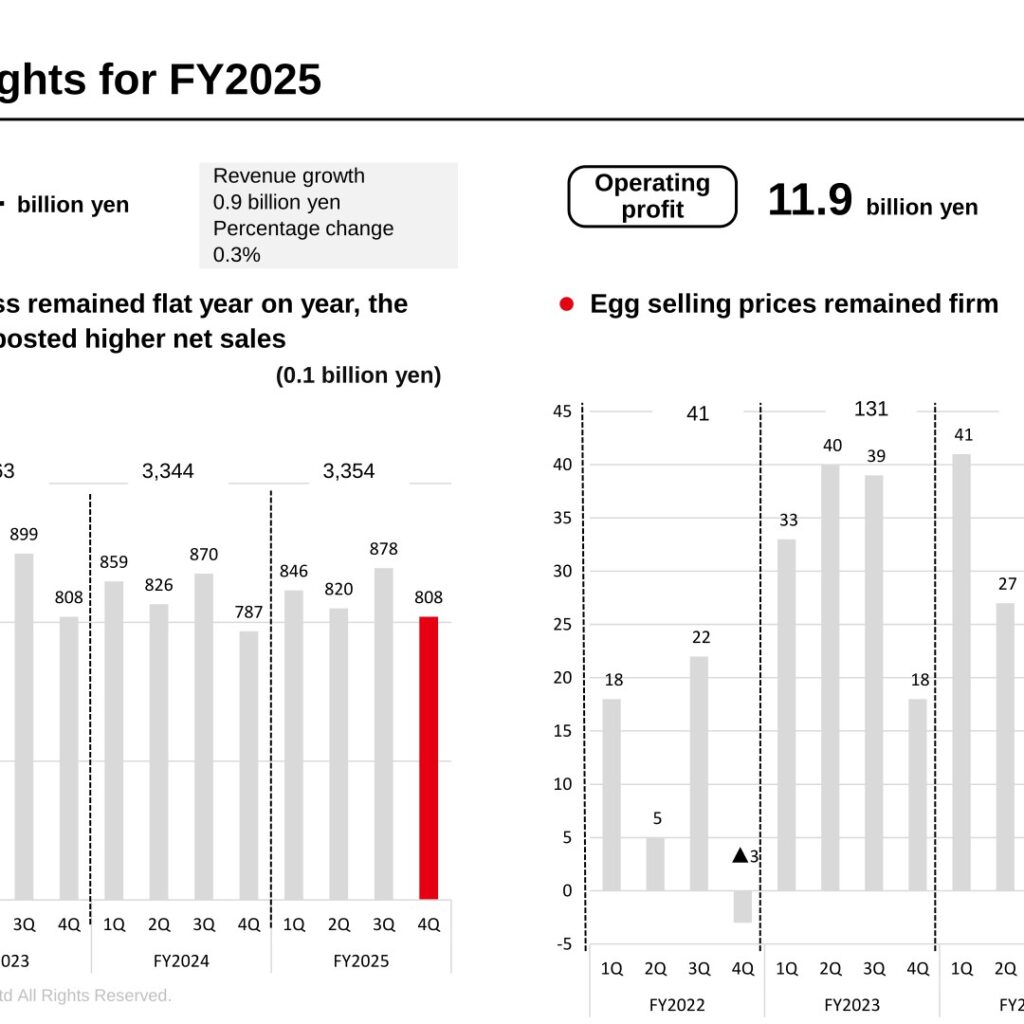
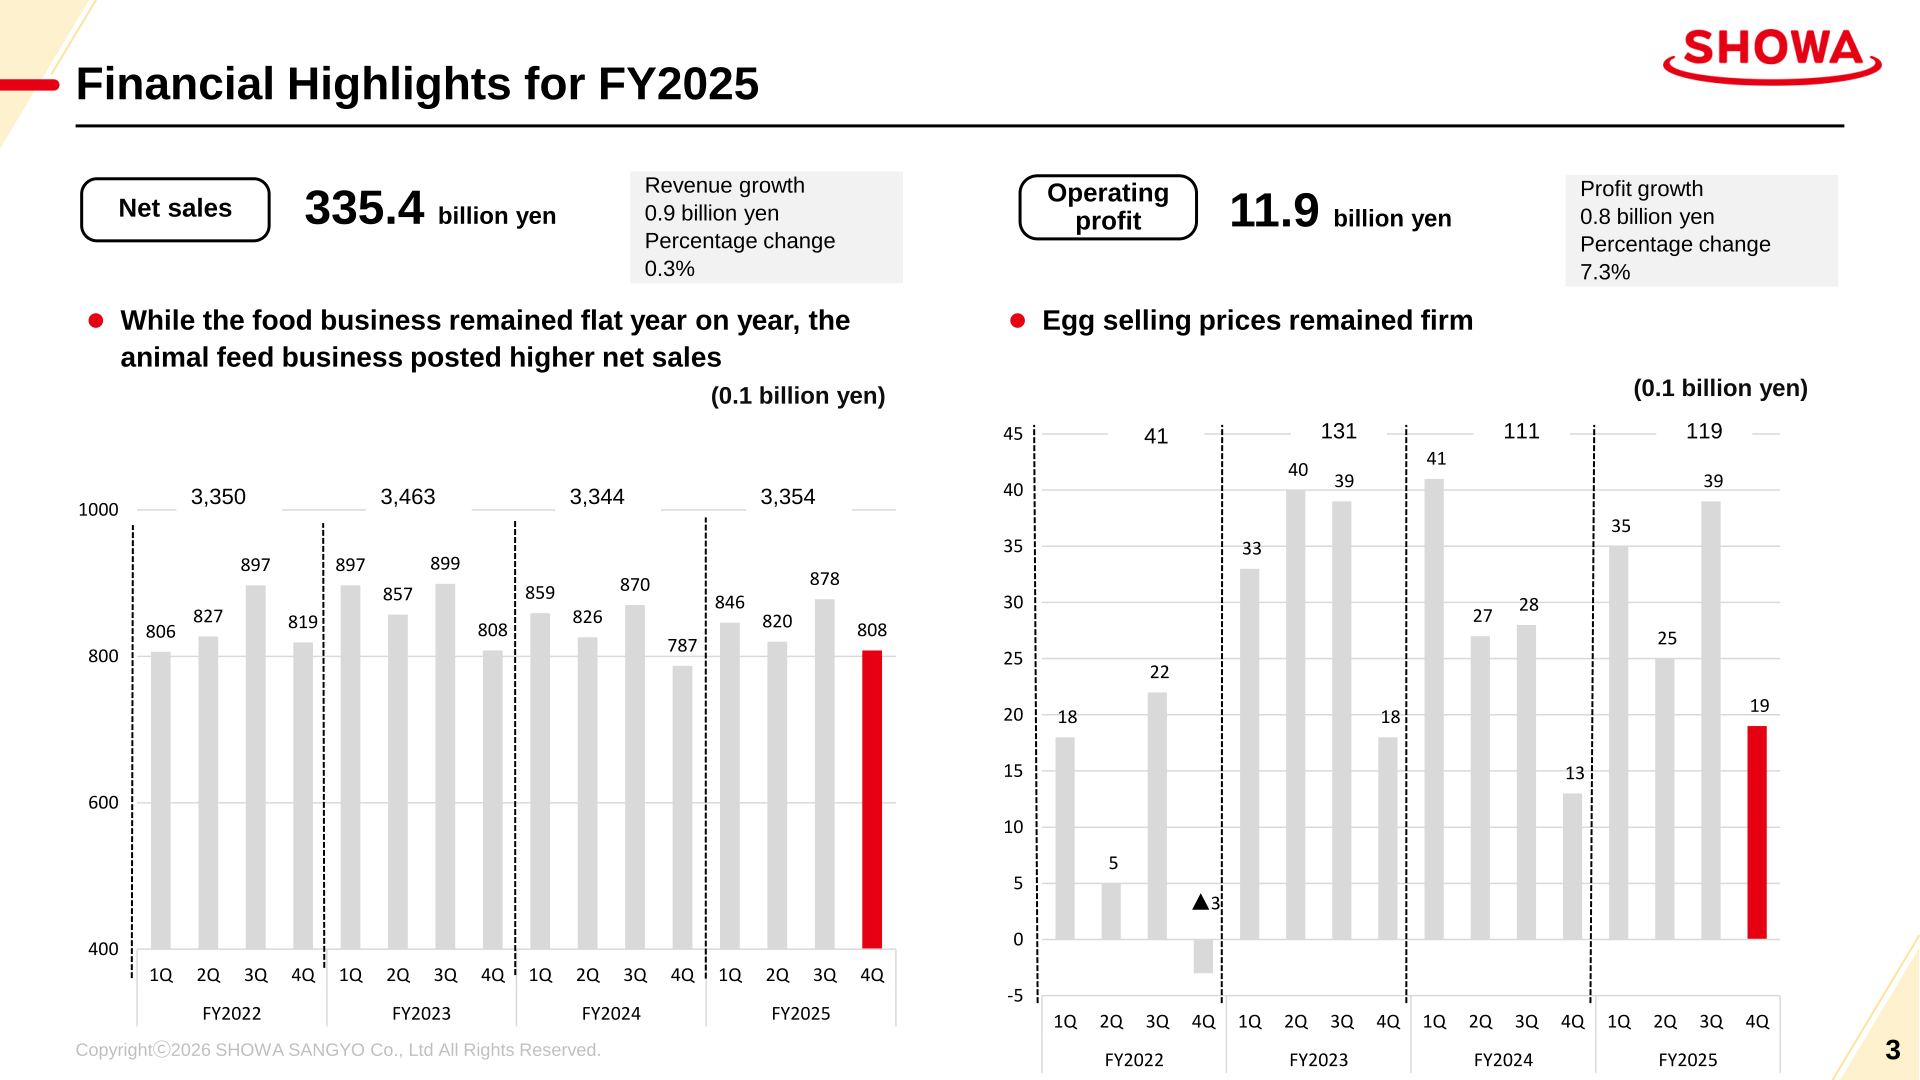
Showa Sangyo Co., Ltd. reported net sales of 335.4 billion yen for FY2025 (ended March 31, 2026), a gain of 0.9 billion yen or 0.3% year on year, and operating profit of 11.9 billion yen, up 0.8 billion yen or 7.3%. The food business was broadly flat while the animal feed business posted higher net sales, with egg selling prices remaining firm. Alongside the results, the company presented its new Medium-Term Management Plan 26–29 and a long-term vision targeting FY2035.
Consolidated Results (Full-Year Actual)
Net sales came to 335.4 billion yen and operating profit to 11.9 billion yen. In the operating profit bridge from FY24-4Q to FY25-4Q, the materials attribute ▲21 to sales volume, 0 to sales price, 41 to cost of sales and ▲12 to SG&A expenses, etc. (0.1 billion yen). Prior-year comparatives for ordinary profit and profit are not presented in the briefing materials.
| Item (0.1 billion yen) | FY2025 | FY2024 | Percentage change |
|---|---|---|---|
| Net sales | 3,354 | 3,344 | 0.3% |
| Operating profit | 119 | 111 | 7.3% |
| Ordinary profit | 144 | — | — |
| Profit | 106 | — | — |
On the balance sheet, total assets rose to 2,749 from 2,555 (0.1 billion yen) at the end of March 2025, an increase of 194, mainly on higher investment securities and property, plant and equipment. Total liabilities increased 54 to 1,223, of which interest-bearing debt including lease obligations was 510 against 505 a year earlier. Total net assets rose 139 to 1,526.
Segment Results
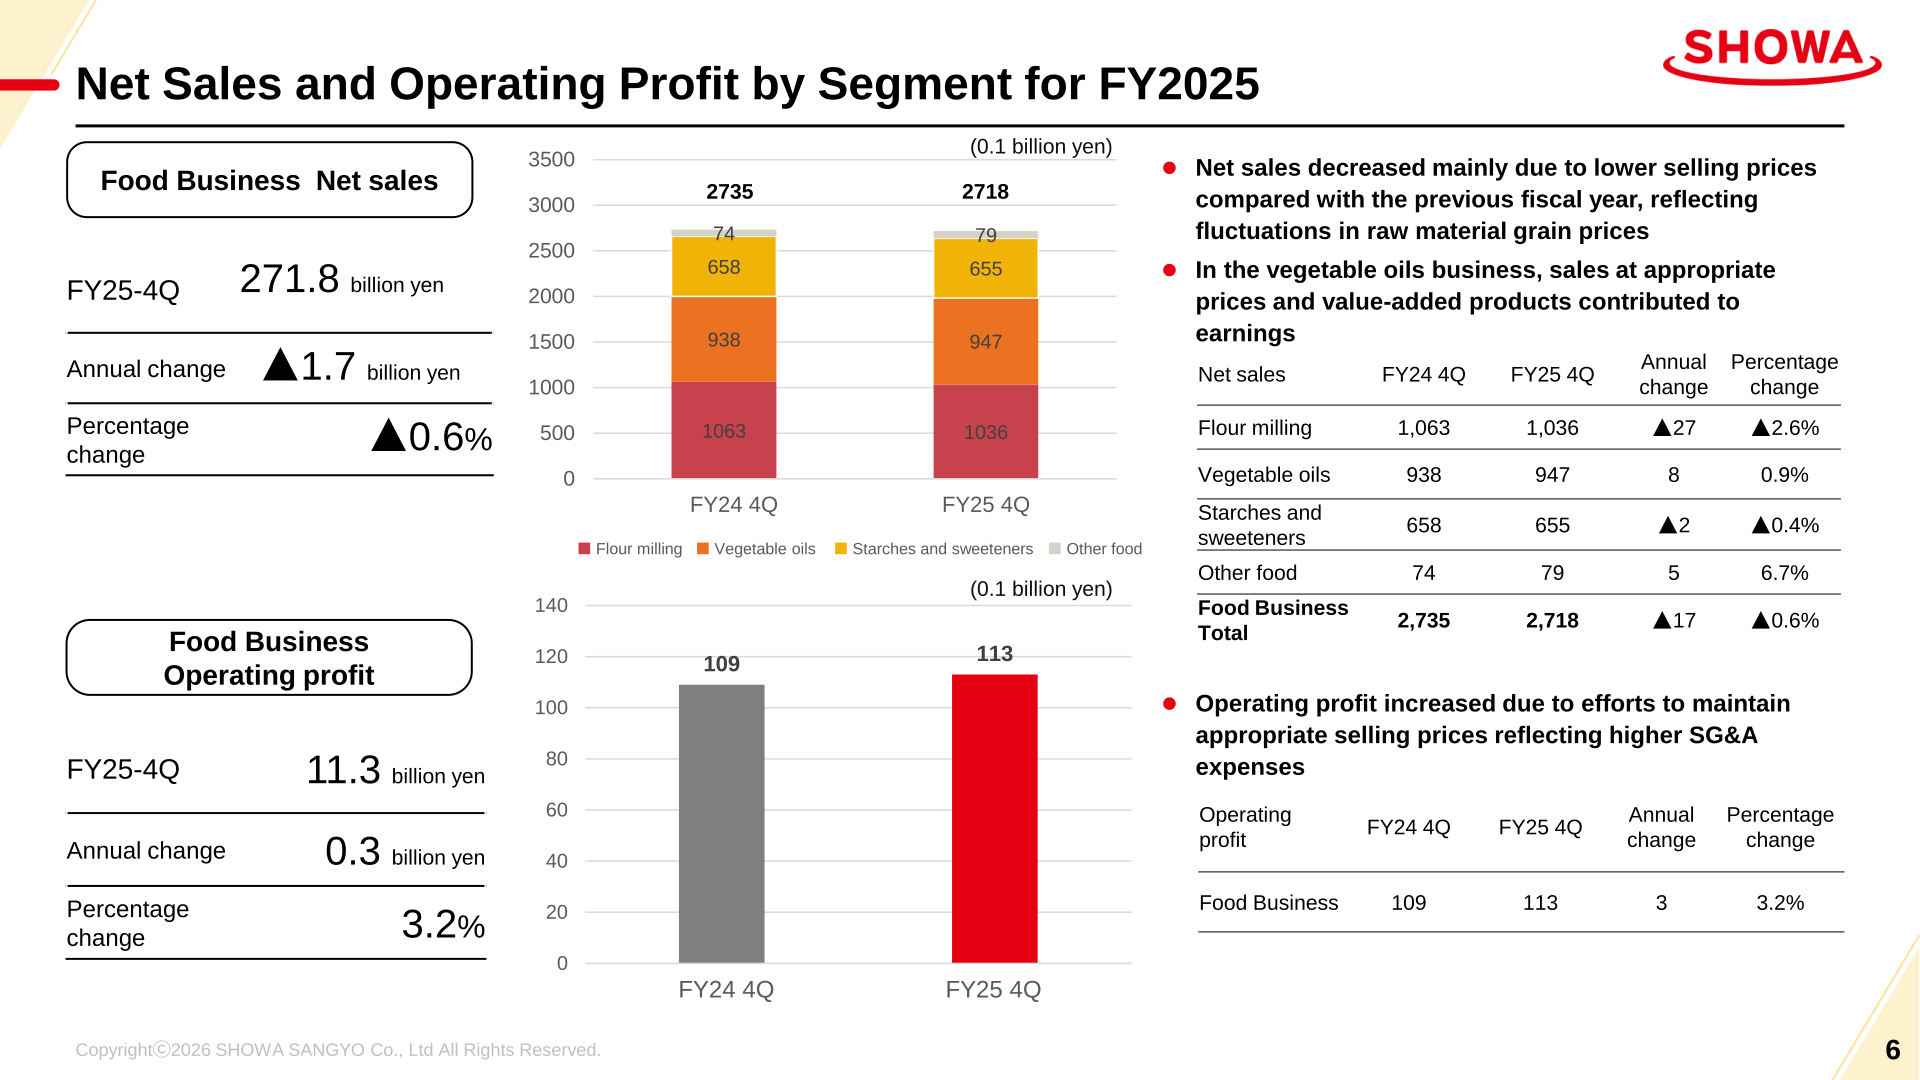
Food Business net sales were 2,718 (0.1 billion yen), down 17 or ▲0.6%, as selling prices declined year on year in line with fluctuations in raw material grain prices. Food Business operating profit nonetheless rose 3 to 113, a gain of 3.2%, helped by efforts to maintain appropriate selling prices reflecting higher SG&A expenses; in vegetable oils, sales at appropriate prices and of value-added products contributed to earnings. The Animal Feed Business lifted net sales 25 to 587 (4.6%) as the egg market remained firm, and more than doubled operating profit to 10 from 4, a rise of 107.2%, despite slightly lower sales volumes of compound animal feed and eggs.
| Segment / Category (0.1 billion yen) | FY25 4Q | FY24 4Q | Annual change | Percentage change |
|---|---|---|---|---|
| Flour milling — Net sales | 1,036 | 1,063 | ▲27 | ▲2.6% |
| Vegetable oils — Net sales | 947 | 938 | 8 | 0.9% |
| Starches and sweeteners — Net sales | 655 | 658 | ▲2 | ▲0.4% |
| Other food — Net sales | 79 | 74 | 5 | 6.7% |
| Food Business Total — Net sales | 2,718 | 2,735 | ▲17 | ▲0.6% |
| Food Business — Operating profit | 113 | 109 | 3 | 3.2% |
| Animal Feed Business — Net sales | 587 | 561 | 25 | 4.6% |
| Animal Feed Business — Operating profit | 10 | 4 | 5 | 107.2% |
Within the Food Business, the materials break the 0.3 billion yen increase in operating profit into a 1.6 billion yen improvement in sales gross profit across the three categories plus other food, offset by a ▲1.3 billion yen difference in SG&A expenses, etc. By category, gross profit changes were 3 for flour milling, ▲3 for vegetable oils and 17 for starches and sweeteners (0.1 billion yen).
Cost Environment
The company notes that raw material grain markets are significantly affected by factors such as developments in the Middle East and U.S. biofuel policies, and that grain markets were driven by rising geopolitical risks and higher oil prices despite pressure from ample global supply. Fourth-quarter FY2025 results against FY2026 assumptions were: wheat 61,010 yen/t versus 61,840; soybean 1,083 ¢/Bu versus 1,062; rapeseed 625 C$/MT versus 682; corn 434 ¢/Bu versus 450; sea freight 52.4 US$/t versus 50.0; the exchange rate 155.99 yen/US$ versus 157.00; and LNG 85.9 yen/kg versus 80.2.
Full-Year Forecast
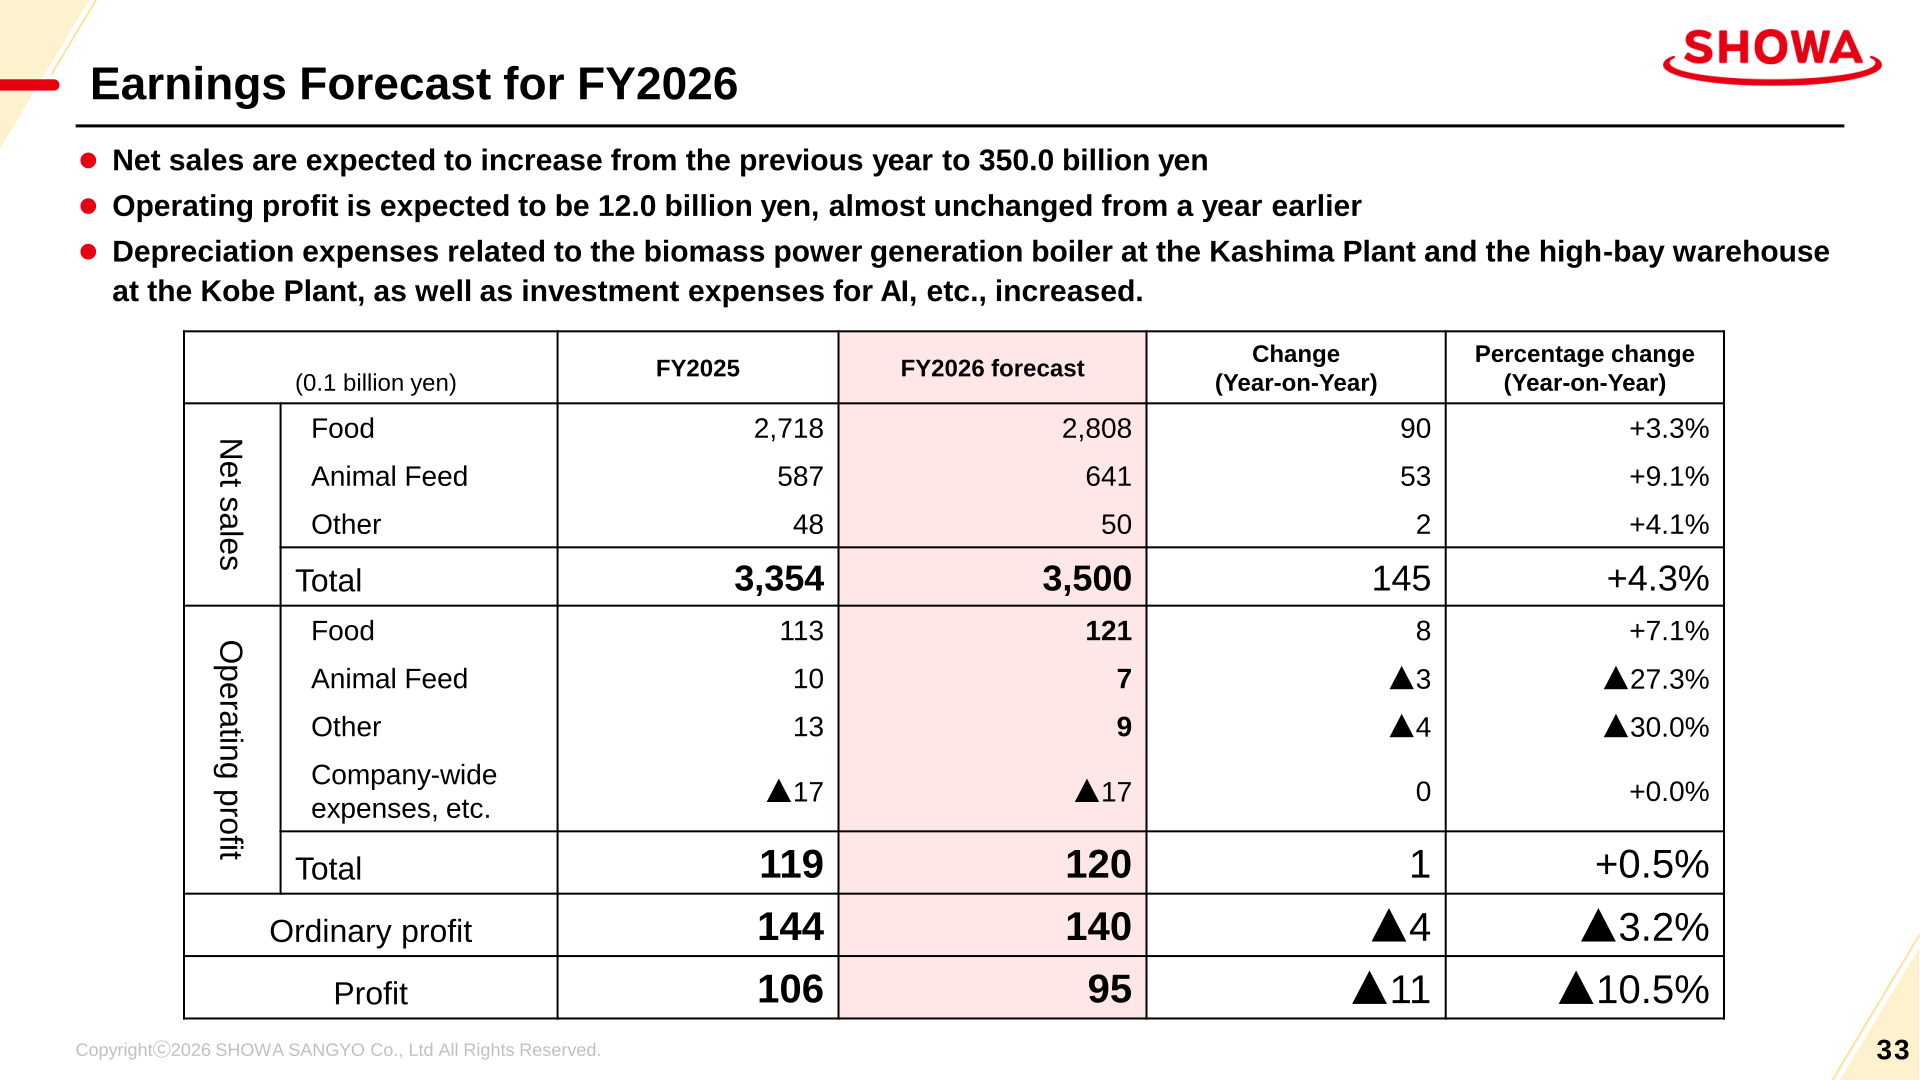
For FY2026 the company expects net sales to increase to 350.0 billion yen and operating profit to be 12.0 billion yen, almost unchanged from a year earlier. It cites increased depreciation expenses related to the biomass power generation boiler at the Kashima Plant and the high-bay warehouse at the Kobe Plant, as well as investment expenses for AI and other items. Ordinary profit is guided to 140 and profit to 95 (0.1 billion yen), both below the FY2025 result.
| Item (0.1 billion yen) | FY2025 | FY2026 forecast | Change (Year-on-Year) | Percentage change (Year-on-Year) |
|---|---|---|---|---|
| Net sales — Food | 2,718 | 2,808 | 90 | +3.3% |
| Net sales — Animal Feed | 587 | 641 | 53 | +9.1% |
| Net sales — Other | 48 | 50 | 2 | +4.1% |
| Net sales — Total | 3,354 | 3,500 | 145 | +4.3% |
| Operating profit — Food | 113 | 121 | 8 | +7.1% |
| Operating profit — Animal Feed | 10 | 7 | ▲3 | ▲27.3% |
| Operating profit — Other | 13 | 9 | ▲4 | ▲30.0% |
| Operating profit — Company-wide expenses, etc. | ▲17 | ▲17 | 0 | +0.0% |
| Operating profit — Total | 119 | 120 | 1 | +0.5% |
| Ordinary profit | 144 | 140 | ▲4 | ▲3.2% |
| Profit | 106 | 95 | ▲11 | ▲10.5% |
Medium-Term Management Plan 26–29
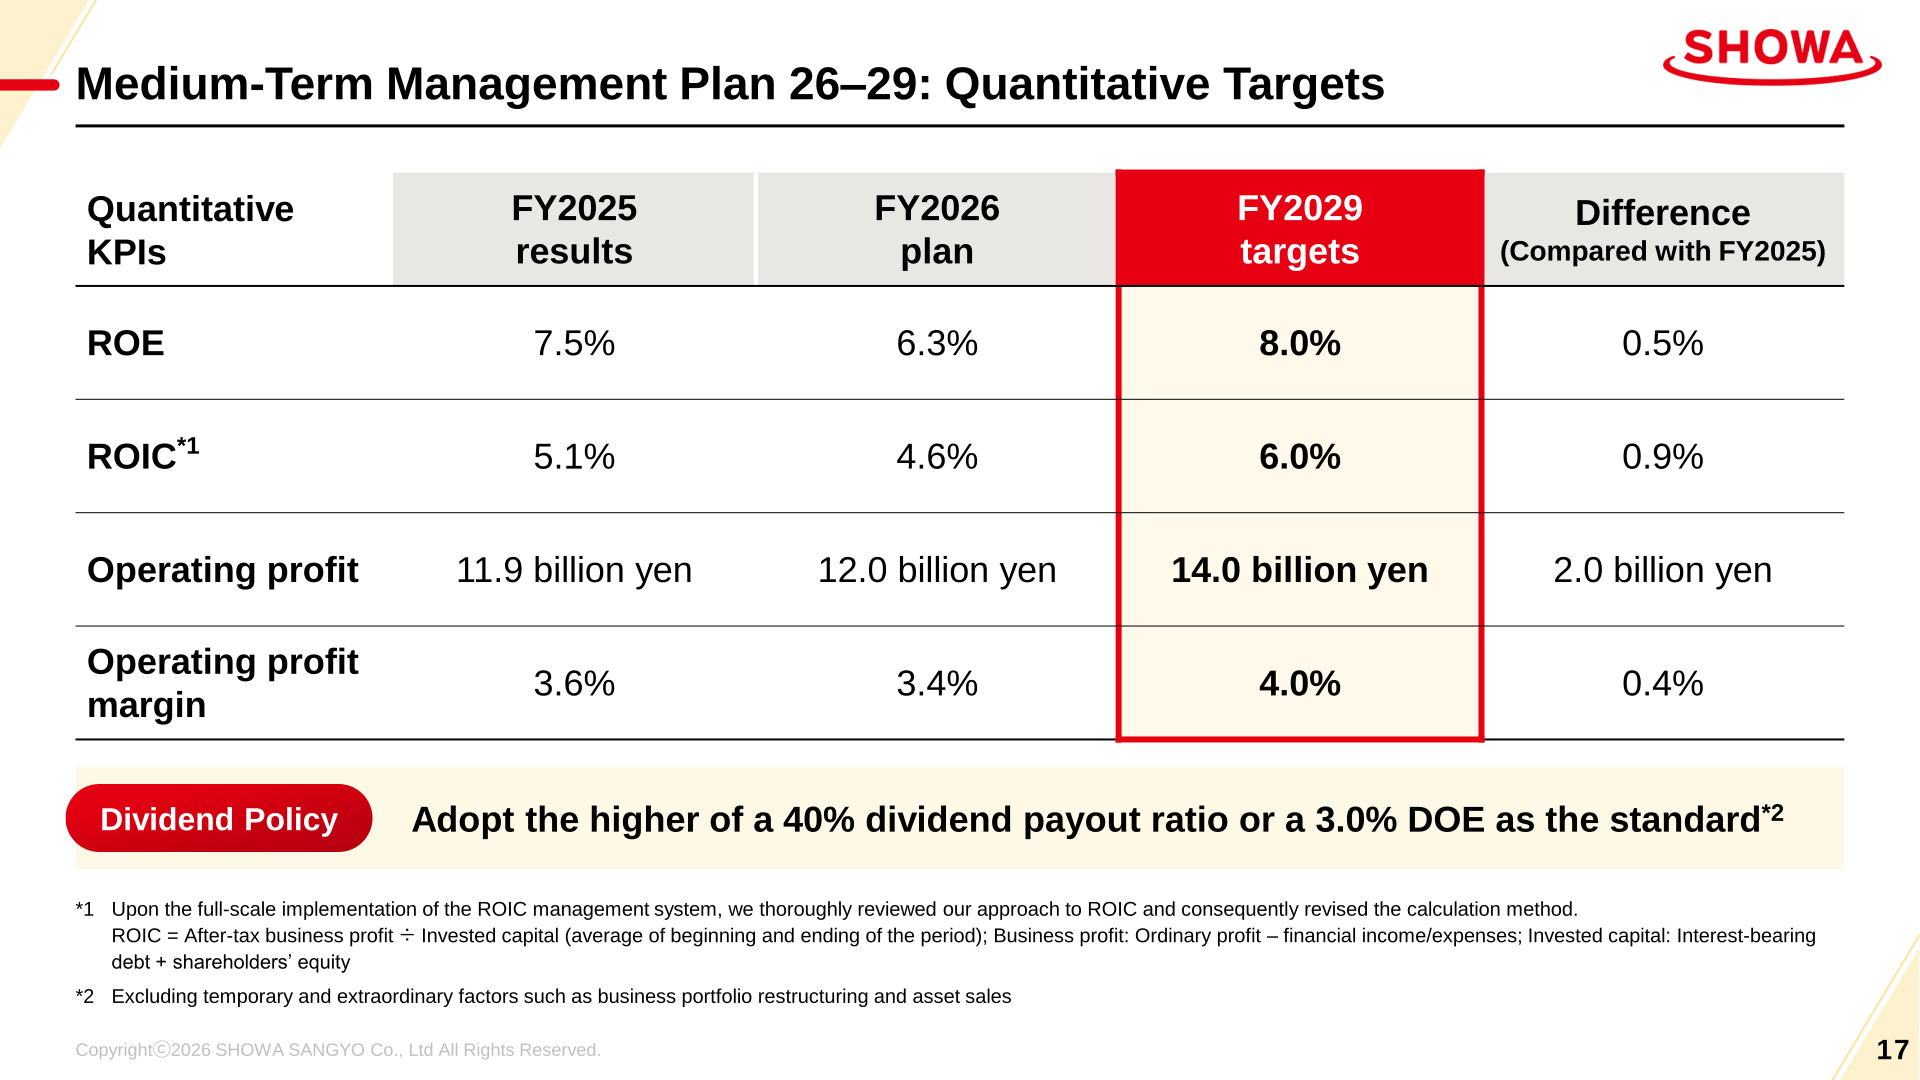
Following the conclusion of “SHOWA Next Stage for 2025,” the company launched Medium-Term Management Plan 26–29 under the overall policy of “Strengthening Profit Structure,” positioned as Step 1 toward SHOWA VISION 2035. The plan combines a shift to high value-added products and cost reduction in the core business areas of flour milling, vegetable oils, starches and sweeteners and animal feed with initiatives to strengthen the business foundation across corporate, R&D, procurement, logistics, sales and DX functions. ROIC has been recalculated on a revised method upon the full-scale implementation of the ROIC management system.
| Quantitative KPIs | FY2025 results | FY2026 plan | FY2029 targets | Difference (Compared with FY2025) |
|---|---|---|---|---|
| ROE | 7.5% | 6.3% | 8.0% | 0.5% |
| ROIC | 5.1% | 4.6% | 6.0% | 0.9% |
| Operating profit | 11.9 billion yen | 12.0 billion yen | 14.0 billion yen | 2.0 billion yen |
| Operating profit margin | 3.6% | 3.4% | 4.0% | 0.4% |
By segment, the plan sets Medium-Term Plan 26–29 average operating profit targets of 12.7 billion yen (4.5% margin) for the Food Business against 11.3 billion yen (4.2%) in FY2025, and 0.8 billion yen (1.0%) for the Animal Feed Business against 1.0 billion yen (1.7%). FY2029 net sales of high value-added products are targeted at 116% of the FY2025 level, calculated on an internally established standard value. Over the four years the company plans investments of 57.0 billion yen or more, comprising value creation investment of 17.0 billion yen or more and core business investment of 40.0 billion yen or more, plus shareholder returns of 21.0 billion yen or more.
Named investments include approximately 5.3 billion yen at Boso oil and fat Co., Ltd.’s Funabashi Plant for renewal of rice bran oil refining equipment and a new filling warehouse (construction from February 2026, completion scheduled March 2030); 3.5 billion yen for a flour milling automated high-bay warehouse at the Kobe Plant with a total floor area of 3,900 m2 and capacity of 190,000 bags; and approximately 4.0 billion yen for a biomass power generation boiler at the Kashima Plant that started operation in April 2026 and is expected to cut CO2 by approximately 37,000 tons per year, equivalent to approximately 8% of the Group’s total GHG emissions (Scope 1, 2).
Shareholder Returns
The dividend policy under the new plan is to adopt the higher of a 40% dividend payout ratio or a 3.0% DOE as the standard, excluding temporary and extraordinary factors such as business portfolio restructuring and asset sales, with flexible additional shareholder returns in line with investment progress and financial conditions. The dividend per share for FY2025 was 115 yen, giving a payout ratio of 35.2% and a DOE of 2.6%.
| Item | FY2022 | FY2023 | FY2024 | FY2025 | Medium-Term Management Plan 26–29 (Targets) |
|---|---|---|---|---|---|
| Dividend payout ratio | 27.9% | 21.7% | 28.1% | 35.2% | 40.0% |
| DOE | 1.9% | 2.1% | 2.4% | 2.6% | 3.0% |
| Dividend per share | 65 yen | 80 yen | 100 yen | 115 yen | ー |
Long-Term Vision to FY2035
The new long-term vision, “Expand all the possibilities of grains,” splits the portfolio into Food Solution and Life Solution and targets FY2035 KPIs of ROE of 9.0% or higher, ROIC of 8.0% or higher and operating profit of 20.0 billion yen or more, against FY2025 results of 7.5%, 5.1% and 11.9 billion yen. Over ten years the company plans investments of 204.0 billion yen or more — value creation of 82.0 billion yen or more and infrastructure of 122.0 billion yen or more — and shareholder returns of 56.0 billion yen or more, with a return policy targeting a dividend payout ratio of 40% or higher.
New Group environmental goals set GHG emissions (Scope 1, 2) reductions of 37% or more by FY2030 and 53% or more by FY2035 from an FY2019 base year, with carbon neutrality targeted for 2050, alongside continued food loss reduction of 30% or more versus FY2018 and a water consumption reduction of 12% or more on a basic unit basis by FY2030 versus FY2019.
This article is an analysis based on publicly available information and is not a recommendation to buy or sell any specific securities. Investment decisions are your own responsibility.
















