
This article is based on publicly available IR materials and is not a recommendation to buy or sell any specific securities.
Fukuda Corporation, a general contractor based in Niigata Prefecture with more than 120 years of history, reported a moderate increase in both revenue and profit for the fiscal year ended December 2025. Consolidated net sales were ¥167.9 billion (+0.8% YoY) and operating profit was ¥7.7 billion (+1.4% YoY). The parent company saw a reactionary decrease due to the absence of the large-scale real-estate sales seen in the previous year, while the strong performance of subsidiaries drove consolidated net sales higher. For the fiscal year ending December 2026 the Company forecasts higher net sales but lower profit.
Consolidated Results (Full-Year Actual)
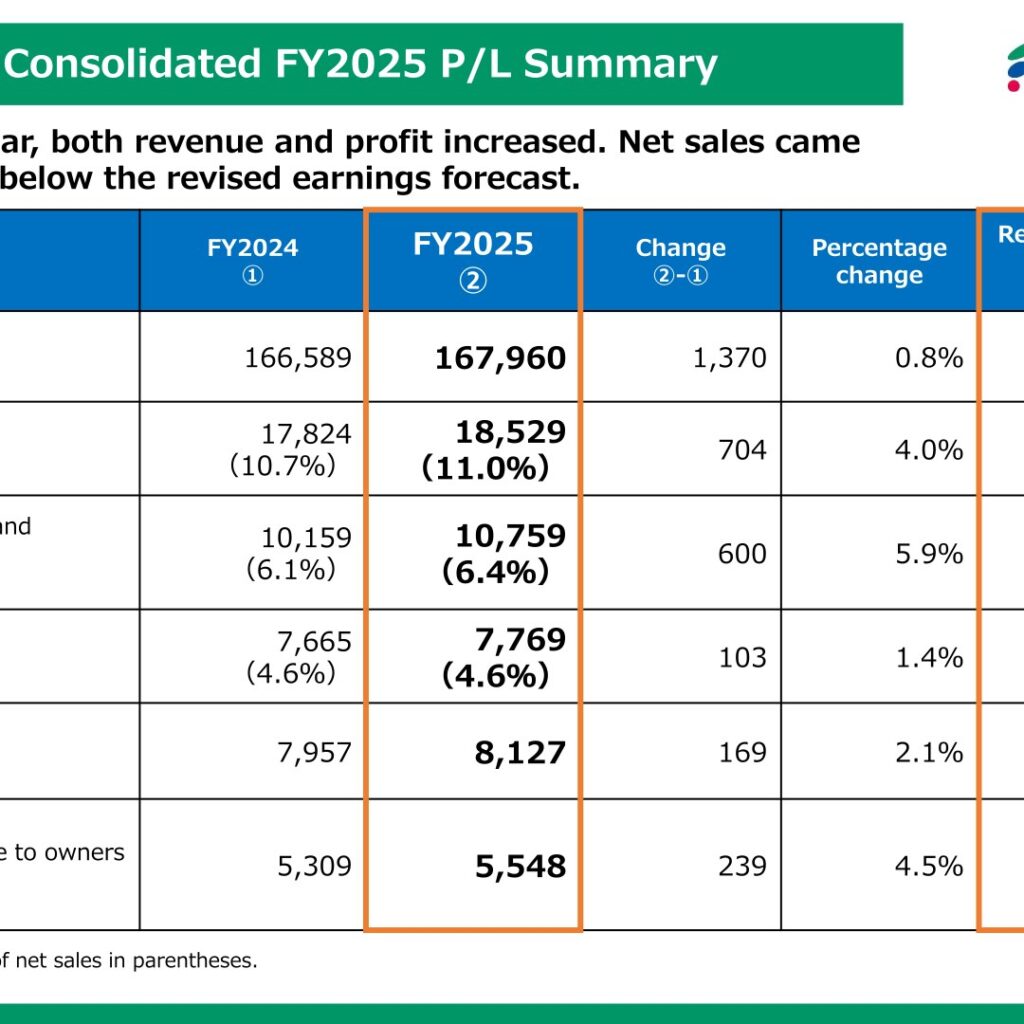
Year on year, both revenue and profit increased. Net sales came in slightly below the revised earnings forecast announced on November 7. On operating profit, the parent company recorded higher profits in its construction business due to improved profitability, but the absence of large development-related sales gains such as those seen in the previous fiscal year resulted in a slight decrease in profit on a non-consolidated basis; at subsidiaries, profit rose due to completion of large contracts, strong disaster-recovery related work at civil subsidiaries, and solid renewal business in urban areas.
| Item | FY2024 | FY2025 | Change | Percentage change | Revised forecast — FY2025 (Nov. 7) |
|---|---|---|---|---|---|
| Net sales | 166,589 | 167,960 | 1,370 | 0.8% | 170,000 |
| Gross profit | 17,824(10.7%) | 18,529(11.0%) | 704 | 4.0% | 18,000(10.6%) |
| Selling, general and administrative expenses (SG&A) | 10,159(6.1%) | 10,759(6.4%) | 600 | 5.9% | 11,000(6.5%) |
| Operating profit | 7,665(4.6%) | 7,769(4.6%) | 103 | 1.4% | 7,000(4.1%) |
| Ordinary profit | 7,957 | 8,127 | 169 | 2.1% | 7,300 |
| Profit attributable to owners of parent | 5,309 | 5,548 | 239 | 4.5% | 4,800 |
Unit: JPY million. Percentage of net sales shown in parentheses. On the balance sheet, total assets rose to 147,476 from 142,814 and net assets rose to 90,166 from 85,407, lifting the equity ratio to 60.9% from 59.3%. Operating cash flow was 2,574 versus 5,877 a year earlier, investing cash flow was △1,127 versus △1,979, free cash flow was 1,446 versus 3,897, and financing cash flow was △2,572 versus △1,369, leaving cash and cash equivalents at end of period at 30,819 versus 31,946.
Segment Results
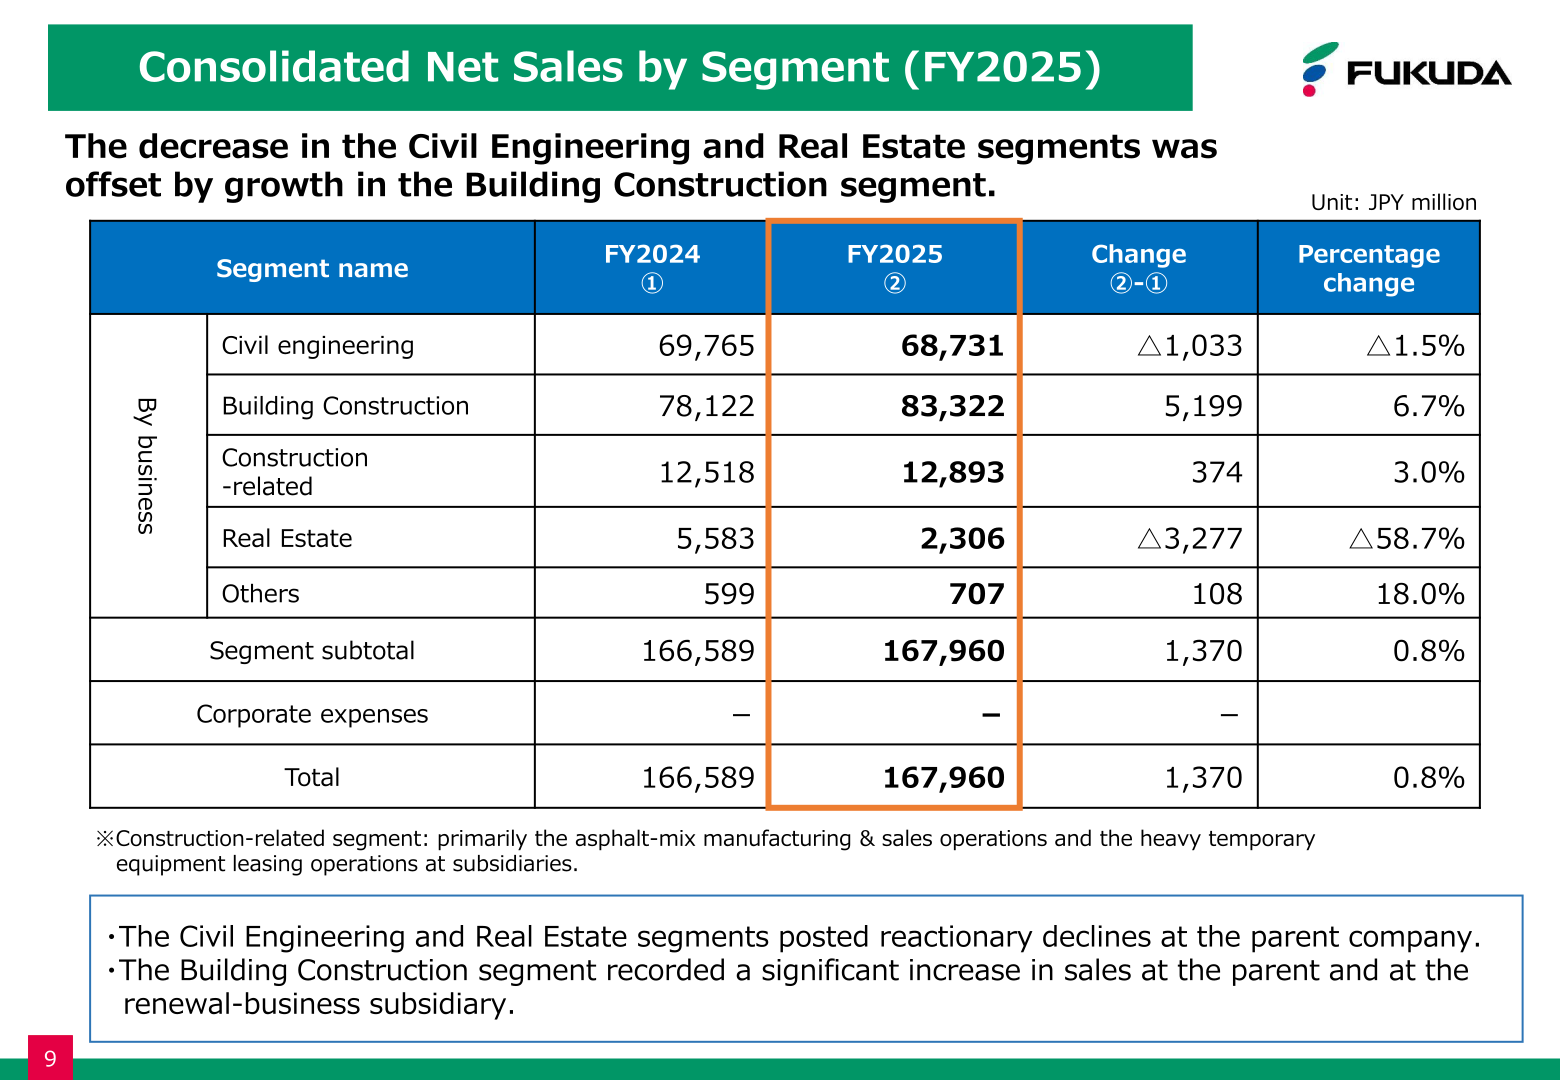
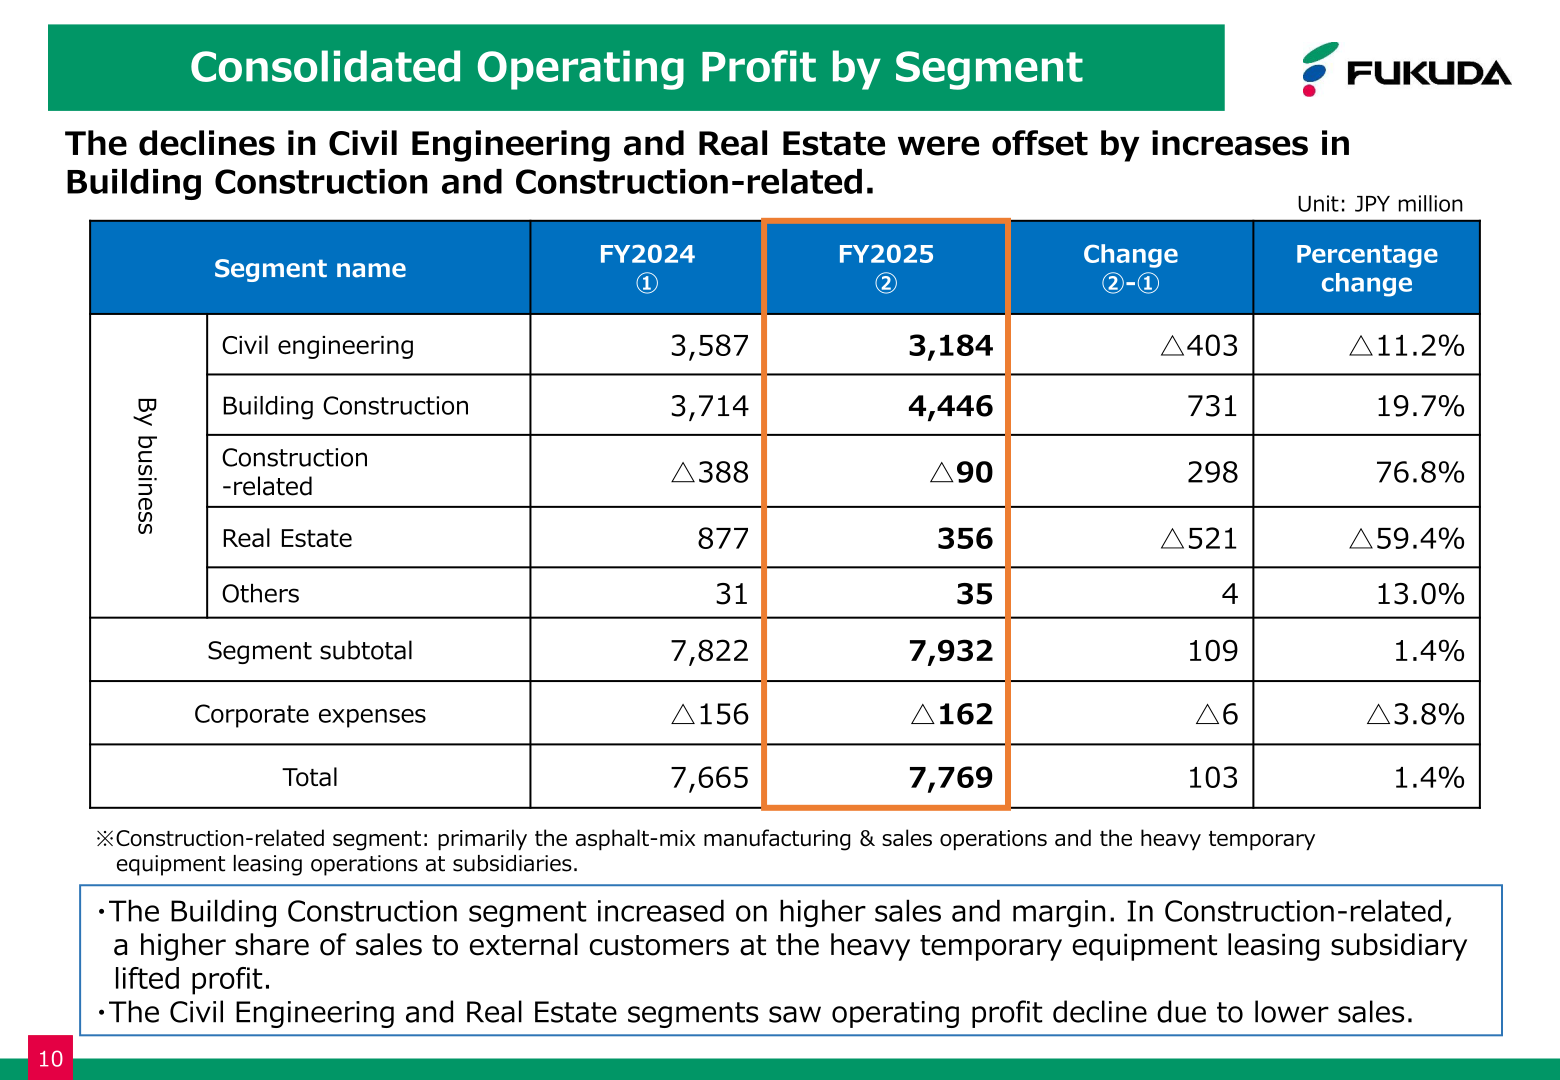
The decrease in the Civil Engineering and Real Estate segments was offset by growth in the Building Construction segment, which recorded a significant increase in sales at the parent and at the renewal-business subsidiary. On operating profit, the Building Construction segment increased on higher sales and margin, and in Construction-related a higher share of sales to external customers at the heavy temporary equipment leasing subsidiary lifted profit, while Civil Engineering and Real Estate declined on lower sales. The Construction-related segment consists primarily of the asphalt-mix manufacturing and sales operations and the heavy temporary equipment leasing operations at subsidiaries.
| Segment | Metric | FY2024 | FY2025 | Change | Percentage change |
|---|---|---|---|---|---|
| Civil engineering | Net sales | 69,765 | 68,731 | △1,033 | △1.5% |
| Building Construction | Net sales | 78,122 | 83,322 | 5,199 | 6.7% |
| Construction-related | Net sales | 12,518 | 12,893 | 374 | 3.0% |
| Real Estate | Net sales | 5,583 | 2,306 | △3,277 | △58.7% |
| Others | Net sales | 599 | 707 | 108 | 18.0% |
| Total | Net sales | 166,589 | 167,960 | 1,370 | 0.8% |
| Civil engineering | Operating profit | 3,587 | 3,184 | △403 | △11.2% |
| Building Construction | Operating profit | 3,714 | 4,446 | 731 | 19.7% |
| Construction-related | Operating profit | △388 | △90 | 298 | 76.8% |
| Real Estate | Operating profit | 877 | 356 | △521 | △59.4% |
| Others | Operating profit | 31 | 35 | 4 | 13.0% |
| Segment subtotal | Operating profit | 7,822 | 7,932 | 109 | 1.4% |
| Corporate expenses | Operating profit | △156 | △162 | △6 | △3.8% |
| Total | Operating profit | 7,665 | 7,769 | 103 | 1.4% |
Unit: JPY million.
FY2026 Forecast
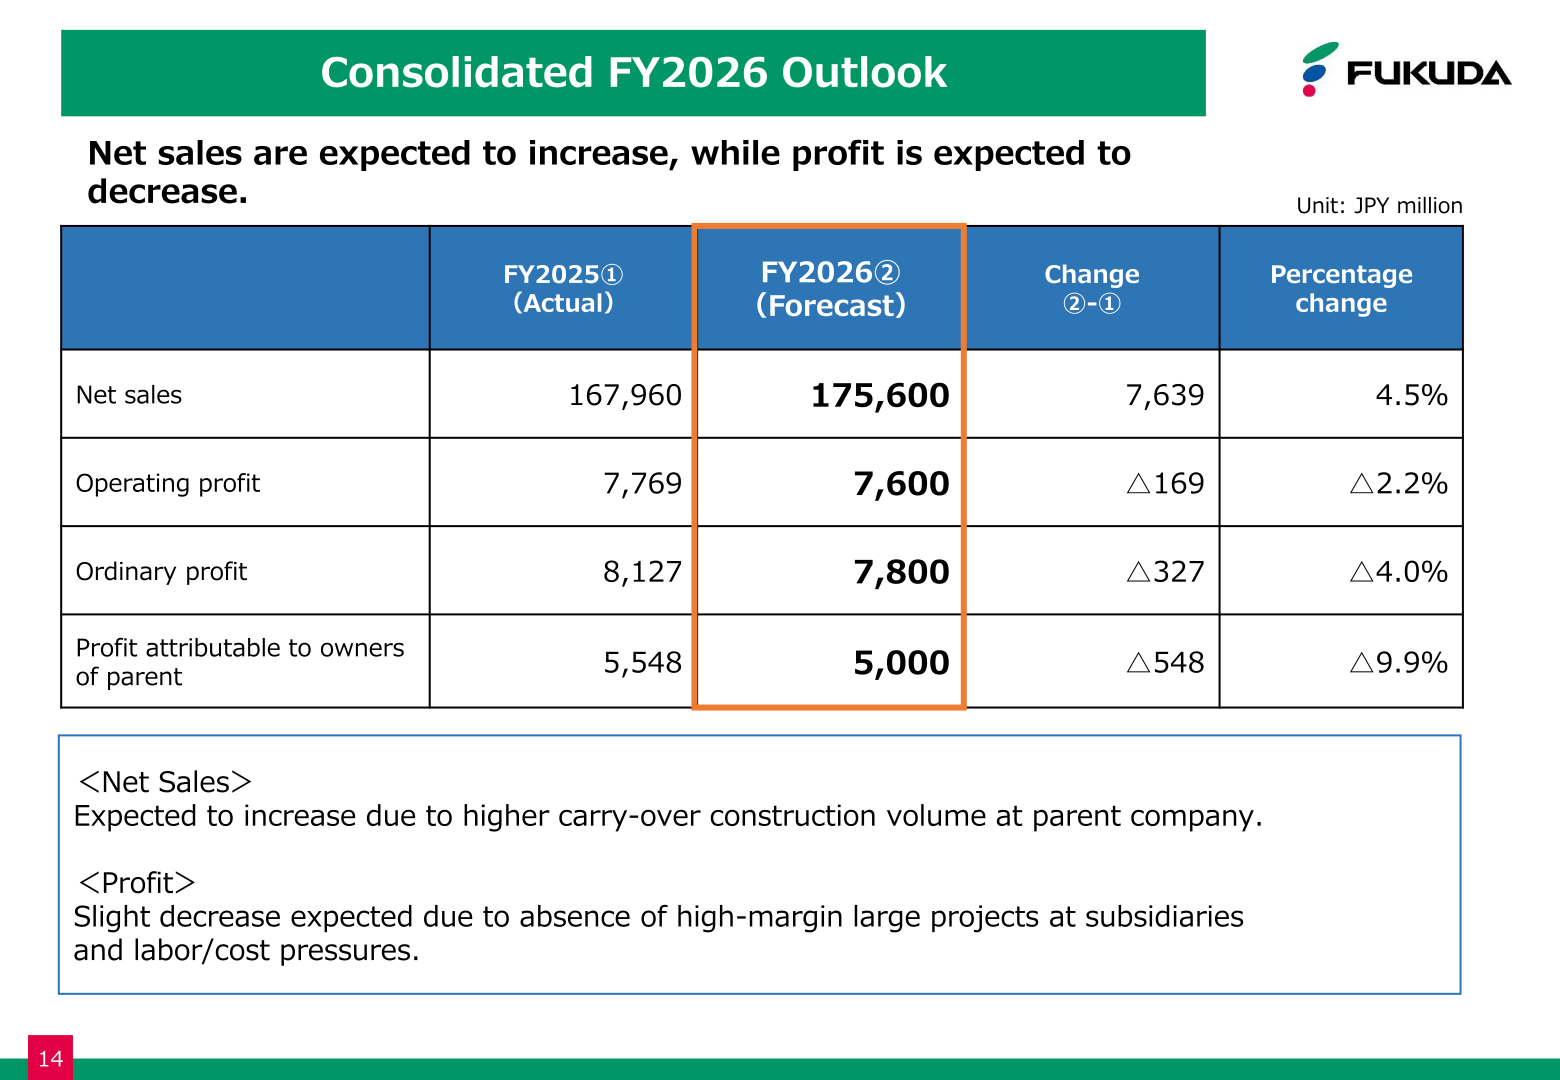
Net sales are expected to increase, while profit is expected to decrease. Net sales are expected to increase due to higher carry-over construction volume at the parent company, and a slight decrease in profit is expected due to the absence of high-margin large projects at subsidiaries and labor/cost pressures.
| Item | FY2025 (Actual) | FY2026 (Forecast) | Change | Percentage change |
|---|---|---|---|---|
| Net sales | 167,960 | 175,600 | 7,639 | 4.5% |
| Operating profit | 7,769 | 7,600 | △169 | △2.2% |
| Ordinary profit | 8,127 | 7,800 | △327 | △4.0% |
| Profit attributable to owners of parent | 5,548 | 5,000 | △548 | △9.9% |
Unit: JPY million.
Orders Received and Backlog (Non-Consolidated)
Orders in building construction increased significantly, and carry-over backlog also increased. The figures below exclude orders for real-estate development. For orders received in FY2026 the Company forecasts 100,400 on a non-consolidated basis, down 23,033 or △18.7% from 123,433 in FY2025, with Civil engineering at 26,000 (up 4,887, 23.1%), Building Construction at 74,000 (down △27,495, △27.1%) and Real estate at 400 (down △425, △51.5%). The Company states it will continue to target stable orders of ¥100.0 billion: in Civil engineering it aims to increase private-sector orders; in Building Construction, while demand remains strong, it assumes a level that allows efficient deployment of scarce human resources; and Real estate is described as a transitional year with the next major project expected.
| Item | FY2023 | FY2024 | FY2025 | Change | Percentage change |
|---|---|---|---|---|---|
| Orders received | 98,576 | 93,972 | 122,607 | 28,635 | 30.5% |
| (Civil engineering) | (22,102) | (21,087) | (21,112) | (25) | 0.1% |
| (Building Construction) | (76,474) | (72,885) | (101,495) | (28,609) | 39.3% |
| Carry-over backlog | 112,584 | 112,135 | 139,837 | 27,701 | 24.7% |
| (Civil engineering) | (37,812) | (34,676) | (33,283) | (△1,392) | △4.0% |
| (Building Construction) | (74,771) | (77,459) | (106,553) | (29,094) | 37.6% |
Unit: JPY million.
Shareholder Returns
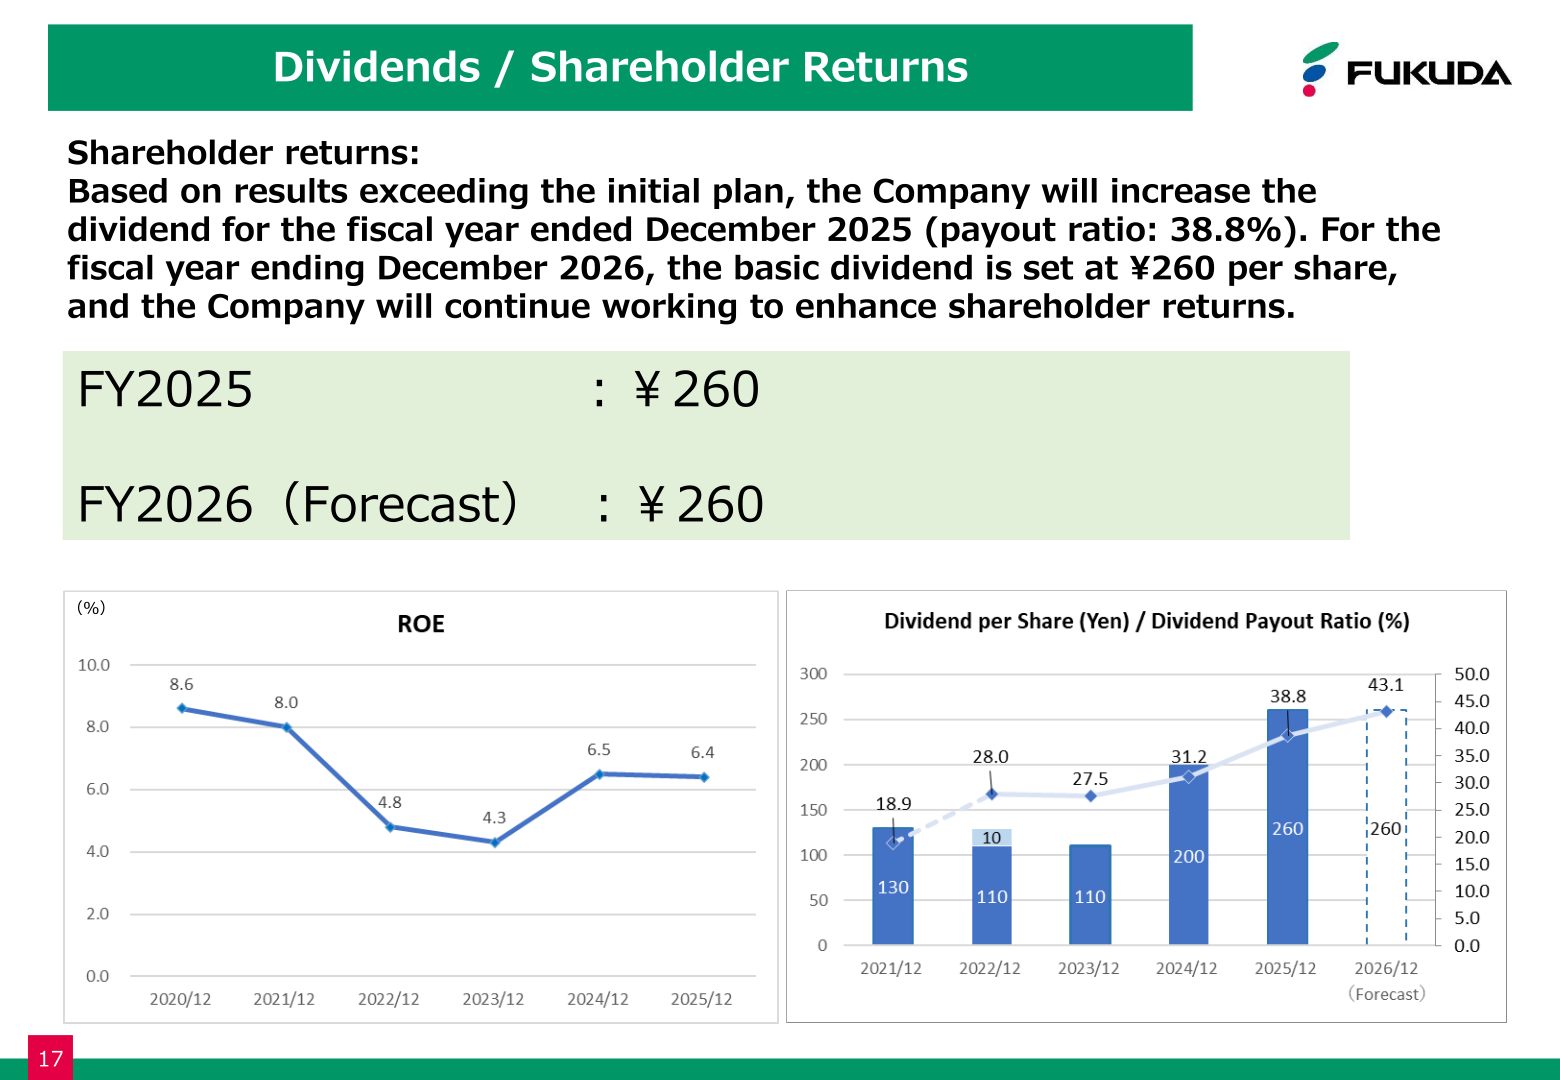
Based on results exceeding the initial plan, the Company will increase the dividend for the fiscal year ended December 2025 to ¥260 per share, a payout ratio of 38.8%. For the fiscal year ending December 2026, the basic dividend is set at ¥260 per share, and the Company states it will continue working to enhance shareholder returns.
Medium- to Long-Term Plan Review
Reviewing Medium-Term Management Plan 2025, the Company says it focused four years on strengthening business fundamentals, missed quantitative targets due to resource constraints, and that capital efficiency improvement remains a challenge, while it delivered active shareholder returns including dividend increases. A new Long-Term Vision and Medium-Term Plan were to be disclosed in mid-March 2026.
| Item | FY2023 (Actual) | FY2024 (Actual) | FY2025 (Actual) | FY2025 Mid-term Management Plan (Reference) |
|---|---|---|---|---|
| Net sales | 1,622 | 1,665 | 1,679 | 1,850 |
| Operating profit | 52 | 76 | 77 | 84 |
| Operating profit margin | 3.2% | 4.6% | 4.6% | 4.5% |
| Equity ratio | 58.2% | 59.3% | 60.9% | 50.0% |
| ROE | 4.3% | 6.5% | 6.4% | Approximately 8.0% |
| Dividend payout ratio | 27.5% | 31.2% | 38.8% | 20.0% or more |
| Capital investment (cumulative) | 12(31) | 17(49) | 16(65) | 75 |
Unit: JPY billion.
Company Overview
Fukuda Corporation is a general construction company (civil engineering and building construction) based in Niigata Prefecture with nationwide operations. The corporate group consists of Fukuda Corporation, 25 subsidiaries and 4 affiliated companies. The Company was founded in January 1902 and established in December 1927, with capital of ¥5.1 billion as of December 2025 and 2,226 consolidated employees as of December 31, 2025. It has been certified continuously as a “High-Performance Contractor” by MLIT since FY2014. In the FY2025 sales composition, Fukuda Corporation on a non-consolidated basis accounted for 55.3%, with subsidiaries (Fukuda road and related companies) performing steadily.
This article is an analysis based on publicly available information and is not a recommendation to buy or sell any specific securities. Investment decisions are your own responsibility.
















