
This article is based on publicly available IR materials and is not a recommendation to buy or sell any specific securities.
Note: Penta-Ocean Construction labels the year ended March 31, 2026 as “FY3/26” and the current year as “FY3/27”; this site classifies the year ended March 31, 2026 as FY2025, but every figure, table and label below follows the company’s own notation as presented in its supplementary document.
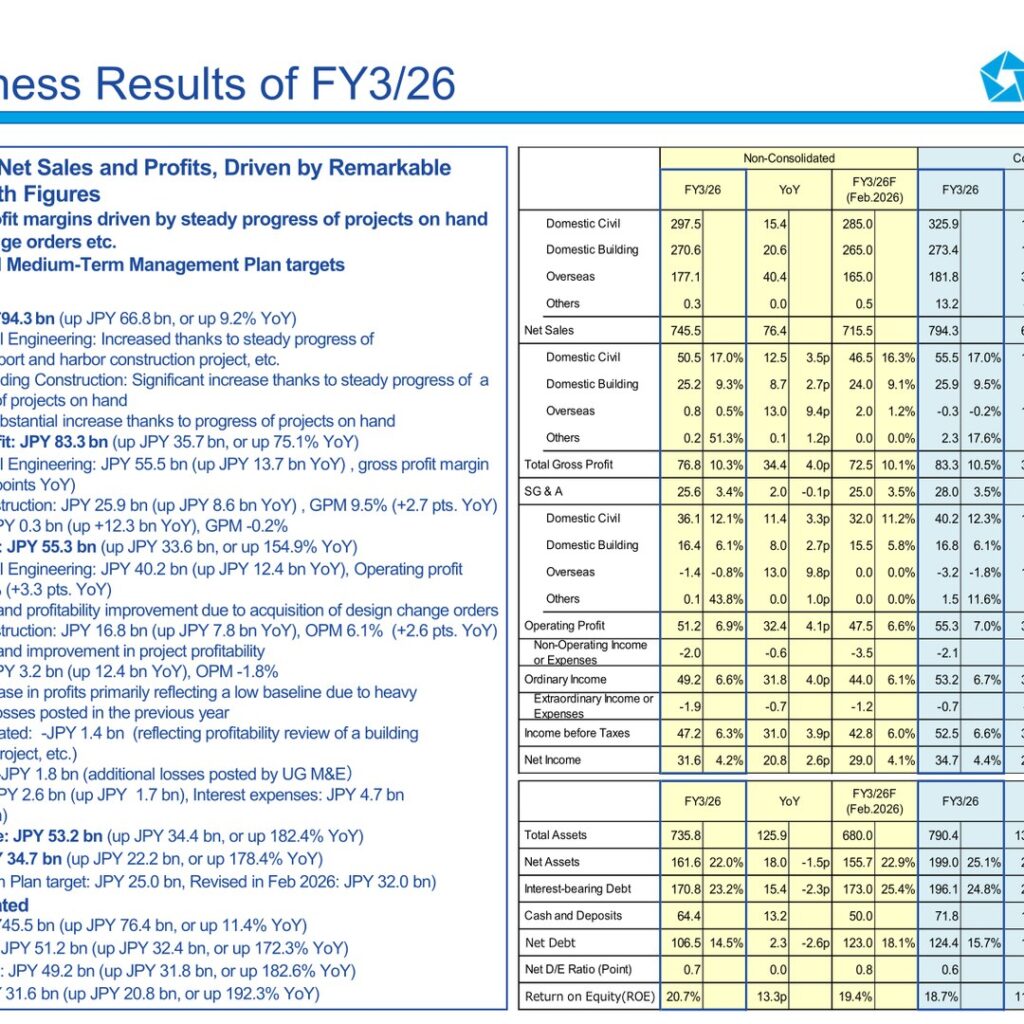
Penta-Ocean Construction posted record-high net sales and profits for FY3/26. Consolidated net sales rose to JPY 794.3 bn (up JPY 66.8 bn, or up 9.2% YoY), operating profit reached JPY 55.3 bn (up JPY 33.6 bn, or up 154.9% YoY) and net income came to JPY 34.7 bn (up JPY 22.2 bn, or up 178.4% YoY). The company describes the outcome as driven by improved profit margins on the steady progress of projects on hand and design change orders, and states that it surpassed its initial Medium-Term Management Plan targets. Non-consolidated orders received reached JPY 851.4 bn, strongly outperforming the previous record of JPY 716.5 bn set in the fiscal year ended March 2014.
Consolidated Results (Full-Year Actual)
Total gross profit expanded to JPY 83.3 bn (up JPY 35.7 bn, or up 75.1% YoY), lifting the gross profit margin to 10.5%. Ordinary income was JPY 53.2 bn (up JPY 34.4 bn, or up 182.4% YoY) and net income was JPY 34.7 bn, against an initial Mid-term Plan target of JPY 25.0 bn and a target of JPY 32.0 bn as revised in February 2026. On a non-consolidated basis, net sales were JPY 745.5 bn (up JPY 76.4 bn, or up 11.4% YoY), operating profit JPY 51.2 bn (up JPY 32.4 bn, or up 172.3% YoY), ordinary income JPY 49.2 bn (up JPY 31.8 bn, or up 182.6% YoY) and net income JPY 31.6 bn (up JPY 20.8 bn, or up 192.3% YoY). Non-operating items included a gain on foreign exchange of JPY 2.6 bn (up JPY 1.7 bn) and interest expenses of JPY 4.7 bn (up JPY 0.9 bn).
| Item (Consolidated, JPY bn) | FY3/26 | YoY Change | FY3/26 Forecast (Feb. 2026) |
|---|---|---|---|
| Net Sales | 794.3 | 66.8 | 759.0 |
| Total Gross Profit | 83.3 (10.5%) | 35.7 (4.0p) | 78.0 (10.3%) |
| SG & A | 28.0 (3.5%) | 2.1 (-0.1p) | 27.5 (3.6%) |
| Operating Profit | 55.3 (7.0%) | 33.6 (4.0p) | 50.5 (6.7%) |
| Non-Operating Income or Expenses | -2.1 | 0.8 | -3.0 |
| Ordinary Income | 53.2 (6.7%) | 34.4 (4.1p) | 47.5 (6.3%) |
| Extraordinary Income or Expenses | -0.7 | -1.1 | 0.0 |
| Income before Taxes | 52.5 (6.6%) | 33.2 (4.0p) | 47.5 (6.3%) |
| Net Income | 34.7 (4.4%) | 22.2 (2.7p) | 32.0 (4.2%) |
| Return on Equity (ROE) | 18.7% | 11.5p | 17.7% |
Segment Results
Domestic Civil Engineering was the main profit driver, with consolidated gross profit of JPY 55.5 bn (up JPY 13.7 bn YoY) at a gross profit margin of 17.0% (+3.4 points YoY) and operating profit of JPY 40.2 bn (up JPY 12.4 bn YoY) at an operating profit margin of 12.3% (+3.3 pts. YoY), which the company attributes to higher sales and profitability improvement from the acquisition of design change orders. Domestic Building Construction posted gross profit of JPY 25.9 bn (up JPY 8.6 bn YoY, GPM 9.5%) and operating profit of JPY 16.8 bn (up JPY 7.8 bn YoY, OPM 6.1%). Overseas remained in the red at -JPY 0.3 bn gross profit and -JPY 3.2 bn operating profit, though both improved sharply year on year (up JPY 12.3 bn and up JPY 12.4 bn respectively), primarily reflecting a low baseline due to heavy construction losses posted in the previous year; the segment’s operating loss comprised -JPY 1.4 bn on a non-consolidated basis and -JPY 1.8 bn at subsidiaries, where UG M&E posted additional losses.
| Segment (Consolidated, JPY bn) | Metric | FY3/26 | YoY Change |
|---|---|---|---|
| Domestic Civil Engineering | Net Sales | 325.9 | 18.6 |
| Domestic Civil Engineering | Total Gross Profit | 55.5 (17.0%) | 13.7 (3.4p) |
| Domestic Civil Engineering | Operating Profit | 40.2 (12.3%) | 12.4 (3.3p) |
| Domestic Building Construction | Net Sales | 273.4 | 18.9 |
| Domestic Building Construction | Total Gross Profit | 25.9 (9.5%) | 8.6 (2.7p) |
| Domestic Building Construction | Operating Profit | 16.8 (6.1%) | 7.8 (2.6p) |
| Overseas | Net Sales | 181.8 | 30.0 |
| Overseas | Total Gross Profit | -0.3 (-0.2%) | 12.3 (8.1p) |
| Overseas | Operating Profit | -3.2 (-1.8%) | 12.4 (8.5p) |
| Others | Net Sales | 13.2 | -0.7 |
| Others | Operating Profit | 1.5 (11.6%) | 1.0 (7.8p) |
| Total | Net Sales | 794.3 | 66.8 |
| Total | Total Gross Profit | 83.3 (10.5%) | 35.7 (4.0p) |
| Total | Operating Profit | 55.3 (7.0%) | 33.6 (4.0p) |
Orders Received (Non-Consolidated)
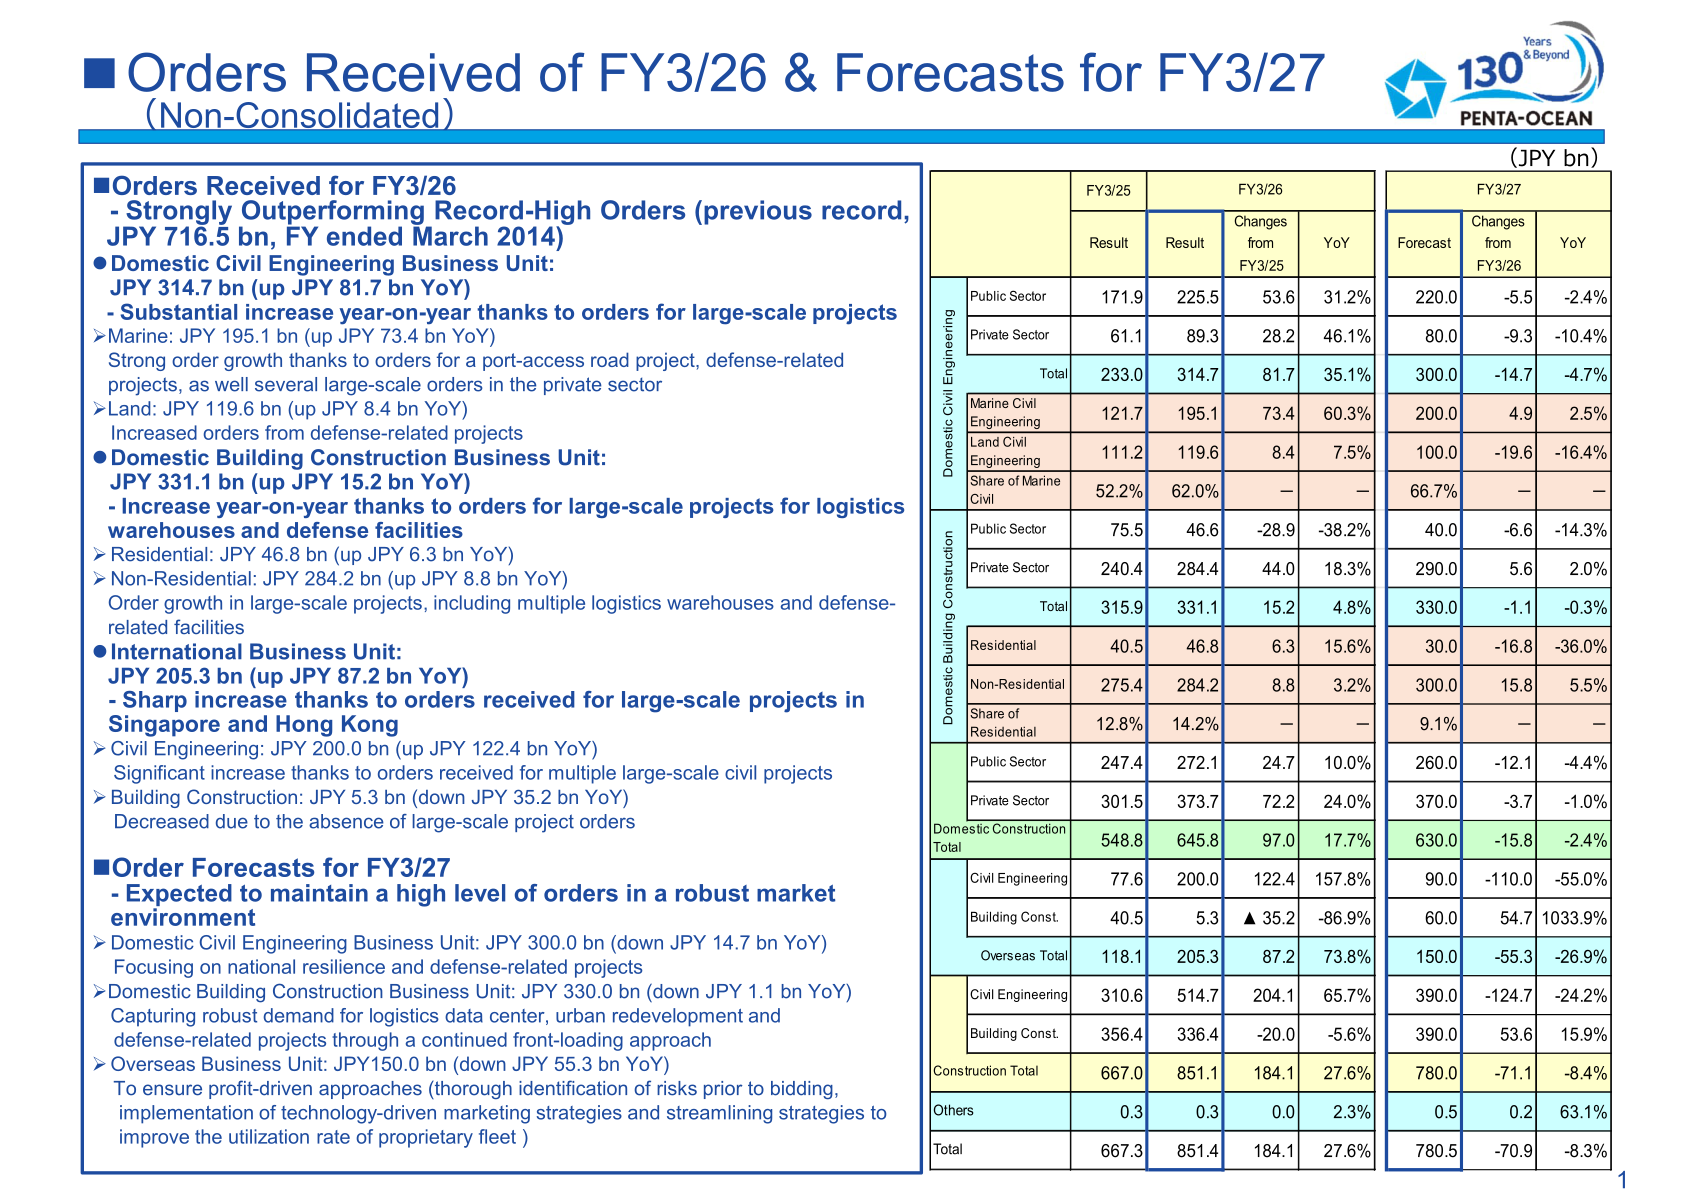
Non-consolidated orders received totalled JPY 851.4 bn (up JPY 184.1 bn, or up 27.6% YoY), strongly outperforming the previous record high of JPY 716.5 bn recorded in the fiscal year ended March 2014. Domestic Civil Engineering took JPY 314.7 bn (up JPY 81.7 bn YoY) on orders for a port-access road project, defense-related projects and several large-scale private-sector orders; Domestic Building Construction took JPY 331.1 bn (up JPY 15.2 bn YoY) on large-scale logistics warehouse and defense facility projects; and the International Business Unit took JPY 205.3 bn (up JPY 87.2 bn YoY) on large-scale projects in Singapore and Hong Kong. For FY3/27 the company expects to maintain a high level of orders in a robust market environment, guiding to JPY 300.0 bn for Domestic Civil Engineering, JPY 330.0 bn for Domestic Building Construction and JPY 150.0 bn for Overseas.
| Orders Received (Non-Consolidated, JPY bn) | FY3/25 | FY3/26 | FY3/27 Forecast |
|---|---|---|---|
| Domestic Civil Engineering — Total | 233.0 | 314.7 | 300.0 |
| Domestic Civil Engineering — Marine | 121.7 | 195.1 | 200.0 |
| Domestic Civil Engineering — Land | 111.2 | 119.6 | 100.0 |
| Domestic Building Construction — Total | 315.9 | 331.1 | 330.0 |
| Domestic Building Construction — Residential | 40.5 | 46.8 | 30.0 |
| Domestic Building Construction — Non-Residential | 275.4 | 284.2 | 300.0 |
| Overseas — Civil Engineering | 77.6 | 200.0 | 90.0 |
| Overseas — Building Construction | 40.5 | 5.3 | 60.0 |
| Overseas — Total | 118.1 | 205.3 | 150.0 |
| Construction Total | 667.0 | 851.1 | 780.0 |
| Total (incl. Others) | 667.3 | 851.4 | 780.5 |
FY3/27 Forecast
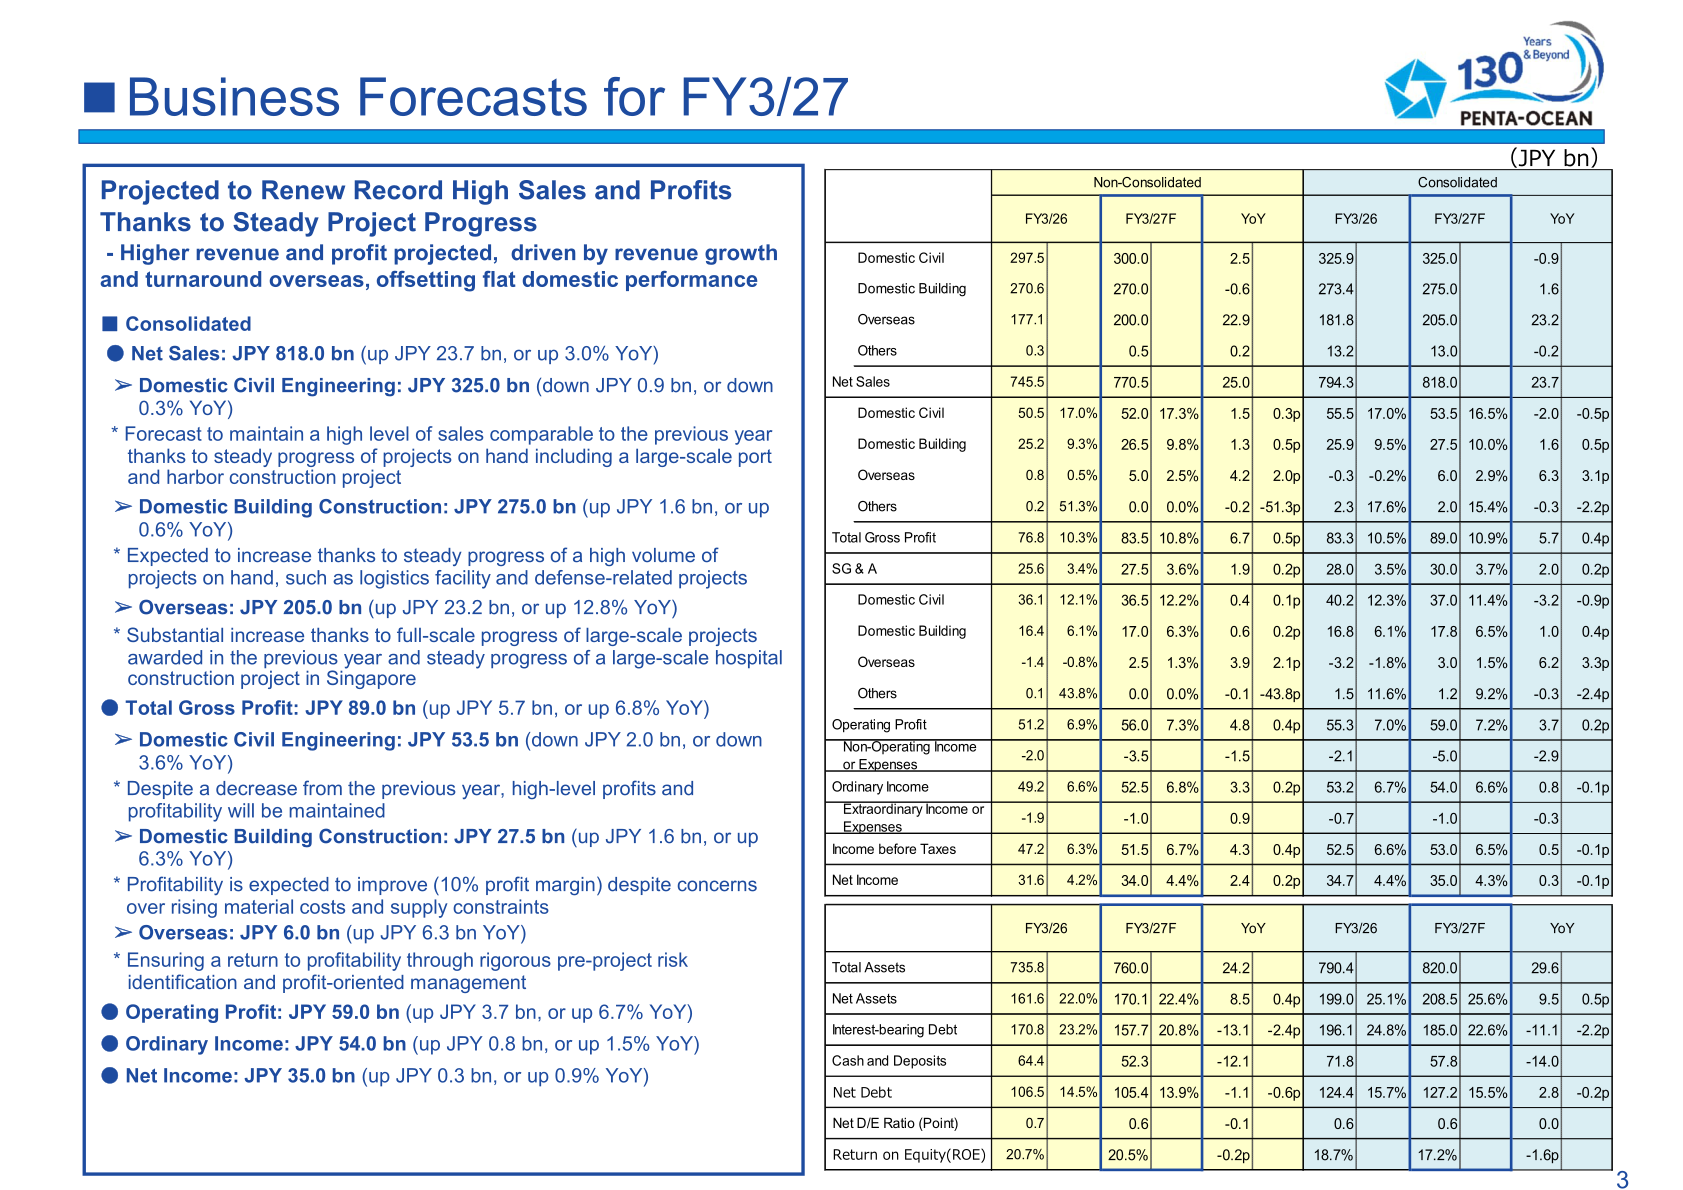
The company projects a further record year, with consolidated net sales of JPY 818.0 bn (up JPY 23.7 bn, or up 3.0% YoY), total gross profit of JPY 89.0 bn (up JPY 5.7 bn, or up 6.8% YoY), operating profit of JPY 59.0 bn (up JPY 3.7 bn, or up 6.7% YoY), ordinary income of JPY 54.0 bn (up JPY 0.8 bn, or up 1.5% YoY) and net income of JPY 35.0 bn (up JPY 0.3 bn, or up 0.9% YoY). Growth is expected to come from revenue expansion and a turnaround overseas, offsetting flat domestic performance: Overseas net sales are guided to JPY 205.0 bn (up JPY 23.2 bn, or up 12.8% YoY) with gross profit returning to JPY 6.0 bn, while Domestic Civil Engineering sales are seen at JPY 325.0 bn (down JPY 0.9 bn, or down 0.3% YoY) and Domestic Building Construction at JPY 275.0 bn (up JPY 1.6 bn, or up 0.6% YoY).
| Item (Consolidated, JPY bn) | FY3/26 | FY3/27 Forecast | YoY Change |
|---|---|---|---|
| Net Sales | 794.3 | 818.0 | 23.7 |
| — Domestic Civil Engineering | 325.9 | 325.0 | -0.9 |
| — Domestic Building Construction | 273.4 | 275.0 | 1.6 |
| — Overseas | 181.8 | 205.0 | 23.2 |
| — Others | 13.2 | 13.0 | -0.2 |
| Total Gross Profit | 83.3 (10.5%) | 89.0 (10.9%) | 5.7 (0.4p) |
| SG & A | 28.0 (3.5%) | 30.0 (3.7%) | 2.0 (0.2p) |
| Operating Profit | 55.3 (7.0%) | 59.0 (7.2%) | 3.7 (0.2p) |
| Ordinary Income | 53.2 (6.7%) | 54.0 (6.6%) | 0.8 (-0.1p) |
| Net Income | 34.7 (4.4%) | 35.0 (4.3%) | 0.3 (-0.1p) |
| Return on Equity (ROE) | 18.7% | 17.2% | -1.6p |
Shareholder Returns
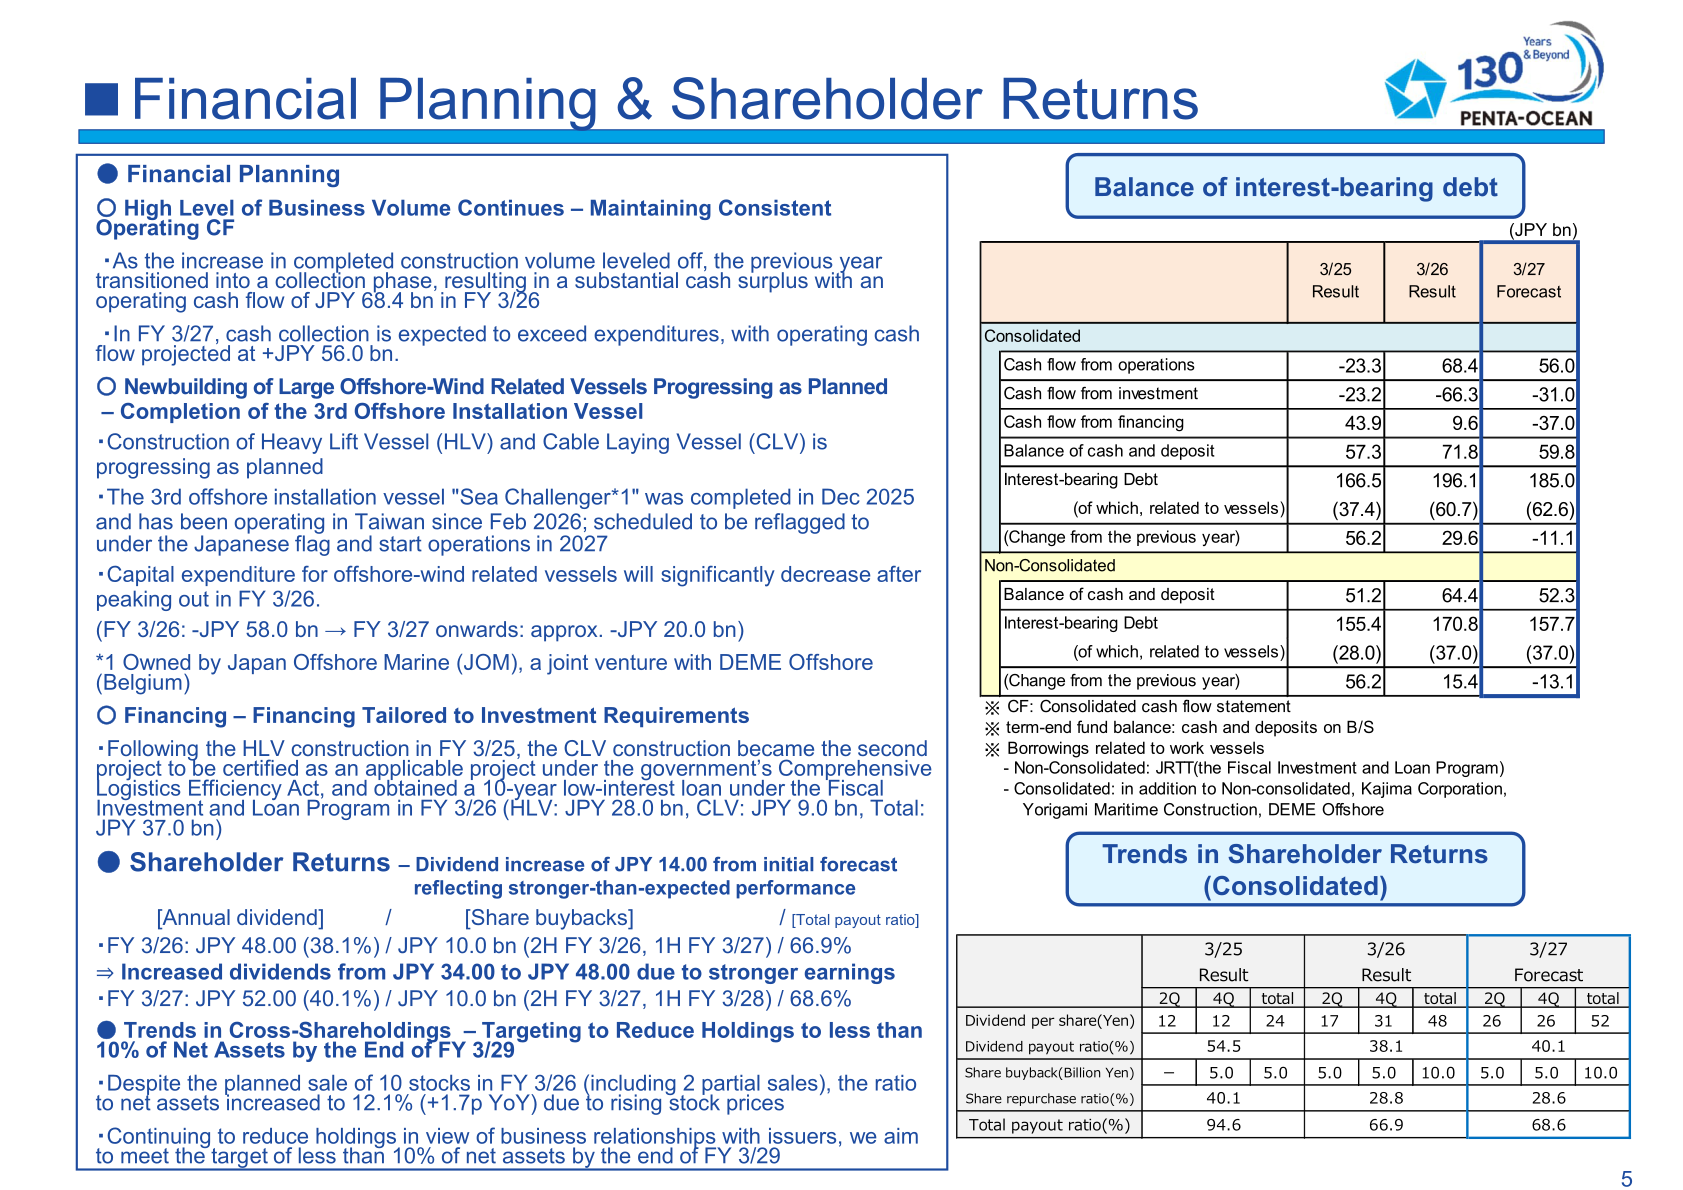
Reflecting stronger-than-expected performance, the annual dividend for FY3/26 was raised by JPY 14.00 from the initial forecast, from JPY 34.00 to JPY 48.00, giving a dividend payout ratio of 38.1%. Combined with share buybacks of JPY 10.0 bn (executed in 2H FY3/26 and 1H FY3/27), the total payout ratio was 66.9%. For FY3/27 the company plans an annual dividend of JPY 52.00 (40.1%) and share buybacks of JPY 10.0 bn (2H FY3/27 and 1H FY3/28), for a total payout ratio of 68.6%. On cross-shareholdings, the ratio to net assets rose to 12.1% (+1.7p YoY) because of rising stock prices despite the planned sale of 10 stocks in FY3/26 (including 2 partial sales); the company continues to target a reduction to less than 10% of net assets by the end of FY3/29.
| Shareholder Returns | FY3/25 (Result) | FY3/26 (Result) | FY3/27 (Forecast) |
|---|---|---|---|
| Dividend per share — 2Q (Yen) | 12 | 17 | 26 |
| Dividend per share — 4Q (Yen) | 12 | 31 | 26 |
| Dividend per share — Total (Yen) | 24 | 48 | 52 |
| Dividend payout ratio (%) | 54.5 | 38.1 | 40.1 |
| Share buyback (Billion Yen) | 5.0 | 10.0 | 10.0 |
| Share repurchase ratio (%) | 40.1 | 28.8 | 28.6 |
| Total payout ratio (%) | 94.6 | 66.9 | 68.6 |
Financial Position and Cash Flow
Consolidated total assets stood at JPY 790.4 bn (up JPY 130.3 bn) and net assets at JPY 199.0 bn (up JPY 26.9 bn), an equity-to-asset level of 25.1%. Interest-bearing debt was JPY 196.1 bn (up JPY 29.6 bn), of which JPY 60.7 bn related to vessels, and cash and deposits were JPY 71.8 bn, leaving net debt of JPY 124.4 bn and a net D/E ratio of 0.6. As the increase in completed construction volume levelled off and the year moved into a collection phase, consolidated cash flow from operations swung to +JPY 68.4 bn (from -JPY 23.3 bn in FY3/25), against investing cash flow of -JPY 66.3 bn and financing cash flow of +JPY 9.6 bn. For FY3/27 the company projects operating cash flow of +JPY 56.0 bn.
Medium-Term Plan / Topics
Penta-Ocean states that FY3/26 results surpassed its initial Medium-Term Management Plan targets, with net income of JPY 34.7 bn versus an initial plan target of JPY 25.0 bn. In offshore wind, all construction work for the Kitakyushu Hibikinada Offshore Wind Farm was completed and commercial operation started in March 2026; the project comprises 9.6 MW class wind turbines x 25 units for a total output of approximately 220 MW, described by the company as Japan’s largest offshore wind farm. The third offshore installation vessel, “Sea Challenger”, was completed in December 2025 and has been operating in Taiwan since February 2026, with reflagging to the Japanese flag and start of operations scheduled for 2027, while the Heavy Lift Vessel and Cable Laying Vessel are progressing as planned with completion scheduled for 2028. Capital expenditure for offshore-wind related vessels is expected to decrease significantly after peaking in FY3/26 (FY3/26: -JPY 58.0 bn, to approximately -JPY 20.0 bn from FY3/27 onwards). The CLV construction was certified under the government’s Comprehensive Logistics Efficiency Act and obtained a 10-year low-interest loan under the Fiscal Investment and Loan Program in FY3/26 (HLV: JPY 28.0 bn, CLV: JPY 9.0 bn, total: JPY 37.0 bn). The company also marked the 130th anniversary of its founding on April 10, 2026, under the message “The Era of New Challenges Continues”.
This article is an analysis based on publicly available information and is not a recommendation to buy or sell any specific securities. Investment decisions are your own responsibility.
![[Obayashi] Investors’ Guide 2026 — The Complete 24-Article Breakdown](https://japan-equity.com/wp-content/uploads/2026/07/hub_cover-1024x1024.png)
![[Obayashi] IR & SR Policy — Feeding Dialogue Back into Management](https://japan-equity.com/wp-content/uploads/2026/07/p32_sq-1024x1024.jpg)
![[Obayashi] Real Estate Development — 18.7% Margin, ¥287.7bn Unrealized Gains](https://japan-equity.com/wp-content/uploads/2026/07/p20_sq-1024x1024.jpg)
![[Obayashi] Domestic Civil Engineering — Resilience Spending Supports 9.6% Margin](https://japan-equity.com/wp-content/uploads/2026/07/p11_sq-1024x1024.jpg)
![[Obayashi] Share Price & External Ratings — vs TOPIX, ESG Index Inclusion](https://japan-equity.com/wp-content/uploads/2026/07/p40_sq-1024x1024.jpg)
![[Construction] ¥75.5tn Investment, Shrinking Workforce — Big-5 Market Share](https://japan-equity.com/wp-content/uploads/2026/07/p12_sq-1024x1024.jpg)



![[Obayashi] Capital Policy & Shareholder Returns — ROE 10%+, DOE ~5%, ¥100bn Buyback](https://japan-equity.com/wp-content/uploads/2026/07/p27_sq-1024x1024.jpg)
![[Obayashi] Reducing Cross-Shareholdings — ¥285.2bn Sold in Five Years](https://japan-equity.com/wp-content/uploads/2026/07/p29_sq-1024x1024.jpg)
![[Obayashi] ¥750bn Investment Plan — ¥300bn to Development, ¥190bn to Tech/DX](https://japan-equity.com/wp-content/uploads/2026/07/p30_sq-1024x1024.jpg)
![[Obayashi] MTP2022 KPIs — Operating Profit ~2x Target, ROE 14.4%](https://japan-equity.com/wp-content/uploads/2026/07/p25_sq-1024x1024.jpg)
![[Obayashi] Cash Allocation — ¥420bn Investment CF Over Five Years](https://japan-equity.com/wp-content/uploads/2026/07/p26_sq-1024x1024.jpg)
![[Obayashi] Green Energy — 44 Plants, 344MW, and the Green Hydrogen Challenge](https://japan-equity.com/wp-content/uploads/2026/07/p21_sq-1024x1024.jpg)
![[Obayashi] Tackling the Labor Shortage — Robotics Construction®](https://japan-equity.com/wp-content/uploads/2026/07/p14_sq-1024x1024.jpg)
