
This article is based on publicly available IR materials and is not a recommendation to buy or sell any specific securities.
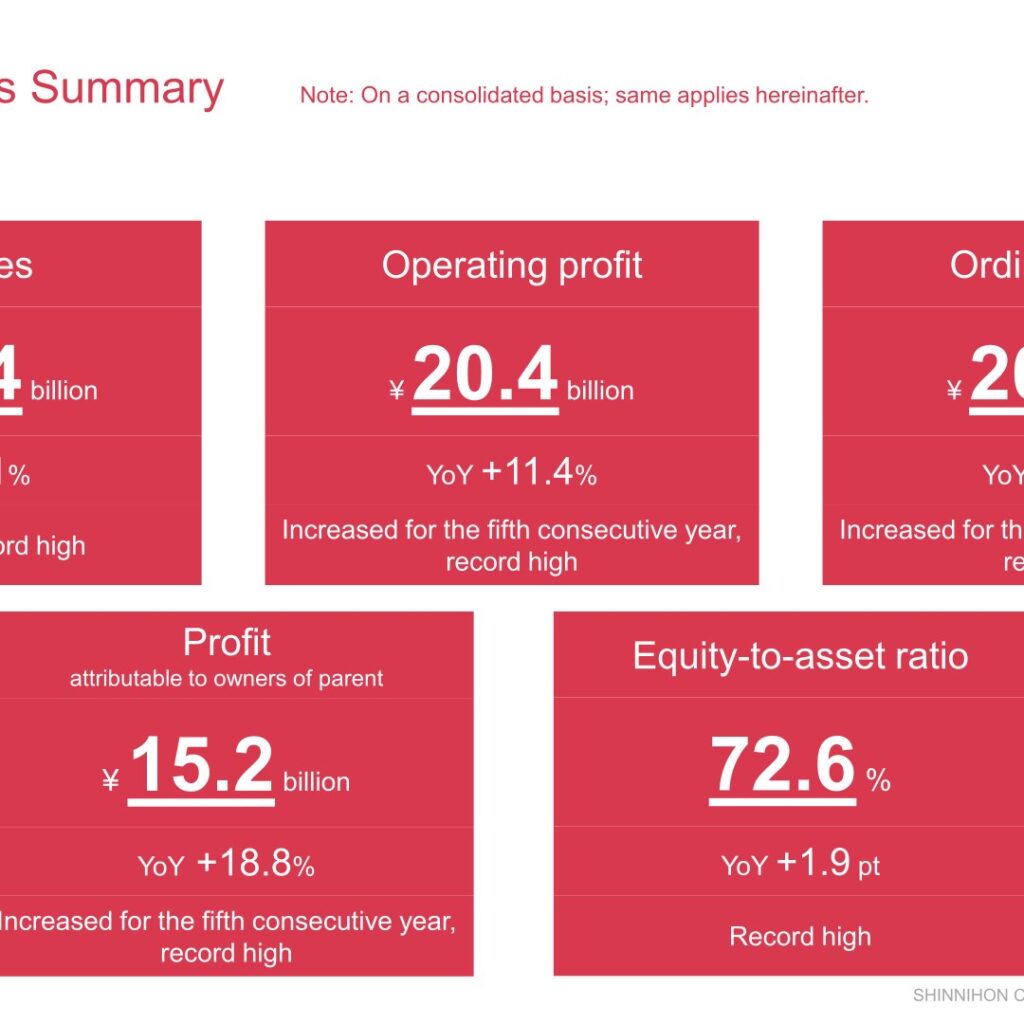
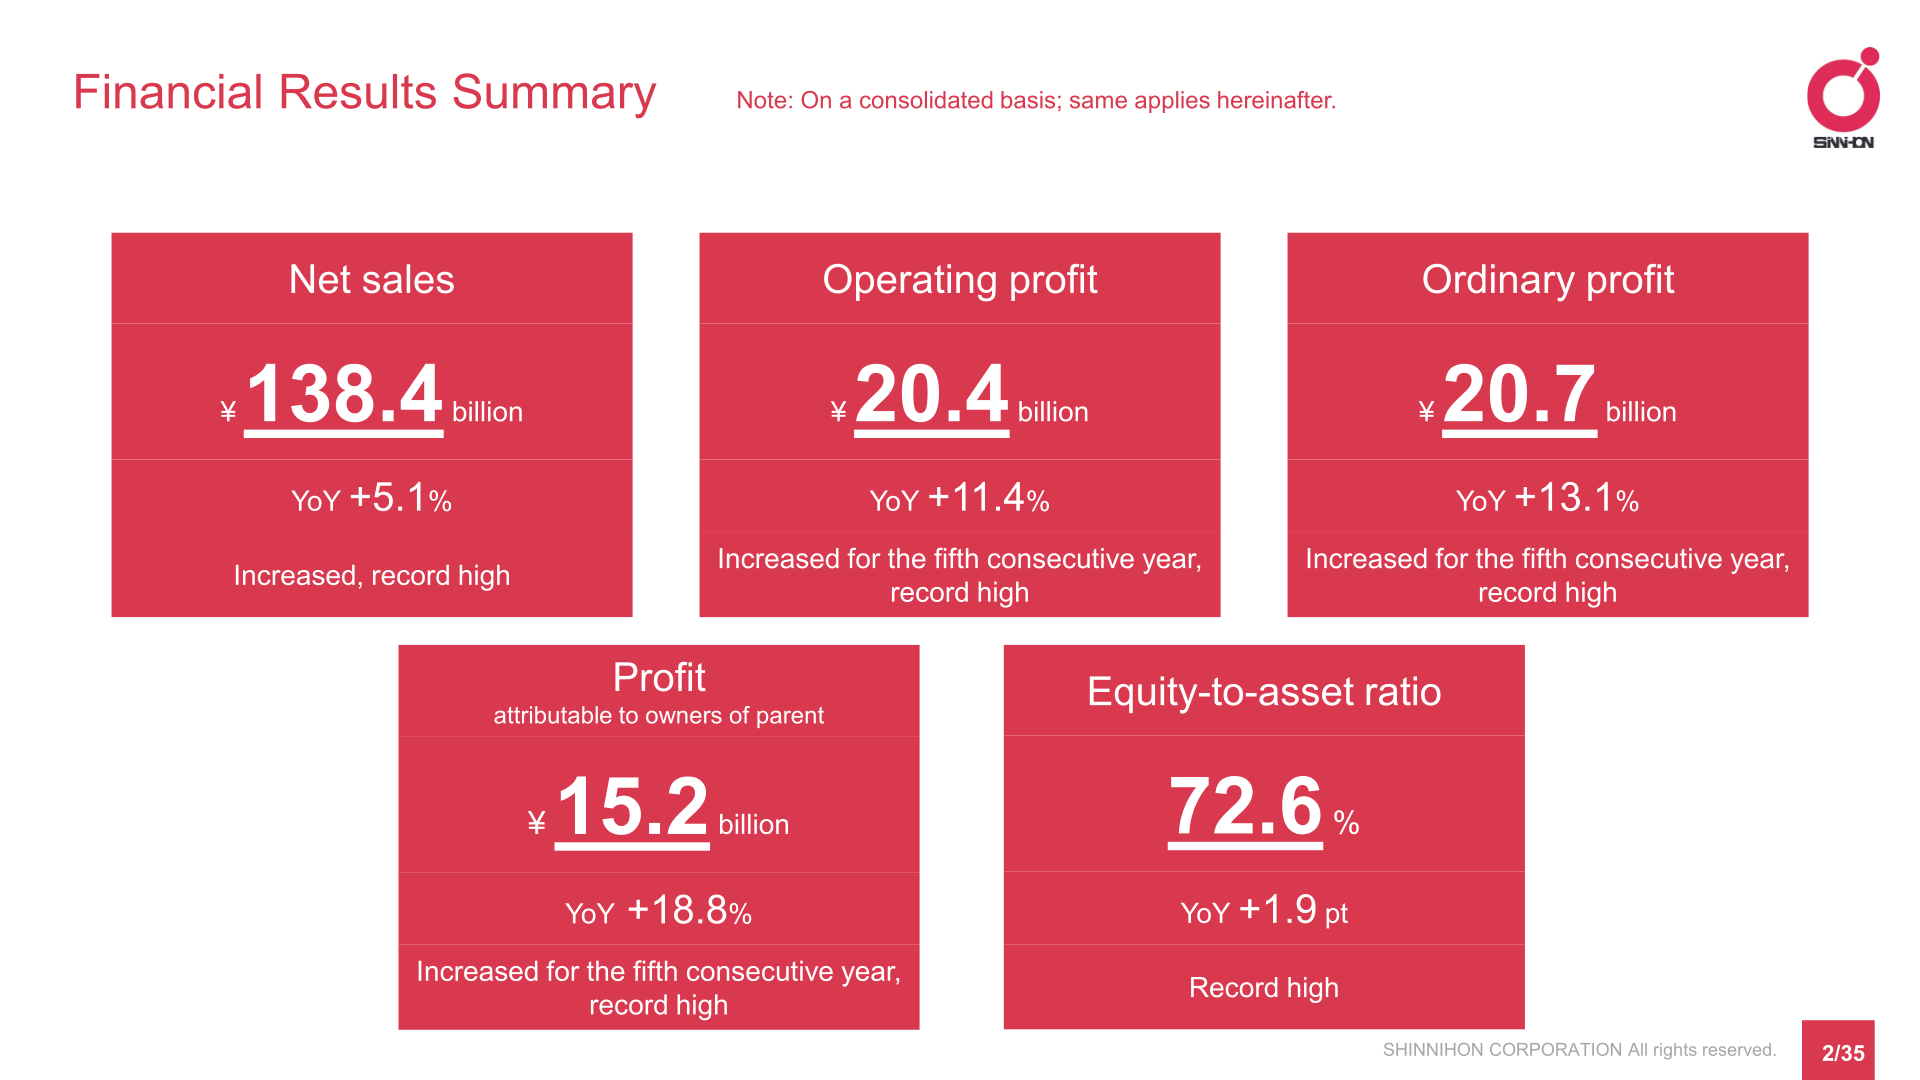
Note: the company labels this period as the fiscal year ended March 31, 2026 (“2026/3”); this site classifies the most recent completed fiscal year as FY2025, and all labels in the text, tables and segment data below follow the presentation. Shinnihon Corporation (TSE Prime Market, 1879), a Chiba-based general builder that also develops and sells its own condominiums, posted record highs across its main lines for the fiscal year ended March 31, 2026. Net sales rose 5.1% year on year to ¥138.4 billion, operating profit rose 11.4% to ¥20.4 billion, ordinary profit rose 13.1% to ¥20.7 billion and profit attributable to owners of parent rose 18.8% to ¥15.2 billion. Operating profit, ordinary profit and profit increased for the fifth consecutive year, and the equity-to-asset ratio reached a record high of 72.6%.
Consolidated Results (Full-Year Actual)
Net sales increased 5.1% year on year to ¥138,428 million and gross profit rose 8.8% to ¥25,616 million, lifting the gross profit ratio to 18.5% from 17.9%. The company describes the year as one in which sales increased and profit increased for the fifth consecutive year, with both reaching record highs. ROE was 11.9% and ROA was 11.6%, and the presentation notes that both remained stable above 10%.
| Item (millions of yen unless noted) | FY2025 (2026/3) | FY2024 (2025/3) | YoY |
|---|---|---|---|
| Net sales | 138,428 | 131,662 | +5.1% |
| Gross profit | 25,616 | 23,550 | +8.8% |
| Gross profit ratio | 18.5% | 17.9% | – |
| Operating profit | 20,405 | 18,310 | +11.4% |
| Operating profit margin | 14.7% | 13.9% | – |
| Ordinary profit | 20,771 | 18,369 | +13.1% |
| Profit attributable to owners of parent | 15,224 | 12,816 | +18.8% |
| Total assets | 185,296 | 172,954 | +12,341 |
| Net assets | 134,547 | 122,313 | +12,234 |
| Equity-to-asset ratio | 72.6% | 70.7% | +1.9 pt |
| ROE | 11.9% | 10.9% | – |
| ROA | 11.6% | 10.8% | – |
On the balance sheet, total assets increased ¥12.3 billion, liabilities increased ¥0.1 billion and net assets increased ¥12.2 billion, so the equity-to-asset ratio rose 1.9 percentage points to 72.6%. Cash and deposits increased ¥13.1 billion to ¥95,824 million from ¥82,653 million, inventories increased ¥4.4 billion, notes and accounts payable on construction contracts and other decreased ¥1.9 billion, and retained earnings increased ¥11.7 billion. Cash and cash equivalents ended the year at ¥54,824 million against ¥48,653 million at the beginning of the year, an increase of ¥6,170 million, with operating cash flow of ¥17,244 million, investing cash flow of -¥7,555 million and financing cash flow of -¥3,517 million. The company states it has had virtually no debt since the fiscal year ended March 31, 2016 and no year-end borrowings since the fiscal year ended March 31, 2019.
Segment Results
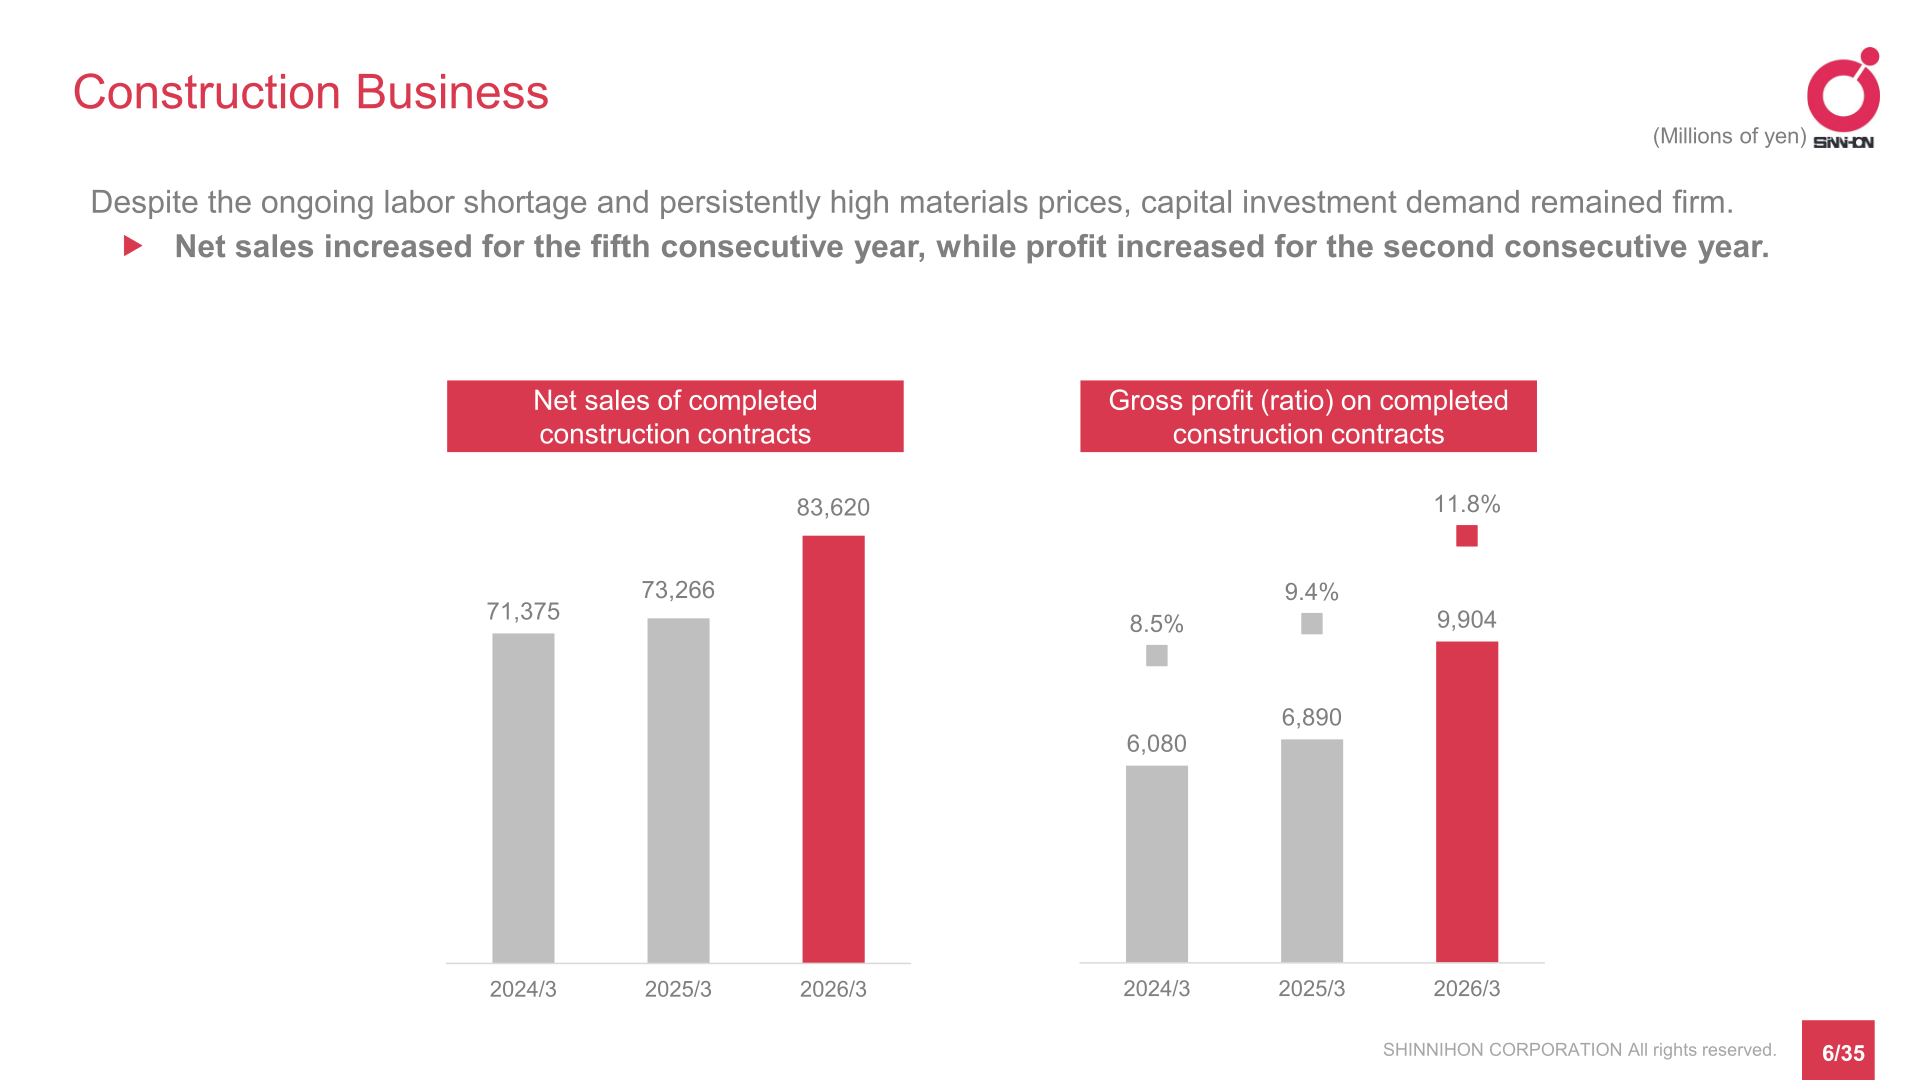
In the Construction Business, the company notes that capital investment demand remained firm despite the ongoing labor shortage and persistently high materials prices. Net sales of completed construction contracts rose to ¥83,620 million from ¥73,266 million, increasing for the fifth consecutive year, while gross profit on completed construction contracts rose to ¥9,904 million from ¥6,890 million and the gross profit ratio improved to 11.8% from 9.4%, increasing for the second consecutive year. In the Development Business and other, the presentation describes the condominium market in the Tokyo metropolitan area as remaining nearly steady, mainly the market for condominiums for the wealthy, amid a continuing decline in supply and rising sales prices. Net sales fell to ¥54,807 million from ¥58,395 million and gross profit fell to ¥15,711 million from ¥16,659 million due to a decline in the number of delivered properties, although the gross profit ratio edged up to 28.7% from 28.5%; the company expects both sales and profit in this business to increase in the next fiscal year.
| Segment | Metric (millions of yen unless noted) | FY2025 (2026/3) | FY2024 (2025/3) |
|---|---|---|---|
| Construction Business | Net sales of completed construction contracts | 83,620 | 73,266 |
| Construction Business | Gross profit on completed construction contracts | 9,904 | 6,890 |
| Construction Business | Gross profit ratio | 11.8% | 9.4% |
| Development Business, etc. | Net sales | 54,807 | 58,395 |
| Development Business, etc. | Gross profit | 15,711 | 16,659 |
| Development Business, etc. | Gross profit ratio | 28.7% | 28.5% |
Orders Received
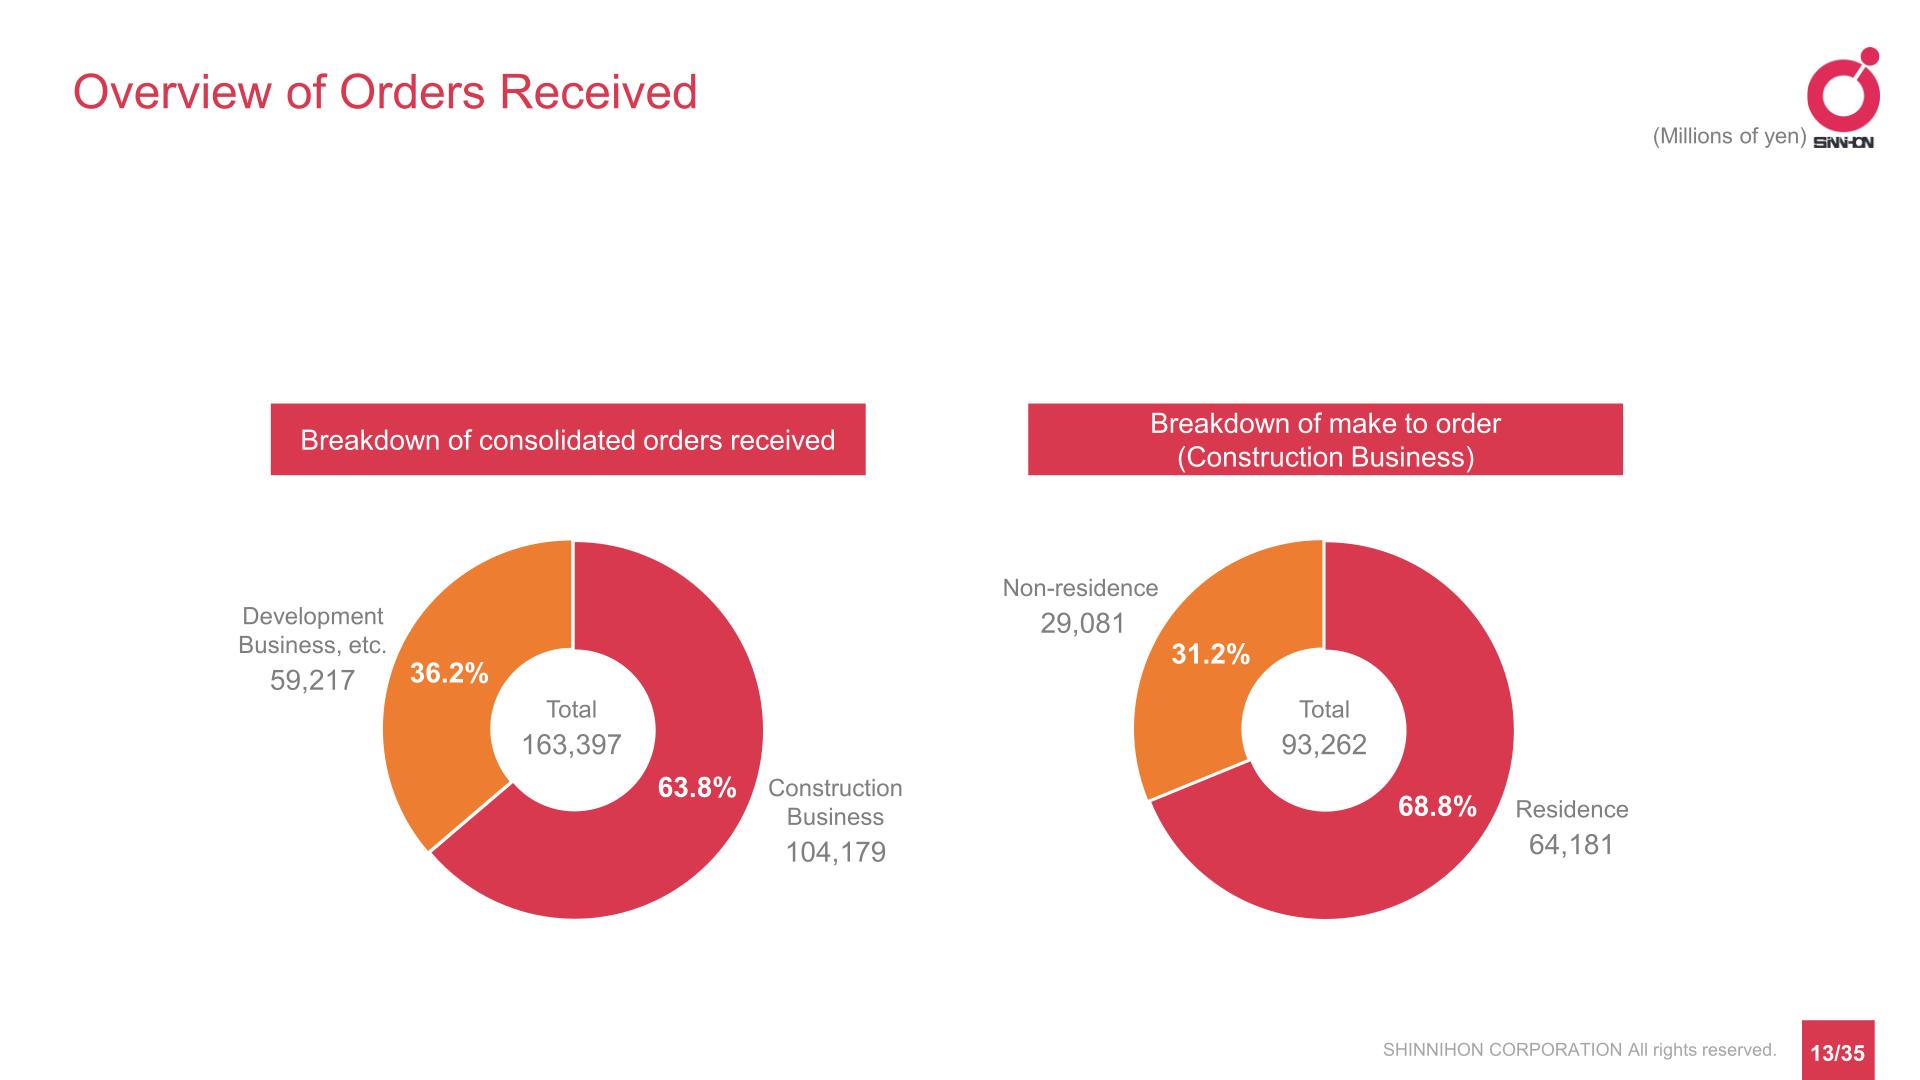
Consolidated orders received totalled ¥163,397 million, of which the Construction Business accounted for ¥104,179 million (63.8%) and the Development Business and other for ¥59,217 million (36.2%). Within the Construction Business, make-to-order work of ¥93,262 million split into residence at ¥64,181 million (68.8%) and non-residence at ¥29,081 million (31.2%). By area, the Construction Business make-to-order breakdown was Tokyo ¥46,268 million (49.6%), Kanagawa ¥25,928 million (27.8%), Chiba ¥10,762 million (11.5%), Saitama ¥10,181 million (10.9%) and Ibaraki ¥123 million (0.1%). Major orders included housing complexes at Chuo 2-chome in Ebina for Mitsubishi HC Capital Estate Plus Inc., Nakacho 2-chome in Koganei for Hankyu Hanshin Properties Corp. and Minamioi 2-chome in Ota-ku for NIPPON STEEL KOWA REAL ESTATE CO.,LTD. Condominium make-to-order of ¥50,705 million was split by area into Tokyo ¥22,590 million (44.6%), Chiba ¥13,856 million (27.3%), Kanagawa ¥7,848 million (15.5%) and Saitama ¥6,411 million (12.6%). The company supplied 1,107 condominium units in the fiscal year under review, against a Tokyo metropolitan area market in which the number of new condominiums supplied has decreased by approximately 77% from its peak in 2000.
| Orders received (millions of yen) | FY2025 (2026/3) | Share |
|---|---|---|
| Construction Business | 104,179 | 63.8% |
| Development Business, etc. | 59,217 | 36.2% |
| Total | 163,397 | – |
| Construction Business make to order: Residence | 64,181 | 68.8% |
| Construction Business make to order: Non-residence | 29,081 | 31.2% |
| Construction Business make to order: Total | 93,262 | – |
Next-Year Forecast (Fiscal Year Ending March 31, 2027)
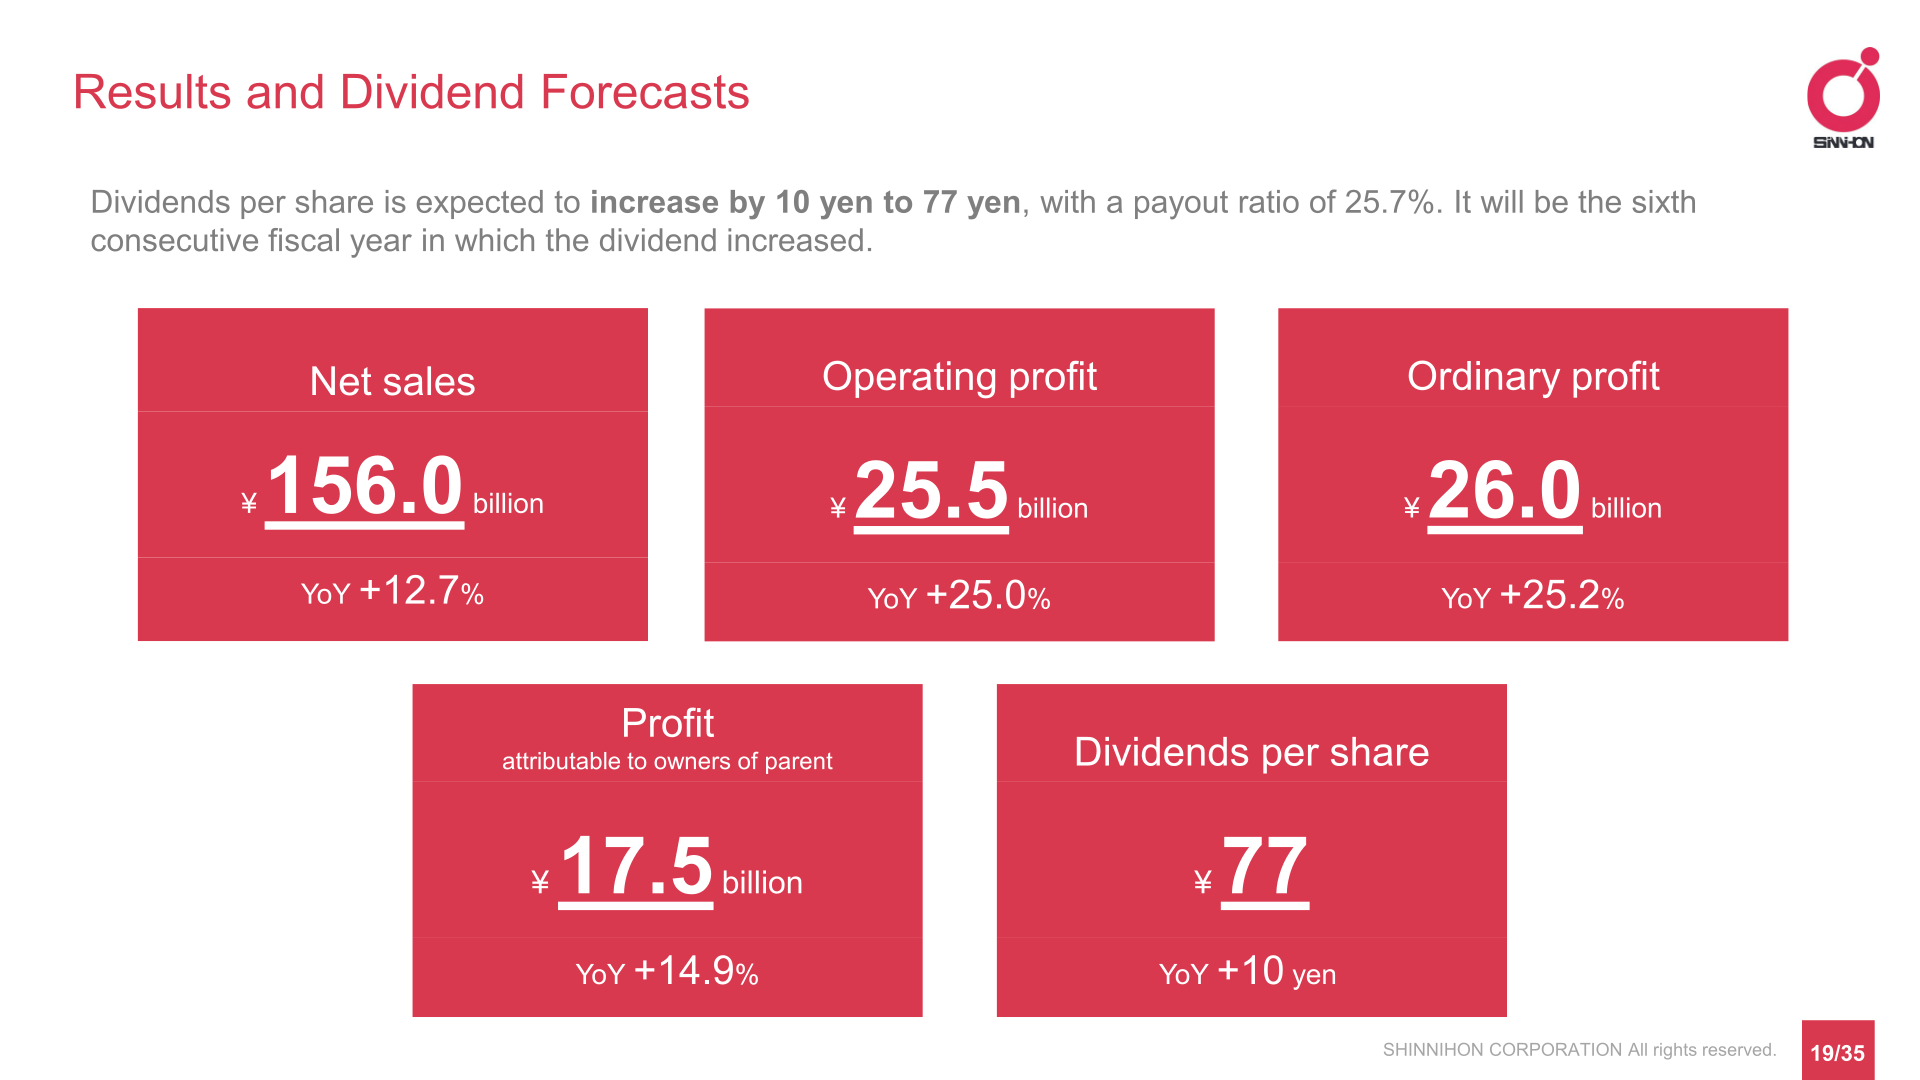
For the year ending March 2027 the company forecasts net sales of ¥156.0 billion, up 12.7%, operating profit of ¥25.5 billion, up 25.0%, ordinary profit of ¥26.0 billion, up 25.2%, and profit attributable to owners of parent of ¥17.5 billion, up 14.9%. The operating profit margin is projected at 16.3% against 14.7% in the year under review, and the ordinary profit ratio at 16.7% against 15.0%.
| Item (millions of yen unless noted) | Forecast (2027/3) | FY2025 (2026/3) Actual | YoY |
|---|---|---|---|
| Net sales | 156,000 | 138,428 | +12.7% |
| Operating profit | 25,500 | 20,405 | +25.0% |
| Operating profit margin | 16.3% | 14.7% | – |
| Ordinary profit | 26,000 | 20,771 | +25.2% |
| Profit attributable to owners of parent | 17,500 | 15,224 | +14.9% |
| Dividends per share (yen) | 77 | 67 | +10 yen |
Shareholder Returns
The company’s basic policy is to provide stable dividends, taking into account the risks involved in the development business and the optimal balance between growth investments and shareholder returns. In light of the results for the year under review, the dividend was increased by 11 yen to 67 yen per share, the fifth consecutive fiscal year of increase, with a payout ratio of 25.7% against 25.6% in the previous year and 25.2% two years ago (dividends per share of 56 yen and 53 yen respectively). For the year ending March 2027, dividends per share are expected to increase by 10 yen to 77 yen with a payout ratio of 25.7%, which would be the sixth consecutive fiscal year of increase.
Business Model and Topics
Shinnihon describes itself as a general builder that functions as a developer, producing synergy from the coordination of its two businesses through an integrated in-house construction and sales system covering land procurement, planning, design, construction, sales, after-sales service and management. It mainly sells medium-sized condominiums near stations, typically within a seven-minute walk of the nearest station and comprising around 30 to 100 residential units, and cites a track record of selling more than 15,000 units in 313 buildings. The presentation lists zero year-end borrowings, an equity-to-asset ratio of 72.6% and a JCR rating of A- with a Positive outlook, upgraded from Stable. On human capital, the non-consolidated number of employees was 539 and the average annual salary was 8,879 thousand yen, against 519 employees and 8,361 thousand yen a year earlier.
Topics disclosed alongside the results include Excellent City Motosumiyoshi The Residence, now on sale and to be delivered in March 2027, and full entry into the condominiums for senior citizens business in Funabashi City with ownership-type senior residences to be delivered in September 2027. The company also reported that Chairman Kanetsuna personally donated 1.5 billion yen and that the Shinnichi Ikuei Scholarship Foundation donated shares of the company it held valued at 3.0 billion yen, with Chiba City establishing a fund to support children and young people from disadvantaged family backgrounds. In the 2025 ranking of condominiums in the Tokyo metropolitan area cited from MARKET REPORT 2025-2026 by Mercury Inc., the company ranked 5th as a business owner, 4th as a sales company and 2nd as a construction company, while subsidiary Shinnihon Community ranked 8th in the management company category.
This article is an analysis based on publicly available information and is not a recommendation to buy or sell any specific securities. Investment decisions are your own responsibility.
















