
This article is based on publicly available IR materials and is not a recommendation to buy or sell any specific securities.
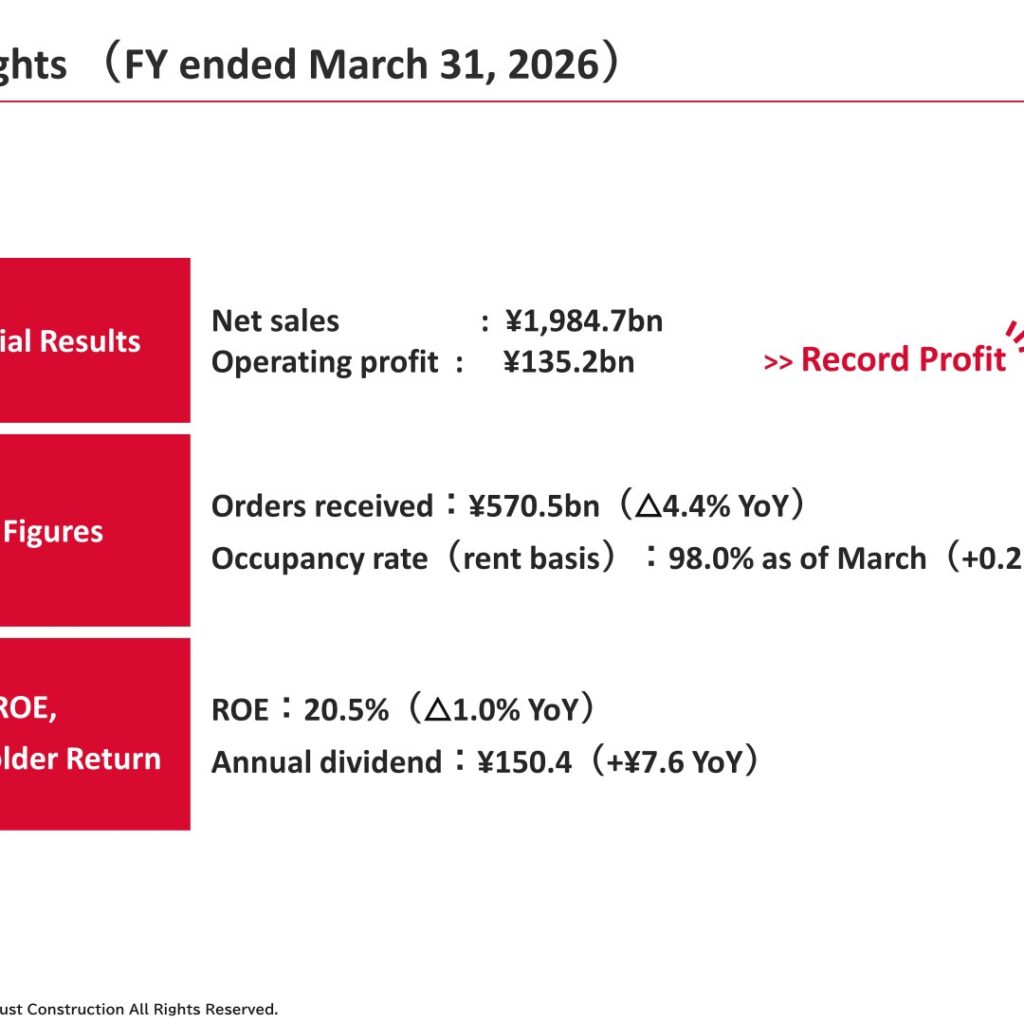
Daito Trust Construction reported record profit for the fiscal year ended March 31, 2026 (referred to as FY26/3 in the presentation), with net sales of ¥1,984.7bn (+7.7% YoY), operating profit of ¥135.2bn (+13.8% YoY), ordinary profit of ¥139.1bn (+7.5% YoY) and profit attributable to owners of parent of ¥99.0bn (+5.5% YoY). The Real estate development business was the main driver, with net sales up 186.5% YoY and operating profit up 259.8% YoY, while the Real estate leasing business grew operating profit 6.5% YoY on a rent-based occupancy rate of 98.0%. Orders received declined 4.4% YoY to ¥570.5bn as a lower number of projects outweighed a higher per-project price. For the fiscal year ending March 31, 2027 the Company plans net sales of ¥2,050.0bn and operating profit of ¥142.0bn, and raised the annual dividend plan to ¥163 per share.
Consolidated Results (Full-Year Actual)
The presentation headlines the year as a record profit, with net sales, operating profit, ordinary profit and profit attributable to owners of parent all higher than the prior year. Operating profit rose ¥16.4bn YoY: gross profit gains of ¥20.5bn from Real estate development, ¥7.8bn from Real estate leasing, ¥1.4bn from Other businesses and ¥1.3bn from Construction were partly offset by a ¥14.8bn increase in SG&A expenses. Against the Company’s initial plan, operating profit came in ¥10.2bn higher. ROE was 20.5%, down 1.0% YoY.
| Item | FY26/3 | FY25/3 | Change |
|---|---|---|---|
| Net sales | ¥1,984.7bn | ¥1,842.3bn | +7.7% |
| Operating profit | ¥135.2bn | ¥118.8bn | +13.8% |
| Ordinary profit | ¥139.1bn | ¥129.4bn | +7.5% |
| Profit attributable to owners of parent | ¥99.0bn | ¥93.8bn | +5.5% |
| SG&A expenses | ¥211.7bn | ¥196.9bn | +7.5% |
| SG&A expenses ratio | 10.7% | 10.7% | ±0.0p |
| Orders received | ¥570.5bn | ¥596.9bn | △4.4% |
| Rent-based occupancy rate (residential use) | 98.0% | 97.8% | +0.2p |
| ROE | 20.5% | — | △1.0% |
| Total assets | ¥1,367.5bn | ¥1,221.9bn | +¥145.6bn |
| Net assets | ¥496.6bn | ¥467.4bn | +¥29.2bn |
| Equity ratio | 36.5% | 38.4% | — |
| BPS | ¥1,534.24 | ¥1,414.63 | — |
| EPS | ¥299.01 | ¥285.66 | — |
| Annual dividend per share | ¥150.4 | ¥142.8 | +¥7.6 |
On the cash flow statement, cash and cash equivalents rose from ¥223.5bn at the beginning of the year to ¥258.1bn at the end. Operating activities provided ¥40.4bn, including profit before income taxes of ¥138.5bn, depreciation of ¥19.4bn, corporate tax payments of △¥45.5bn and an increase in real estate for sale of △¥80.9bn. Investing activities used ¥41.7bn, mainly for acquisition of intangible fixed assets of △¥30.7bn. Financing activities provided ¥37.2bn, with proceeds from long-term borrowings of +¥106.3bn against payment of dividends of △¥51.2bn and acquisition and disposal of treasury stock of △¥22.0bn.
Segment Results
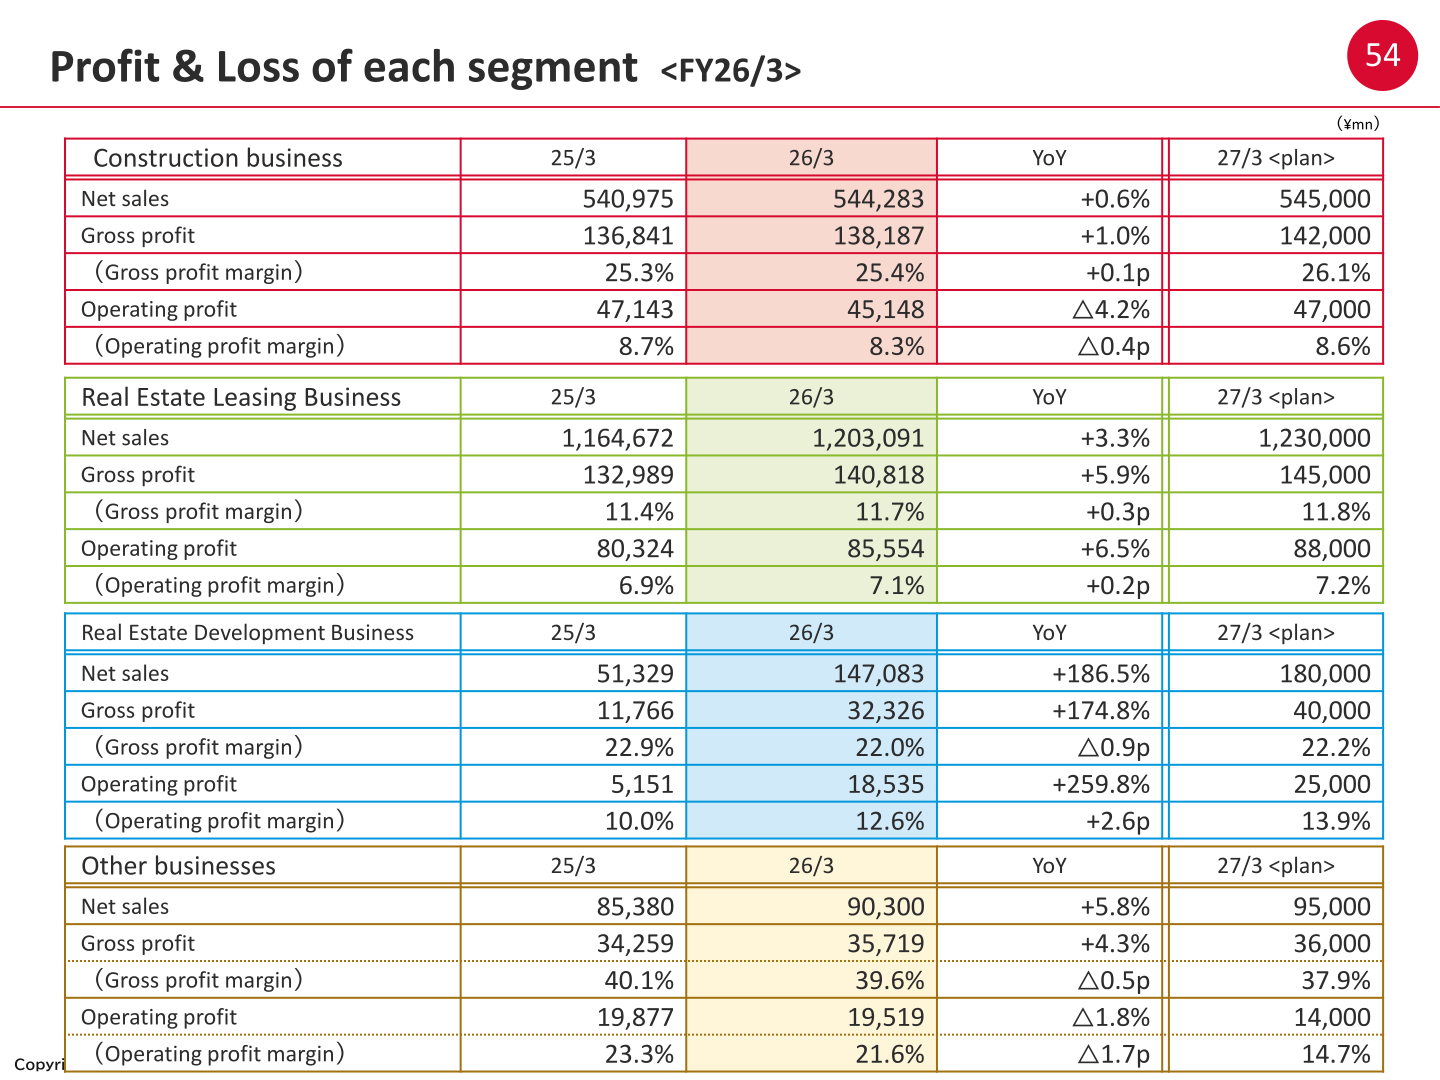
Real estate leasing remains the largest business by net sales at ¥1,203,091mn, with operating profit of ¥85,554mn. Construction net sales edged up 0.6% YoY to ¥544,283mn and the gross profit margin improved 0.1p to 25.4% — price revisions added 2.7p, offset by material cost (△1.1p), imported materials (△0.5p) and labour cost (△0.1p) — but operating profit fell 4.2% YoY to ¥45,148mn. Real estate development expanded sharply, with net sales of ¥147,083mn and operating profit of ¥18,535mn. Other businesses saw net sales rise but operating profit slip 1.8% YoY.
| Segment | Metric | FY26/3 | FY25/3 | FY27/3 (plan) |
|---|---|---|---|---|
| Construction business | Net sales (¥mn) | 544,283 | 540,975 | 545,000 |
| Construction business | Gross profit (¥mn) | 138,187 | 136,841 | 142,000 |
| Construction business | Gross profit margin | 25.4% | 25.3% | 26.1% |
| Construction business | Operating profit (¥mn) | 45,148 | 47,143 | 47,000 |
| Construction business | Operating profit margin | 8.3% | 8.7% | 8.6% |
| Real Estate Leasing Business | Net sales (¥mn) | 1,203,091 | 1,164,672 | 1,230,000 |
| Real Estate Leasing Business | Gross profit (¥mn) | 140,818 | 132,989 | 145,000 |
| Real Estate Leasing Business | Gross profit margin | 11.7% | 11.4% | 11.8% |
| Real Estate Leasing Business | Operating profit (¥mn) | 85,554 | 80,324 | 88,000 |
| Real Estate Leasing Business | Operating profit margin | 7.1% | 6.9% | 7.2% |
| Real Estate Development Business | Net sales (¥mn) | 147,083 | 51,329 | 180,000 |
| Real Estate Development Business | Gross profit (¥mn) | 32,326 | 11,766 | 40,000 |
| Real Estate Development Business | Gross profit margin | 22.0% | 22.9% | 22.2% |
| Real Estate Development Business | Operating profit (¥mn) | 18,535 | 5,151 | 25,000 |
| Real Estate Development Business | Operating profit margin | 12.6% | 10.0% | 13.9% |
| Other businesses | Net sales (¥mn) | 90,300 | 85,380 | 95,000 |
| Other businesses | Gross profit (¥mn) | 35,719 | 34,259 | 36,000 |
| Other businesses | Gross profit margin | 39.6% | 40.1% | 37.9% |
| Other businesses | Operating profit (¥mn) | 19,519 | 19,877 | 14,000 |
| Other businesses | Operating profit margin | 21.6% | 23.3% | 14.7% |
Key Operating Indicators
Orders received fell 4.4% YoY to ¥570.5bn and orders in hand fell 2.3% YoY to ¥783.6bn. The Company attributes the decline to a lower number of orders (4,284 to 3,641 projects, △¥85.5bn) and lower building & repairs (△¥6.4bn), partly offset by a higher per-project price (¥140.9mn to ¥157.1mn, +¥59.0bn) and a lower cancellation ratio (12.7% to 12.3%, +¥6.5bn). Separately, real estate sales of rental housing under the build-and-sell development model rose 124.1% YoY to ¥78.0bn. The mid-rise ratio improved 2.7p to 22.6% and the total rebuild ratio improved 0.5p to 37.0%. Sales representatives in the construction business numbered 2,940 (△30 YoY), with orders received per representative of ¥16.17mn per month.
On the leasing side, the number of tenancy recruitments was 345,229 in total (+0.1% YoY), comprising 343,368 residential (+0.1% YoY) and 1,861 commercial (△3.2% YoY). The rent-based occupancy rate was 98.0% for residential use (+0.2p YoY) and 99.4% for commercial use (±0.0p YoY). Units under management reached 1,317 thousand for residential use with monthly average aggregate rent of ¥84.6bn, and 33.5 thousand for commercial use with ¥6.1bn. The balance of real estate investment rose ¥82.9bn YoY to ¥279.5bn, or 142% of the prior-year level. Cumulative ZEH rental housing sales reached 157,258 units, of which 102,457 units had been completed.
FY2026 Forecast
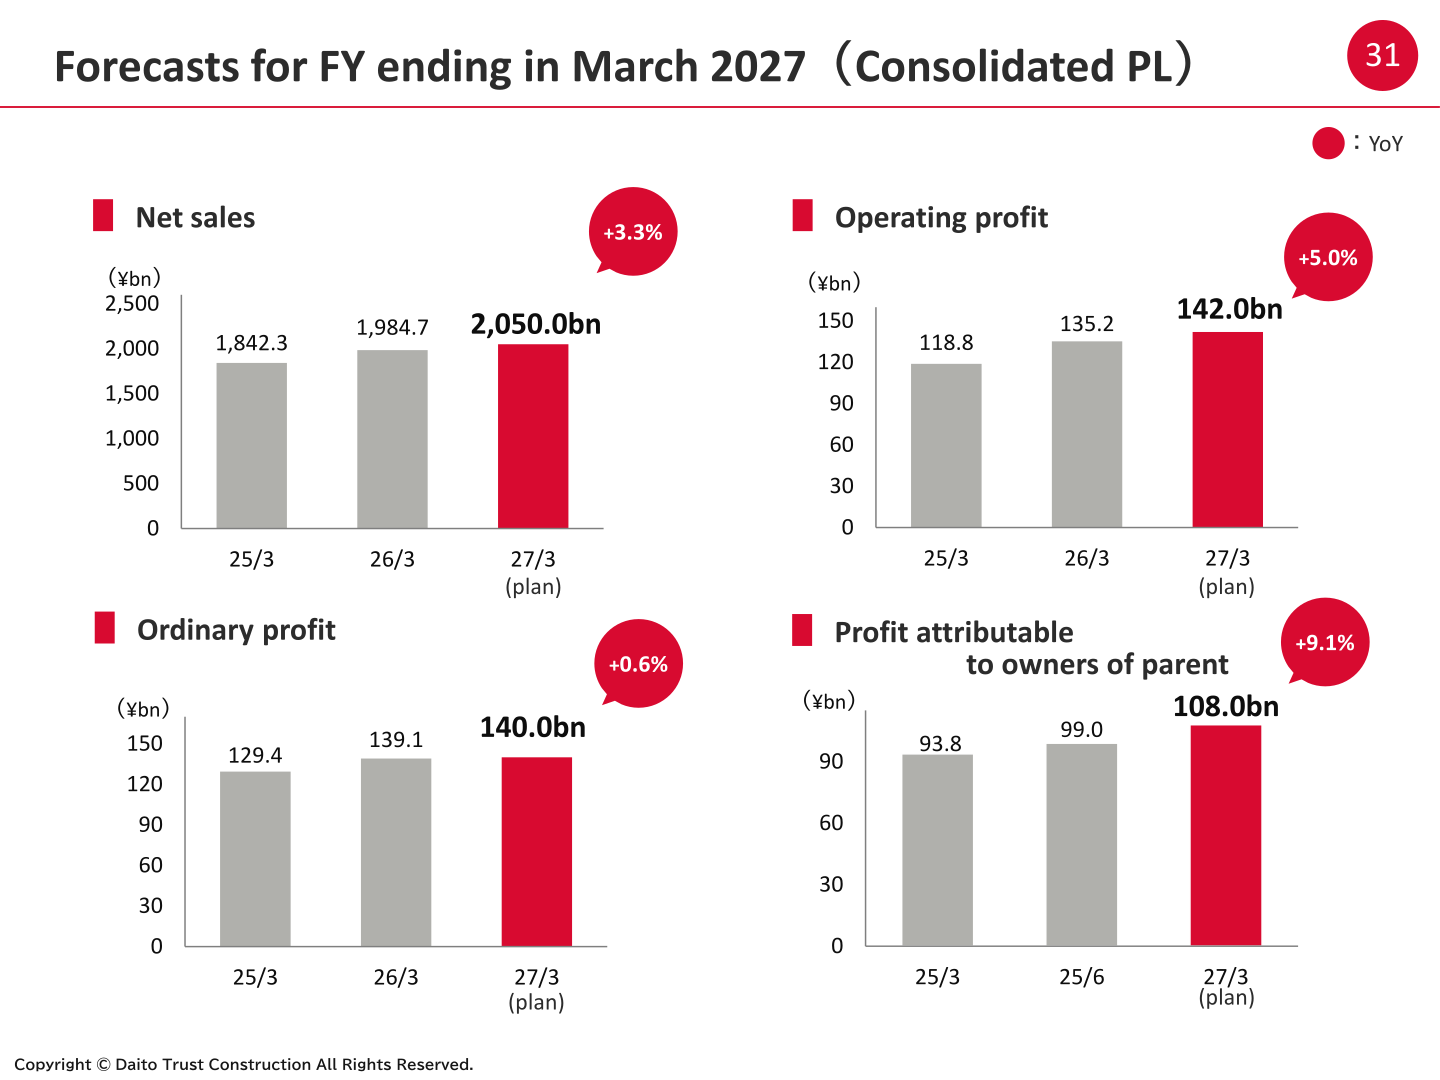
For the fiscal year ending March 31, 2027 the Company plans net sales of ¥2,050.0bn (+3.3% YoY), operating profit of ¥142.0bn (+5.0% YoY), ordinary profit of ¥140.0bn (+0.6% YoY) and profit attributable to owners of parent of ¥108.0bn (+9.1% YoY). Construction completion net sales are planned at ¥545.0bn with the gross profit margin improving 0.7p to 26.1%, as a price revision effect of +2.5p offsets labour cost (△0.9p) and material cost (△0.9p). The rental housing sales plan totals ¥680.0bn, split between construction orders of ¥580.0bn (+1.7% YoY) and real estate sales of ¥100.0bn (+28.2% YoY). Tenancy recruitment is planned at 349,600 in total (+1.3% YoY), comprising 347,700 residential (+1.3% YoY) and 1,900 commercial (+2.1% YoY), with occupancy rates of 97.6% and 99.3% respectively. The impact of the tender offer for THE Global Co., Ltd. is not yet reflected in these forecasts.
| Item | FY27/3 (plan) | FY26/3 (Actual) | YoY |
|---|---|---|---|
| Net sales | ¥2,050.0bn | ¥1,984.7bn | +3.3% |
| Operating profit | ¥142.0bn | ¥135.2bn | +5.0% |
| Ordinary profit | ¥140.0bn | ¥139.1bn | +0.6% |
| Profit attributable to owners of parent | ¥108.0bn | ¥99.0bn | +9.1% |
| Construction net sales (completion) | ¥545.0bn | ¥544.2bn | +0.1% |
| Construction gross profit | ¥142.0bn | ¥138.1bn | +2.8% |
| Construction gross profit margin | 26.1% | 25.4% | +0.7p |
| Rental housing sales plan (total) | ¥680.0bn | ¥648.5bn | — |
| — Construction orders | ¥580.0bn | ¥570.5bn | +1.7% |
| — Real estate sales | ¥100.0bn | ¥78.0bn | +28.2% |
| Number of tenancy recruitment | 349,600 | 345,229 | +1.3% |
Shareholder Returns
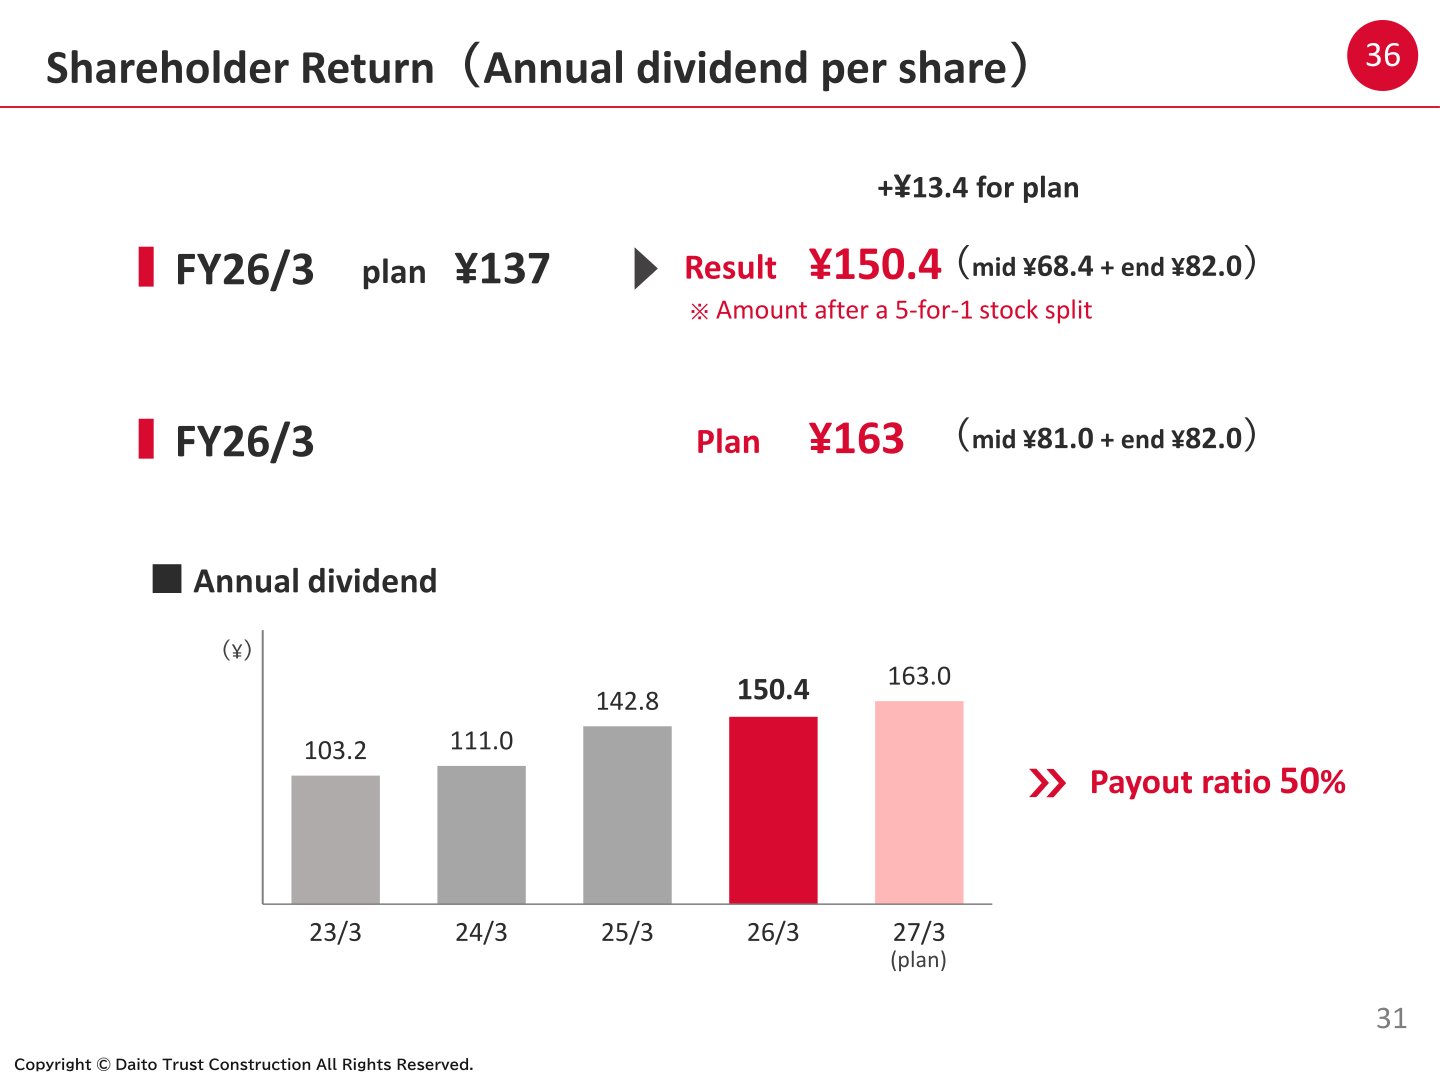
The annual dividend per share for FY26/3 was ¥150.4 (interim ¥68.4 plus year-end ¥82.0), ¥13.4 above the initial plan of ¥137 and ¥7.6 higher than the prior year. For the following fiscal year the Company plans an annual dividend of ¥163 per share (interim ¥81.0 plus year-end ¥82.0). The slide shows a payout ratio of 50%. All per-share dividend amounts are stated after a 5-for-1 stock split. During FY26/3, acquisition and disposal of treasury stock accounted for △¥22.0bn within financing cash flow.
| Fiscal year | Annual dividend per share |
|---|---|
| FY23/3 | ¥103.2 |
| FY24/3 | ¥111.0 |
| FY25/3 | ¥142.8 |
| FY26/3 | ¥150.4 |
| FY27/3 (plan) | ¥163.0 |
Medium-Term Plan / Topics
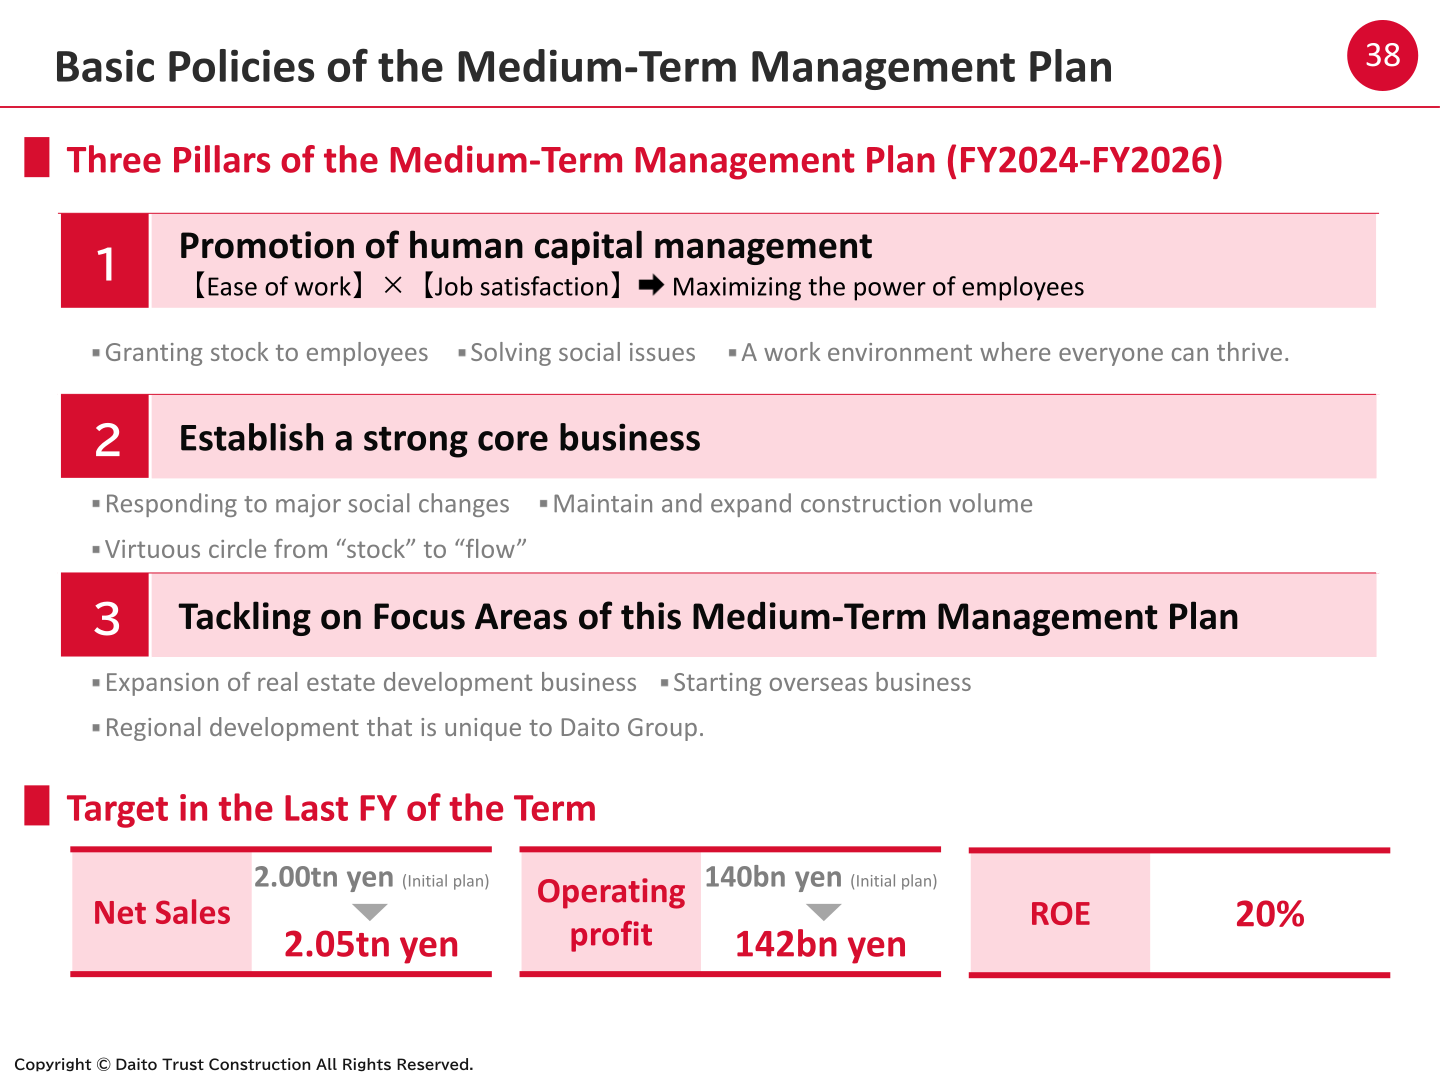
The Medium-Term Management Plan covering FY2024–FY2026 rests on three pillars: promotion of human capital management, establishing a strong core business, and tackling the focus areas of the plan. The target for the last fiscal year of the term has been revised upward from the initial plan of 2.00tn yen in net sales and 140bn yen in operating profit to 2.05tn yen and 142bn yen, with an ROE target of 20%. Under the core-business pillar, the Company is responding to rising construction costs, rents and interest rates through fair pricing (sales price increase of +11%), focusing on areas where rent increases are expected (order ratio in the three major metropolitan areas +9.2p) and strengthening rebuild proposals (replacement contract ratio +6.9p).
Among the focus areas, expansion of the real estate development business lifted segment net sales to ¥147.0bn in FY26/3 from ¥51.3bn a year earlier, with ¥180.0bn planned for FY27/3. In the overseas business, the Company acquired a 65-unit condominium building in Los Angeles, California in January 2026; the amount purchased in FY2025 was ¥10.2bn and the FY2026 sales target is ¥9.0bn, as the focus shifts from procurement to sales. The Company also conducted a tender offer for THE Global Co., Ltd., a developer of rental apartment buildings and condominiums mainly in Tokyo’s 23 wards, and aims to make it a wholly owned subsidiary through a future squeeze-out; as of the end of June 2025 THE Global had net sales of approximately ¥61.7bn, operating profit of approximately ¥5.4bn, capital of 1,924.37 million yen and 142 group employees. This is not yet reflected in the performance forecasts for the current fiscal year.
The presentation also provides a reference estimate of the impact of the new lease accounting standard, to be adopted in FY2027. Applying it to FY2025 figures would raise assets from ¥1,368bn to ¥3,623bn (including right-of-use assets of ¥2,255bn) and liabilities from ¥871bn to ¥3,184bn (including lease liabilities of ¥2,313bn), reducing net assets from ¥497bn to ¥439bn. On this reference basis the equity ratio would fall from 36.5% to 12.2% and ROA from 7.6% to 2.9%, while ROE would rise from 20.5% to 23.7%. The Company states the estimate is for reference purposes only and does not represent actual figures at the time of adoption.
This article is an analysis based on publicly available information and is not a recommendation to buy or sell any specific securities. Investment decisions are your own responsibility.
![[Obayashi] Investors’ Guide 2026 — The Complete 24-Article Breakdown](https://japan-equity.com/wp-content/uploads/2026/07/hub_cover-1024x1024.png)
![[Obayashi] IR & SR Policy — Feeding Dialogue Back into Management](https://japan-equity.com/wp-content/uploads/2026/07/p32_sq-1024x1024.jpg)
![[Obayashi] Real Estate Development — 18.7% Margin, ¥287.7bn Unrealized Gains](https://japan-equity.com/wp-content/uploads/2026/07/p20_sq-1024x1024.jpg)
![[Obayashi] Domestic Civil Engineering — Resilience Spending Supports 9.6% Margin](https://japan-equity.com/wp-content/uploads/2026/07/p11_sq-1024x1024.jpg)
![[Obayashi] Share Price & External Ratings — vs TOPIX, ESG Index Inclusion](https://japan-equity.com/wp-content/uploads/2026/07/p40_sq-1024x1024.jpg)
![[Construction] ¥75.5tn Investment, Shrinking Workforce — Big-5 Market Share](https://japan-equity.com/wp-content/uploads/2026/07/p12_sq-1024x1024.jpg)



![[Obayashi] Capital Policy & Shareholder Returns — ROE 10%+, DOE ~5%, ¥100bn Buyback](https://japan-equity.com/wp-content/uploads/2026/07/p27_sq-1024x1024.jpg)
![[Obayashi] Reducing Cross-Shareholdings — ¥285.2bn Sold in Five Years](https://japan-equity.com/wp-content/uploads/2026/07/p29_sq-1024x1024.jpg)
![[Obayashi] ¥750bn Investment Plan — ¥300bn to Development, ¥190bn to Tech/DX](https://japan-equity.com/wp-content/uploads/2026/07/p30_sq-1024x1024.jpg)
![[Obayashi] MTP2022 KPIs — Operating Profit ~2x Target, ROE 14.4%](https://japan-equity.com/wp-content/uploads/2026/07/p25_sq-1024x1024.jpg)
![[Obayashi] Cash Allocation — ¥420bn Investment CF Over Five Years](https://japan-equity.com/wp-content/uploads/2026/07/p26_sq-1024x1024.jpg)
![[Obayashi] Green Energy — 44 Plants, 344MW, and the Green Hydrogen Challenge](https://japan-equity.com/wp-content/uploads/2026/07/p21_sq-1024x1024.jpg)
![[Obayashi] Tackling the Labor Shortage — Robotics Construction®](https://japan-equity.com/wp-content/uploads/2026/07/p14_sq-1024x1024.jpg)
