
This article is based on publicly available IR materials and is not a recommendation to buy or sell any specific securities.
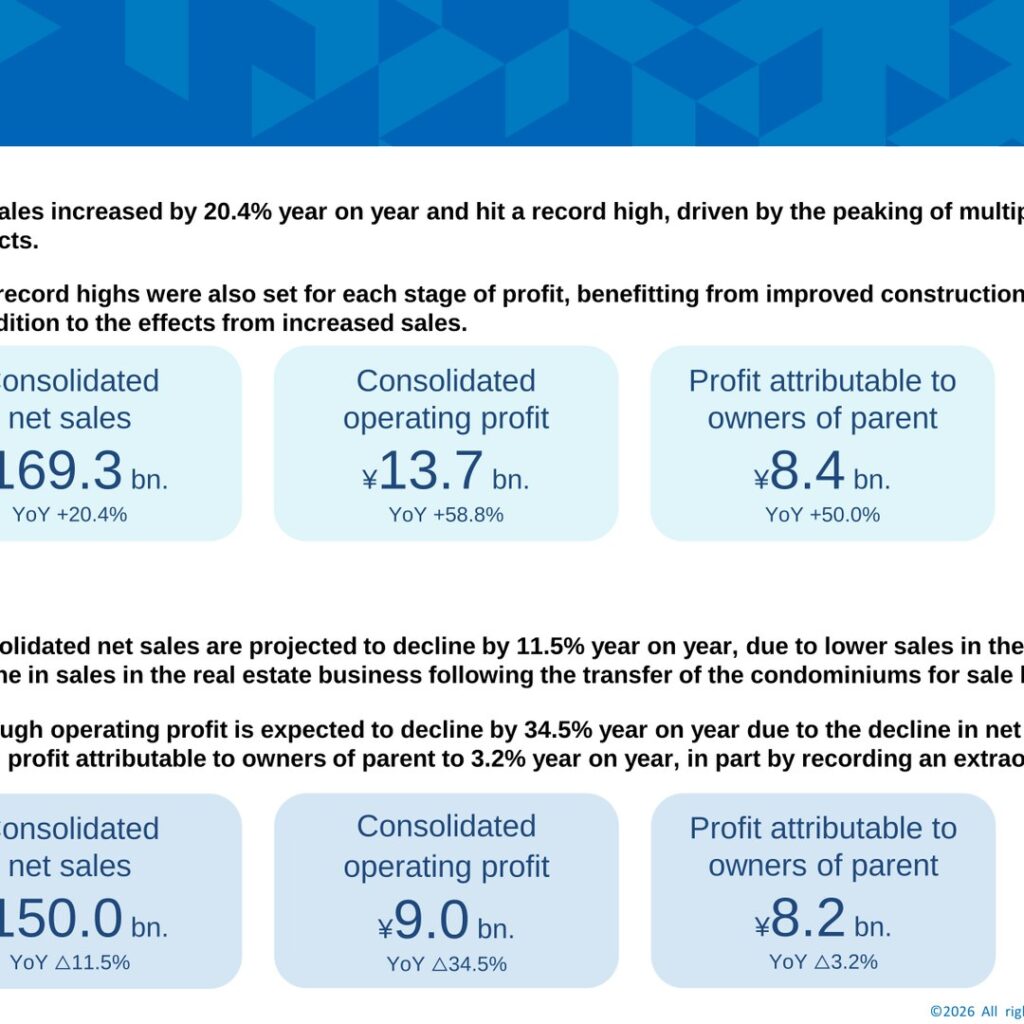
Note: this article covers the most recently completed fiscal year, which our site classifies as FY2025; the company labels it the “fiscal year ended March 31, 2026” (2026.3), and that label is retained in the text, tables and segment data below. Yahagi Construction reported consolidated net sales of ¥169,399 million for the fiscal year ended March 31, 2026, up 20.4% year on year and a record high, driven by the peaking of multiple large-scale construction projects. Operating profit rose 58.8% to ¥13,742 million and profit attributable to owners of parent rose 50.0% to ¥8,468 million, with new record highs set at each stage of profit. The annual dividend was raised by ¥20 to ¥100 per share. For the fiscal year ending March 31, 2027 the company forecasts net sales of ¥150,000 million (down 11.5%) and operating profit of ¥9,000 million (down 34.5%), while profit attributable to owners of parent is expected to decline just 3.2% to ¥8,200 million.
Consolidated Results (Full-Year Actual)
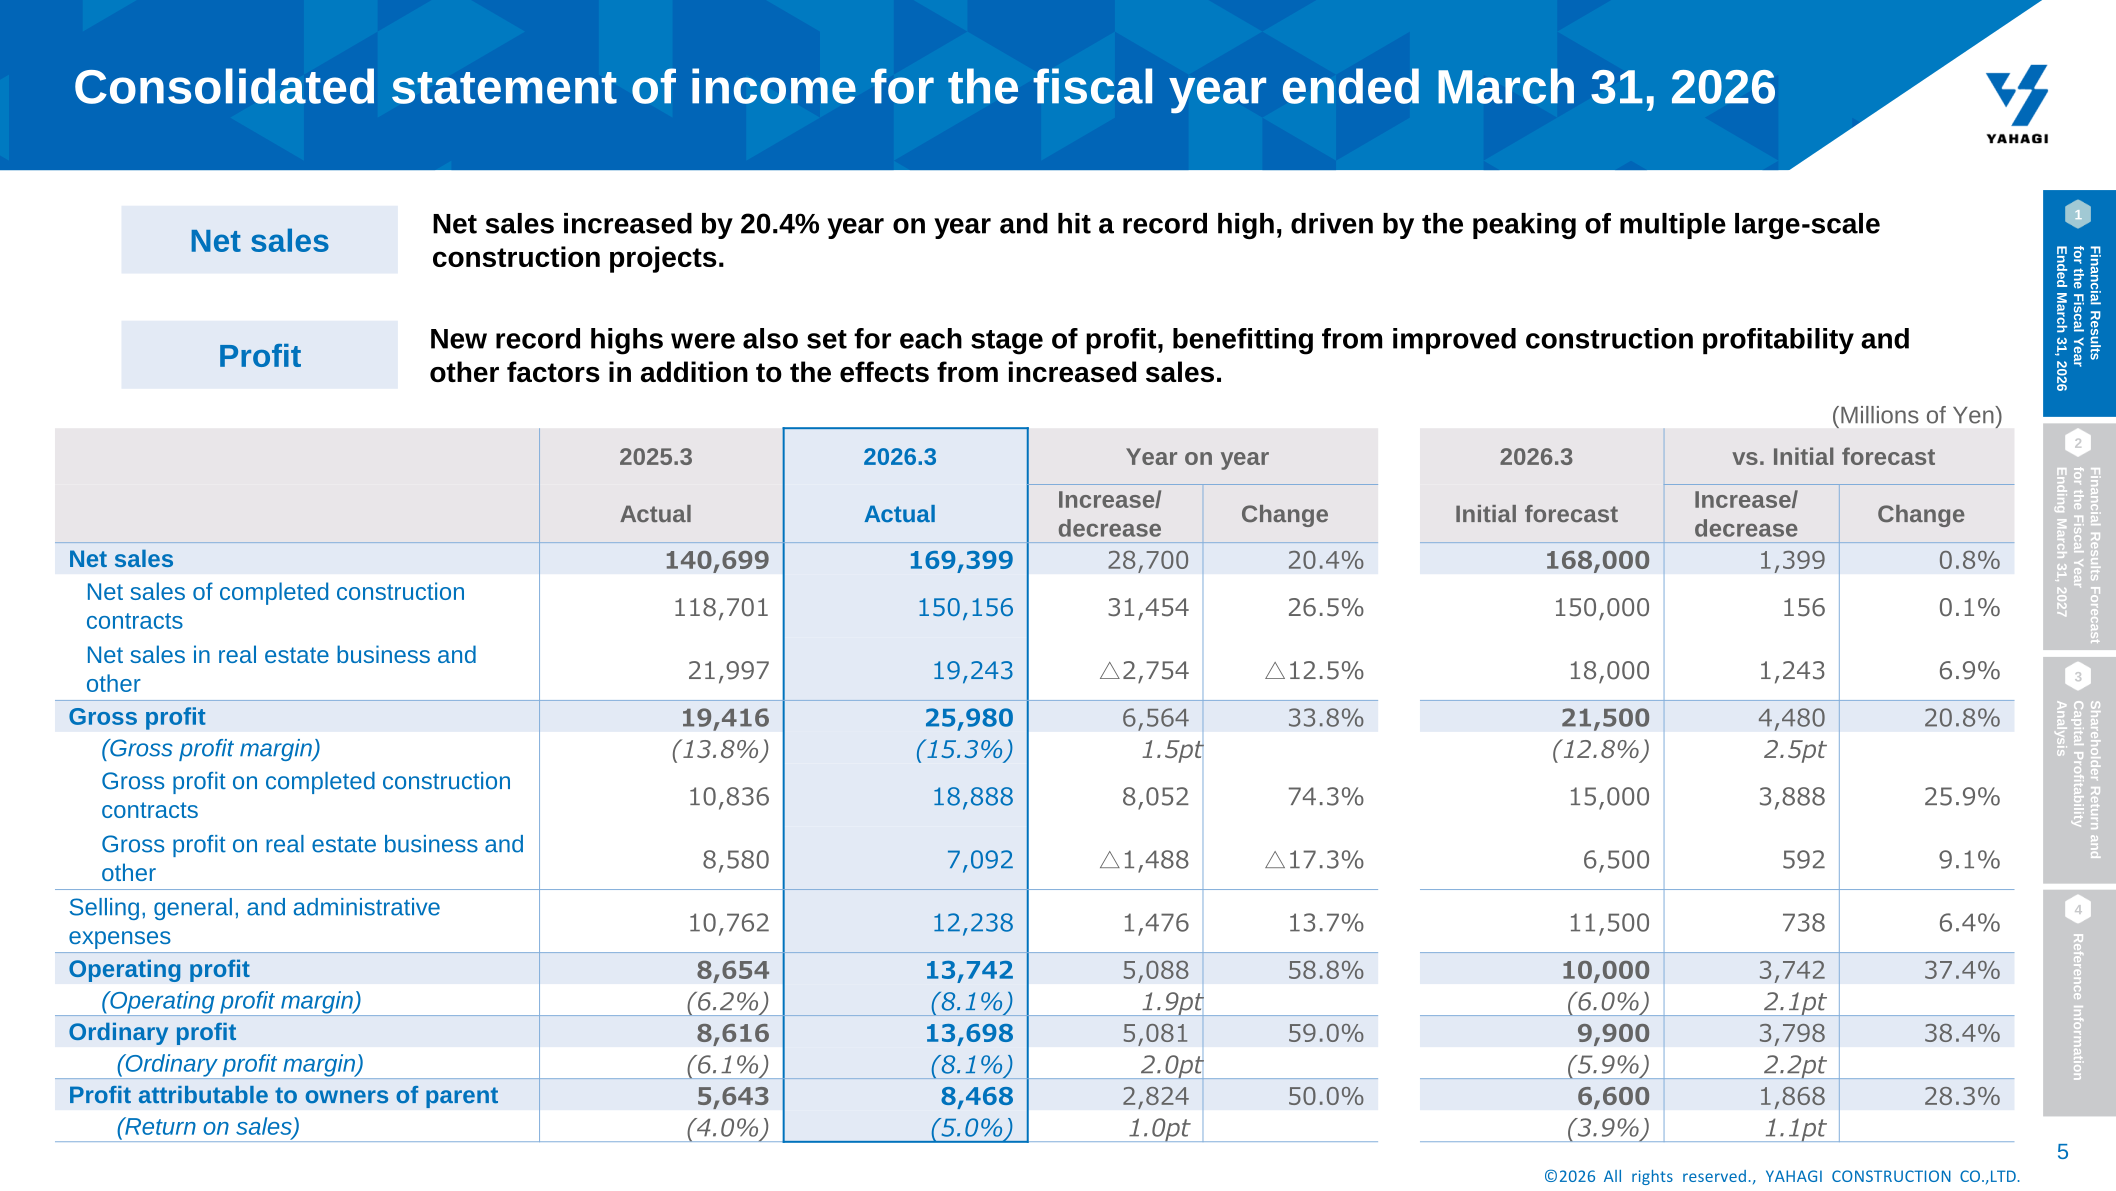
Net sales increased by 20.4% year on year and hit a record high, driven by the peaking of multiple large-scale construction projects. New record highs were also set for each stage of profit, benefitting from improved construction profitability and other factors in addition to the effects from increased sales. Net sales also exceeded the initial forecast by ¥1.3 billion due to progress in real estate sales, and operating profit exceeded the initial forecast by ¥3.7 billion as the architectural, civil engineering and real estate businesses each came in above plan.
| Item (Millions of Yen) | 2025.3 Actual | 2026.3 Actual | Increase/decrease | Change |
|---|---|---|---|---|
| Net sales | 140,699 | 169,399 | 28,700 | 20.4% |
| Net sales of completed construction contracts | 118,701 | 150,156 | 31,454 | 26.5% |
| Net sales in real estate business and other | 21,997 | 19,243 | △2,754 | △12.5% |
| Gross profit | 19,416 | 25,980 | 6,564 | 33.8% |
| (Gross profit margin) | (13.8%) | (15.3%) | 1.5pt | — |
| Gross profit on completed construction contracts | 10,836 | 18,888 | 8,052 | 74.3% |
| Gross profit on real estate business and other | 8,580 | 7,092 | △1,488 | △17.3% |
| Selling, general, and administrative expenses | 10,762 | 12,238 | 1,476 | 13.7% |
| Operating profit | 8,654 | 13,742 | 5,088 | 58.8% |
| (Operating profit margin) | (6.2%) | (8.1%) | 1.9pt | — |
| Ordinary profit | 8,616 | 13,698 | 5,081 | 59.0% |
| (Ordinary profit margin) | (6.1%) | (8.1%) | 2.0pt | — |
| Profit attributable to owners of parent | 5,643 | 8,468 | 2,824 | 50.0% |
| (Return on sales) | (4.0%) | (5.0%) | 1.0pt | — |
Segment Results
In the architectural business, net sales increased significantly by ¥25.8 billion year on year, driven by steady progress of work on several large logistics facility projects hitting peak activity, and gross profit increased significantly by ¥6.3 billion, primarily driven by higher sales, in addition to progress in passing on the higher cost of goods through prices and the absence of a provision for losses on construction contracts that was recorded in the previous fiscal year. In the civil engineering business, sales rose by ¥5.6 billion, reflecting progress on the extensive backlog of construction projects in both the public and private sectors, and gross profit increased ¥1.6 billion due to higher sales, higher contract amounts from design changes and progress in reducing costs. In the real estate business, net sales fell ¥2.7 billion, reflecting a decrease in units sold in the condominiums for sale business due to a decrease in the number of newly offered units, and gross profit declined by ¥1.4 billion, reflecting the decline in net sales.
| Segment | Metric (Millions of Yen) | 2026.3 Actual | 2025.3 Actual |
|---|---|---|---|
| Architectural business | Net sales | 112,339 | 86,529 |
| Architectural business | Gross profit | 11,056 | 4,676 |
| Architectural business | Gross profit margin | 9.8% | 5.4% |
| Civil engineering business | Net sales | 37,817 | 32,172 |
| Civil engineering business | Gross profit | 7,831 | 6,159 |
| Civil engineering business | Gross profit margin | 20.7% | 19.1% |
| Real estate business | Net sales | 19,243 | 21,997 |
| Real estate business | Gross profit | 7,092 | 8,580 |
| Real estate business | Gross profit margin | 36.9% | 39.0% |
| Total | Net sales | 169,399 | 140,699 |
| Total | Gross profit | 25,980 | 19,416 |
Orders Received and Orders Received Carried Forward
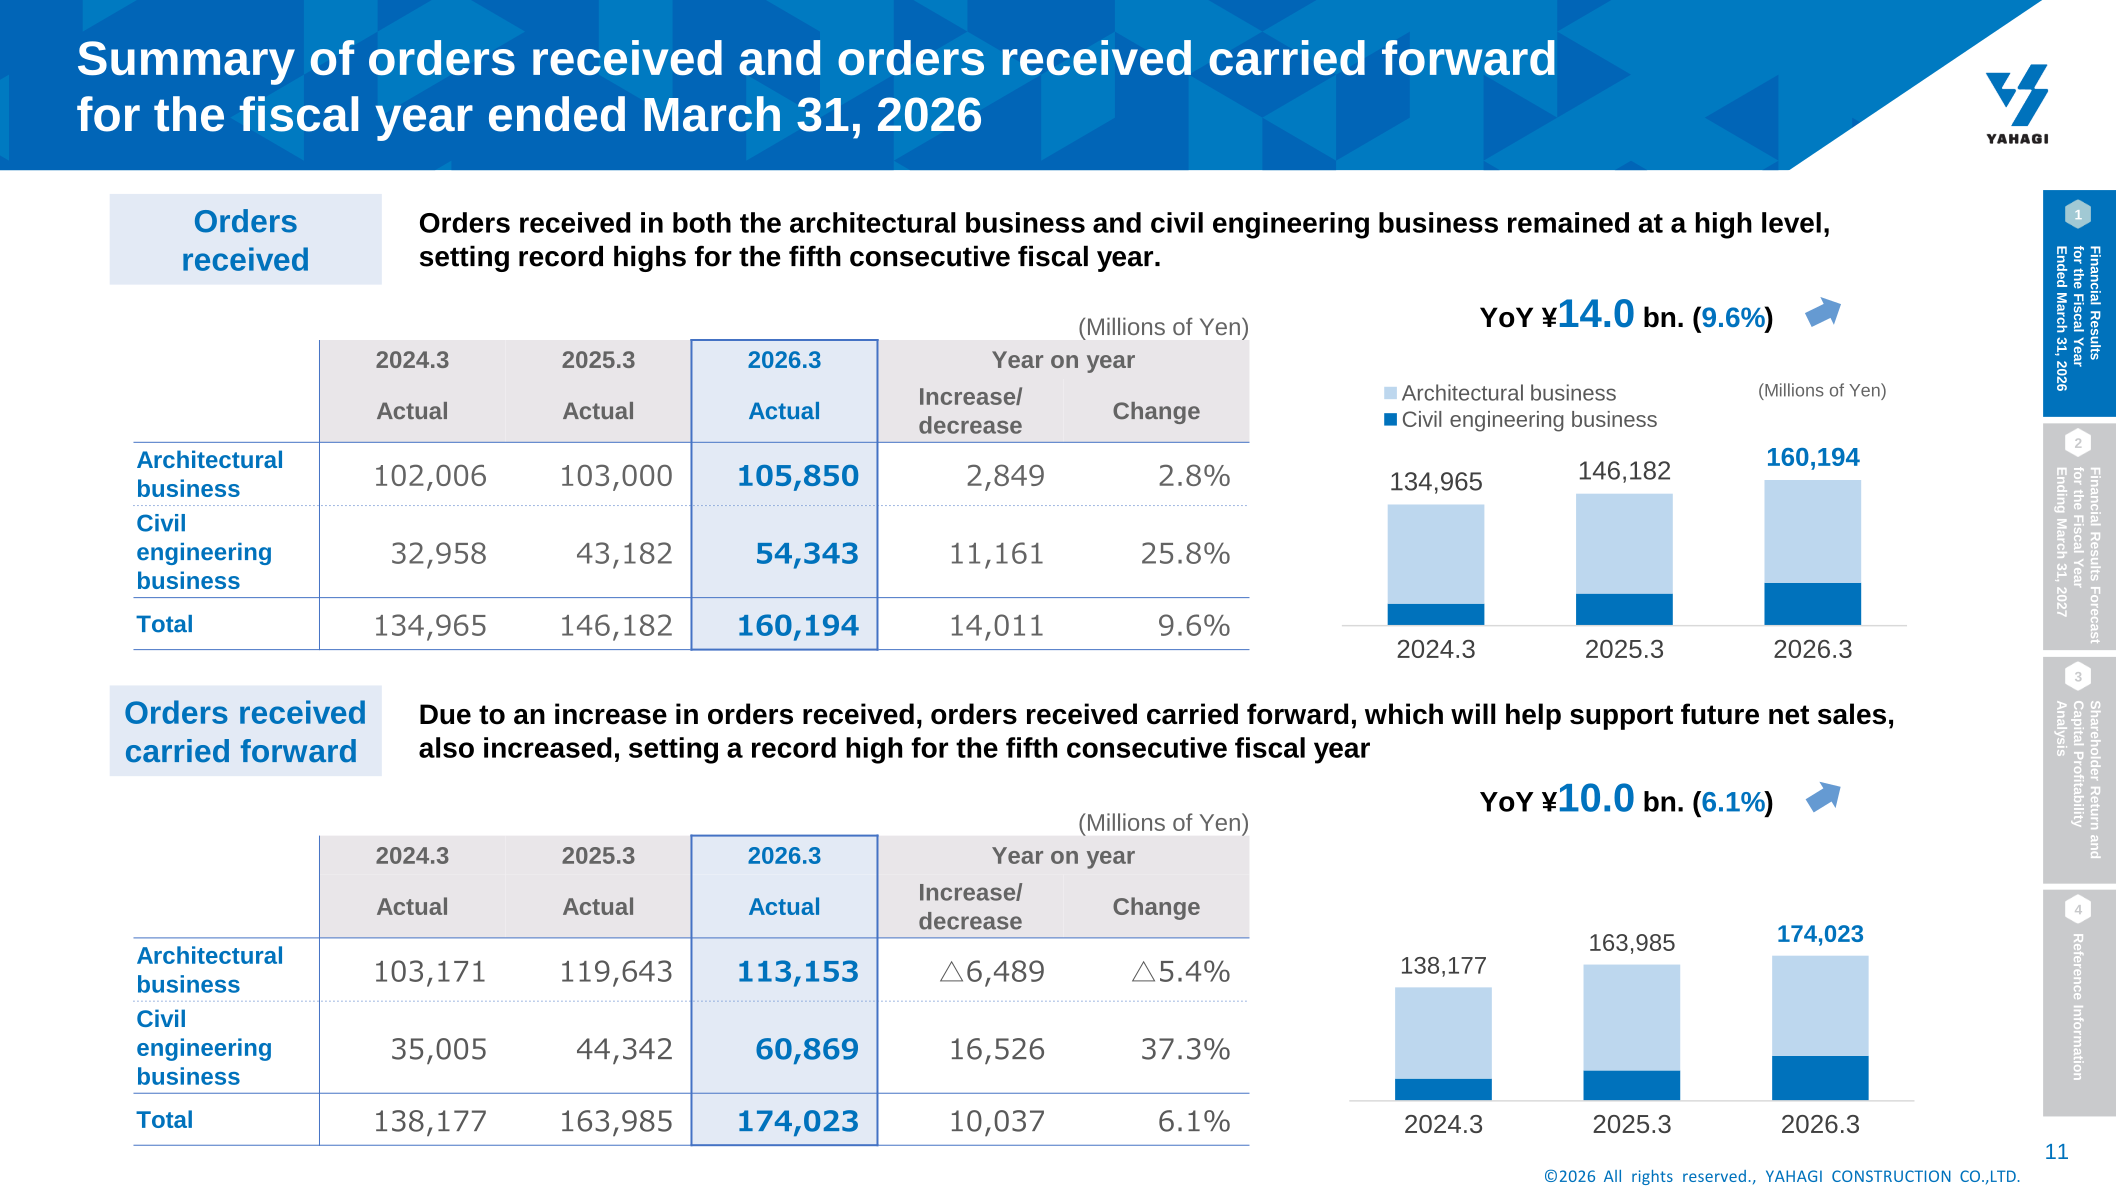
Orders received in both the architectural business and civil engineering business remained at a high level, setting record highs for the fifth consecutive fiscal year. Orders received in the architectural business remained high, largely due to multiple large-scale condominium orders, while civil engineering orders received increased significantly by ¥11.1 billion year on year following the receipt of multiple large-scale construction projects from the public sector. Due to the increase in orders received, orders received carried forward, which will help support future net sales, also increased, setting a record high for the fifth consecutive fiscal year.
| Item (Millions of Yen) | 2025.3 Actual | 2026.3 Actual | Increase/decrease | Change |
|---|---|---|---|---|
| Orders received – Architectural business | 103,000 | 105,850 | 2,849 | 2.8% |
| Orders received – Civil engineering business | 43,182 | 54,343 | 11,161 | 25.8% |
| Orders received – Total | 146,182 | 160,194 | 14,011 | 9.6% |
| Carried forward – Architectural business | 119,643 | 113,153 | △6,489 | △5.4% |
| Carried forward – Civil engineering business | 44,342 | 60,869 | 16,526 | 37.3% |
| Carried forward – Total | 163,985 | 174,023 | 10,037 | 6.1% |
Financial Position and Cash Flow
Total assets increased by ¥3.4 billion to ¥147,662 million due to higher trade receivables driven by progress in construction in the architectural business, even as real estate for sale and property, plant and equipment declined on the sale of real estate holdings. Net assets increased by ¥7.1 billion to ¥76,010 million due to the recording of retained earnings and other factors, and the equity ratio rose to 51.5%. As a result of the repayment of borrowings, interest-bearing debt declined by ¥7.8 billion to ¥30.8 billion and the D/E ratio fell to 0.4x. Operating cash flow amounted to an inflow of ¥9.8 billion, investing cash flow an inflow of ¥1.9 billion and financing cash flow an outflow of ¥11.1 billion, leaving the balance of cash and cash equivalents at ¥16.2 billion, up ¥0.6 billion from the end of the previous fiscal year.
Financial Results Forecast for the Fiscal Year Ending March 31, 2027
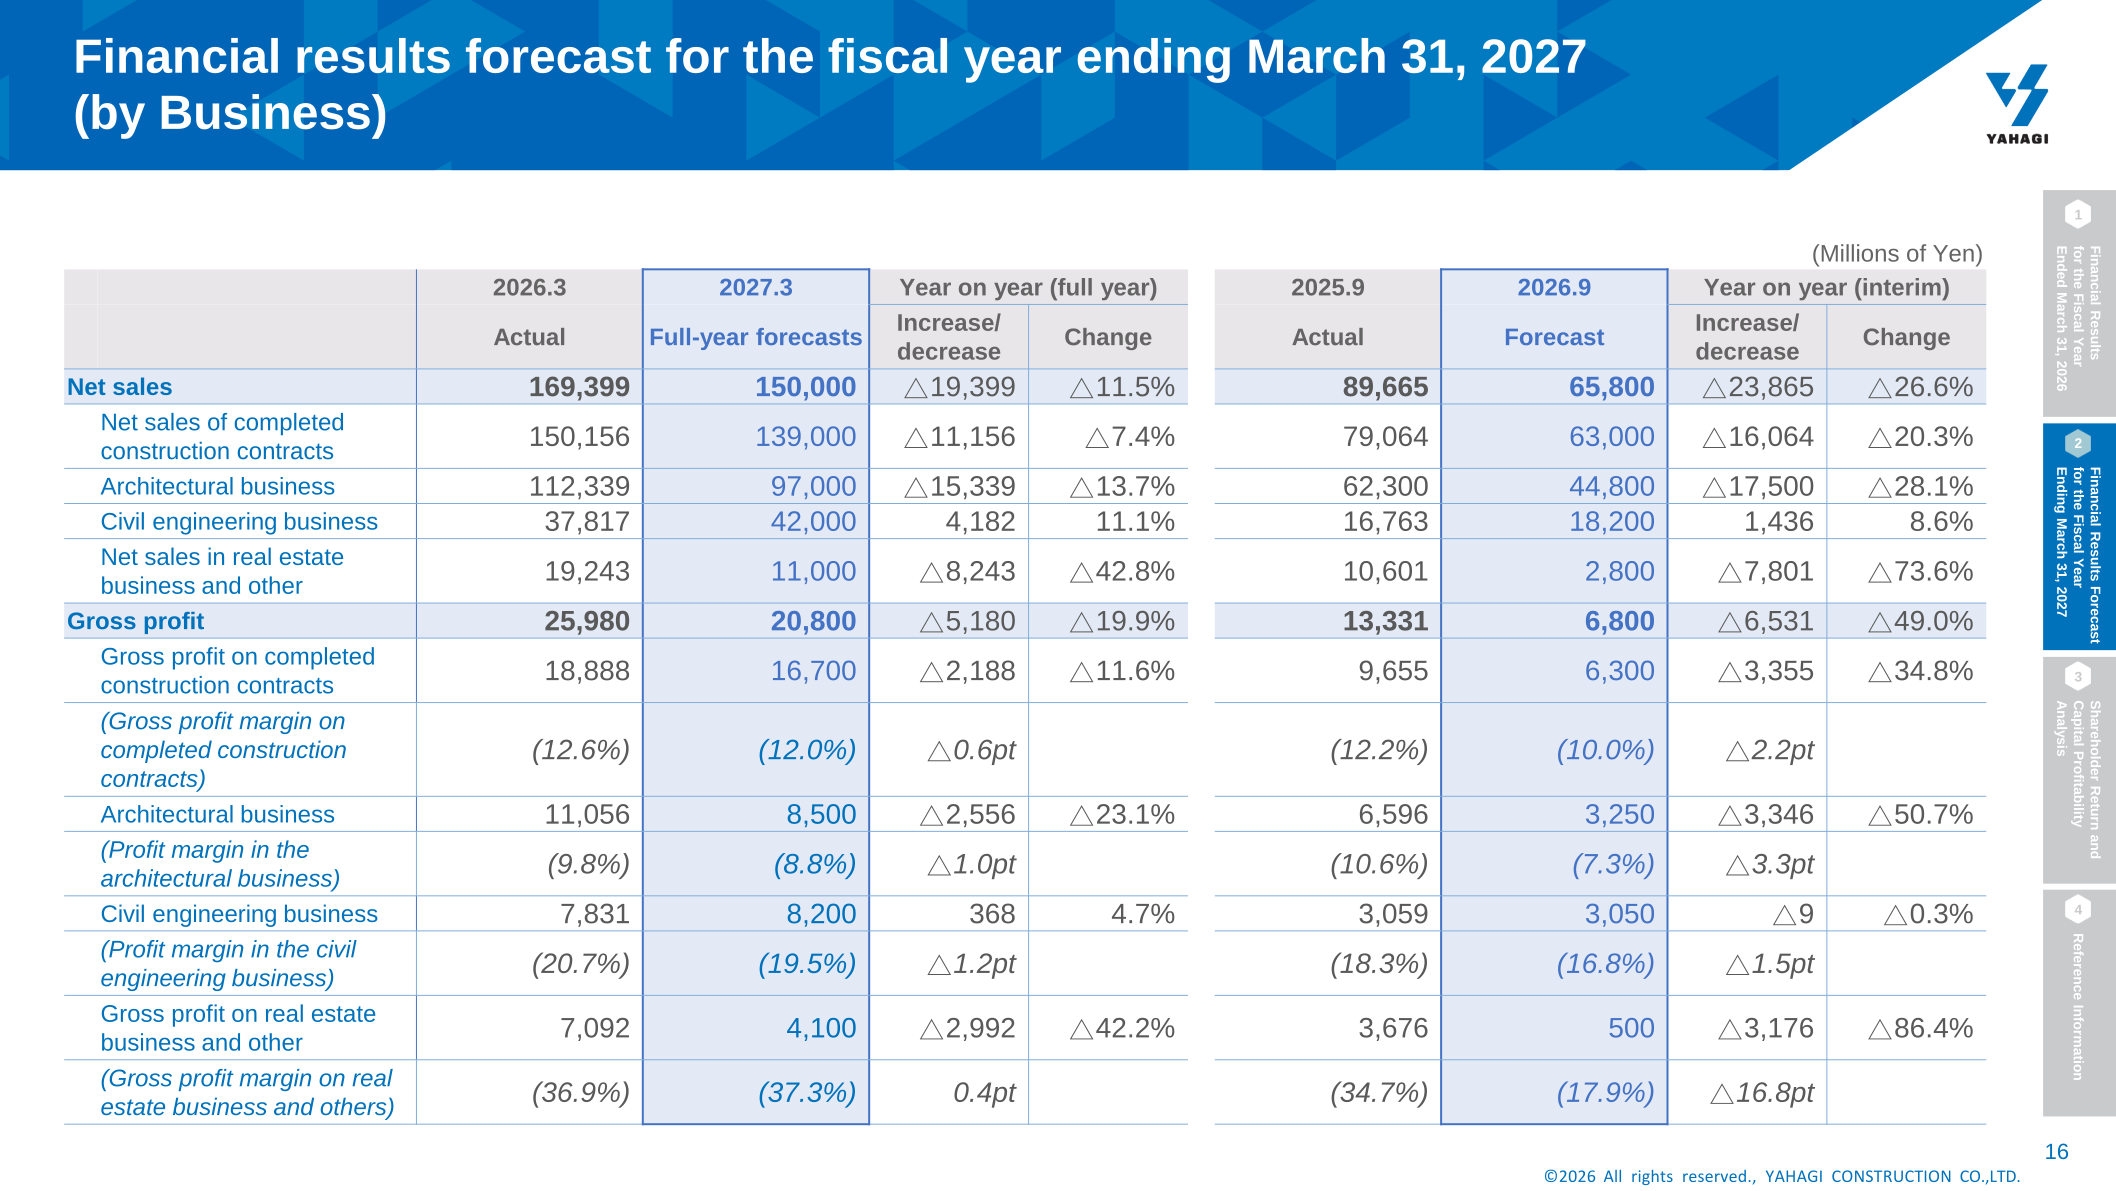
Net sales are projected to decline by ¥19.3 billion due to lower sales from the transfer of the condominiums for sale business under the real estate business, in addition to a reactionary decline following the previous fiscal year that saw the peaking of multiple large-scale building construction projects. Due to lower net sales, operating profit is forecast to decline significantly by ¥4.7 billion year on year. However, due to a gain from the transfer of the condominium management business, gains on the sale of strategic shareholdings and other developments, profit attributable to owners of parent is expected to decline by just ¥0.2 billion year on year. The majority of the full-year operating profit forecast of ¥9.0 billion is expected to be recorded in the second half, as profit recognition across businesses will be concentrated in the second half.
| Item (Millions of Yen) | 2026.3 Actual | 2027.3 Full-year forecasts | Increase/decrease | Change |
|---|---|---|---|---|
| Net sales | 169,399 | 150,000 | △19,399 | △11.5% |
| Net sales of completed construction contracts | 150,156 | 139,000 | △11,156 | △7.4% |
| Architectural business | 112,339 | 97,000 | △15,339 | △13.7% |
| Civil engineering business | 37,817 | 42,000 | 4,182 | 11.1% |
| Net sales in real estate business and other | 19,243 | 11,000 | △8,243 | △42.8% |
| Gross profit | 25,980 | 20,800 | △5,180 | △19.9% |
| Selling, general, and administrative expenses | 12,238 | 11,800 | △438 | △3.6% |
| Operating profit | 13,742 | 9,000 | △4,742 | △34.5% |
| Ordinary profit | 13,698 | 8,880 | △4,818 | △35.2% |
| Profit attributable to owners of parent | 8,468 | 8,200 | △268 | △3.2% |
Shareholder Returns
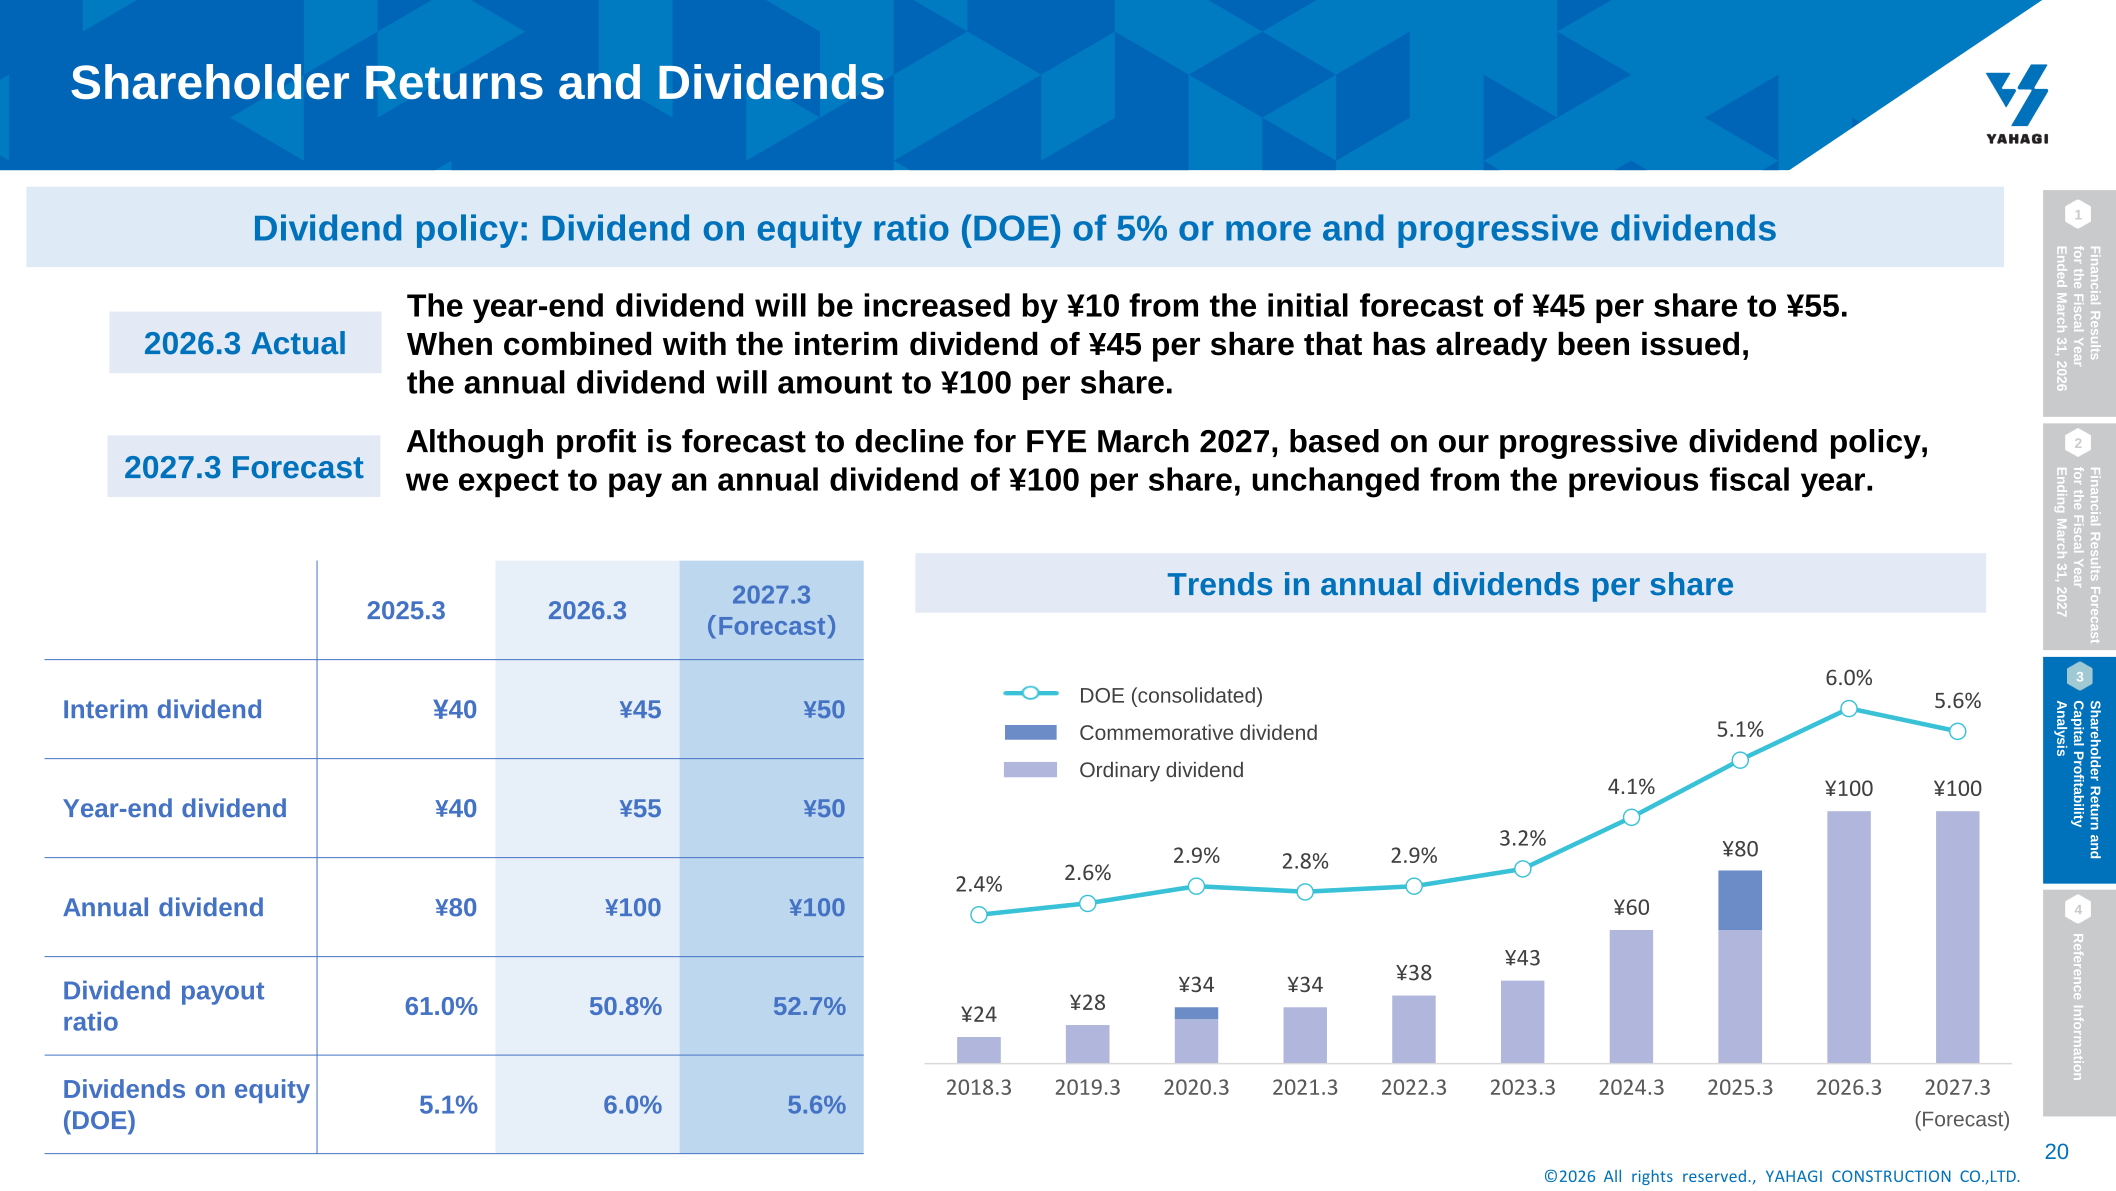
The company’s dividend policy is a dividend on equity ratio (DOE) of 5% or more and progressive dividends. The year-end dividend was increased by ¥10 from the initial forecast of ¥45 per share to ¥55; combined with the interim dividend of ¥45 per share that had already been issued, the annual dividend amounted to ¥100 per share. Although profit is forecast to decline for the fiscal year ending March 31, 2027, based on the progressive dividend policy the company expects to pay an annual dividend of ¥100 per share, unchanged from the previous fiscal year.
| Item | 2025.3 | 2026.3 | 2027.3 (Forecast) |
|---|---|---|---|
| Interim dividend | ¥40 | ¥45 | ¥50 |
| Year-end dividend | ¥40 | ¥55 | ¥50 |
| Annual dividend | ¥80 | ¥100 | ¥100 |
| Dividend payout ratio | 61.0% | 50.8% | 52.7% |
| Dividends on equity (DOE) | 5.1% | 6.0% | 5.6% |
Capital Profitability Analysis
ROE reached 11.7%, up 3.4 points from the previous year, as the company improved the asset turnover ratio in addition to the net profit margin. As of March 2026, ROE of 11.7% comprised a net profit margin of 5.0%, an asset turnover ratio of 1.16x and financial leverage of 2.02x. Meanwhile, the cost of shareholders’ equity is also trending upward, reaching 9.5%, due to a rise in the risk-free rate associated with higher government bond yields and an increase in beta resulting from stock price fluctuations, and the company says it will work toward further improving profitability and enhancing capital efficiency. PBR as of March 31, 2026 was maintained at a level of more than 1.0, at 1.2x, comprising ROE of 11.7% and a PER of 10.1x.
Topics
The company is strengthening its medium- to long-term earnings base through M&A and a business transfer. In April 2026 it made Kaisho Co., Ltd. a subsidiary; Kaisho, established in May 2004 and headquartered in Kochi City, Kochi Prefecture, has 94 employees including approximately 70 skilled workers and posted net sales of ¥2,048 million and operating profit of ¥131 million for the fiscal year ended April 2025. Kaisho possesses the “Stand Drive Method,” which is highly compatible with Yahagi’s proprietary “PAN WALL method” for slope reinforcement. Also in April 2026, the condominium development and sales business operated by Yahagi Estate Co., Ltd. and the condominium management business operated by Yahagi Building & Life Co., Ltd. were transferred to Meitetsu Urban Development Co., Ltd. and Meitetsu Community Life Co., Ltd. respectively; net sales related to the transferred businesses were ¥5,065 million in the fiscal year ended March 2026.
This article is an analysis based on publicly available information and is not a recommendation to buy or sell any specific securities. Investment decisions are your own responsibility.
















