
This article is based on publicly available IR materials and is not a recommendation to buy or sell any specific securities.
Note: Fudo Tetra does not publish an English results presentation; this article is an English translation of the Japanese-language article on our sister site Investalk, which is based on the company’s Japanese-language IR materials, with figures transcribed as reported. Fudo Tetra’s fiscal year ends in March: the latest completed fiscal year, classified as FY2025 in this site’s title and URL, is the fiscal year ended March 31, 2026, and the body text, tables and segment data retain the source’s own period labels. Amounts are in millions of yen unless otherwise stated, following the source materials.
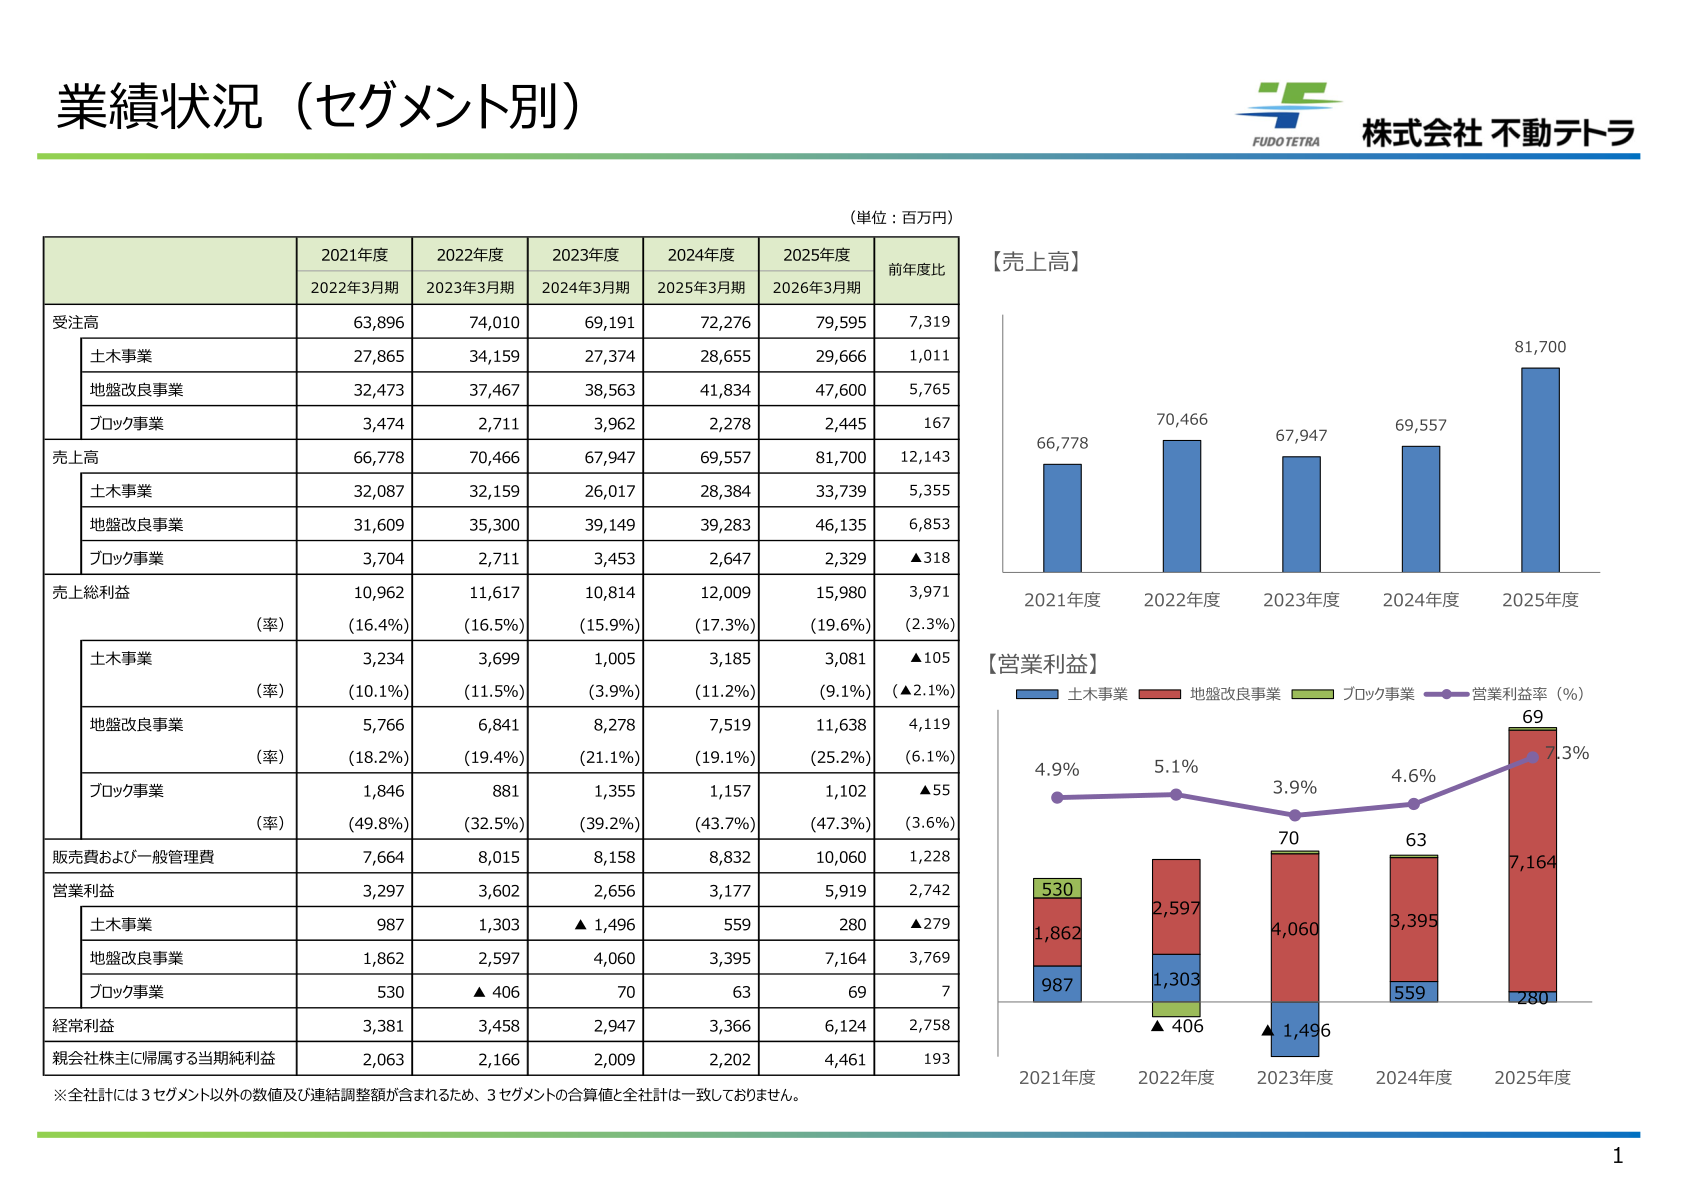
Fudo Tetra announced its consolidated results for the fiscal year ended March 31, 2026. Net sales were 81,700 million yen (previous fiscal year: 69,557 million yen), operating profit 5,919 million yen (previous fiscal year: 3,177 million yen), ordinary profit 6,124 million yen (previous fiscal year: 3,366 million yen) and profit attributable to owners of parent 4,461 million yen (previous fiscal year: 2,202 million yen), for higher sales and higher profit. Orders received were 79,595 million yen (previous fiscal year: 72,276 million yen).
Consolidated Results (Fiscal Year Ended March 31, 2026, Actual)
Gross profit was 15,980 million yen (gross profit margin 19.6%), up from 12,009 million yen (17.3%) in the previous fiscal year. Selling, general and administrative expenses were 10,060 million yen (previous fiscal year: 8,832 million yen).
| Item | FY ended March 2026 (¥ million) | FY ended March 2025 (¥ million) | Change |
|---|---|---|---|
| Orders received | 79,595 | 72,276 | 7,319 |
| Net sales | 81,700 | 69,557 | 12,143 |
| Gross profit | 15,980 (19.6%) | 12,009 (17.3%) | 3,971 |
| Operating profit | 5,919 | 3,177 | 2,742 |
| Ordinary profit | 6,124 | 3,366 | 2,758 |
| Profit attributable to owners of parent | 4,461 | 2,202 | – |
Segment Results
By segment, the Ground Improvement business posted orders received of 47,600 million yen, net sales of 46,135 million yen and operating profit of 7,164 million yen, all increasing, and drove the company-wide growth in sales and profit. In the Civil Engineering business, net sales rose to 33,739 million yen (previous fiscal year: 28,384 million yen), while operating profit declined to 280 million yen (previous fiscal year: 559 million yen). In the Block business, net sales fell to 2,329 million yen (previous fiscal year: 2,647 million yen), but operating profit edged up to 69 million yen (previous fiscal year: 63 million yen).
| Segment | Metric | FY ended March 2026 (¥ million) | FY ended March 2025 (¥ million) |
|---|---|---|---|
| Civil Engineering | Orders received | 29,666 | 28,655 |
| Civil Engineering | Net sales | 33,739 | 28,384 |
| Civil Engineering | Operating profit | 280 | 559 |
| Ground Improvement | Orders received | 47,600 | 41,834 |
| Ground Improvement | Net sales | 46,135 | 39,283 |
| Ground Improvement | Operating profit | 7,164 | 3,395 |
| Block | Orders received | 2,445 | 2,278 |
| Block | Net sales | 2,329 | 2,647 |
| Block | Operating profit | 69 | 63 |
Financial Position
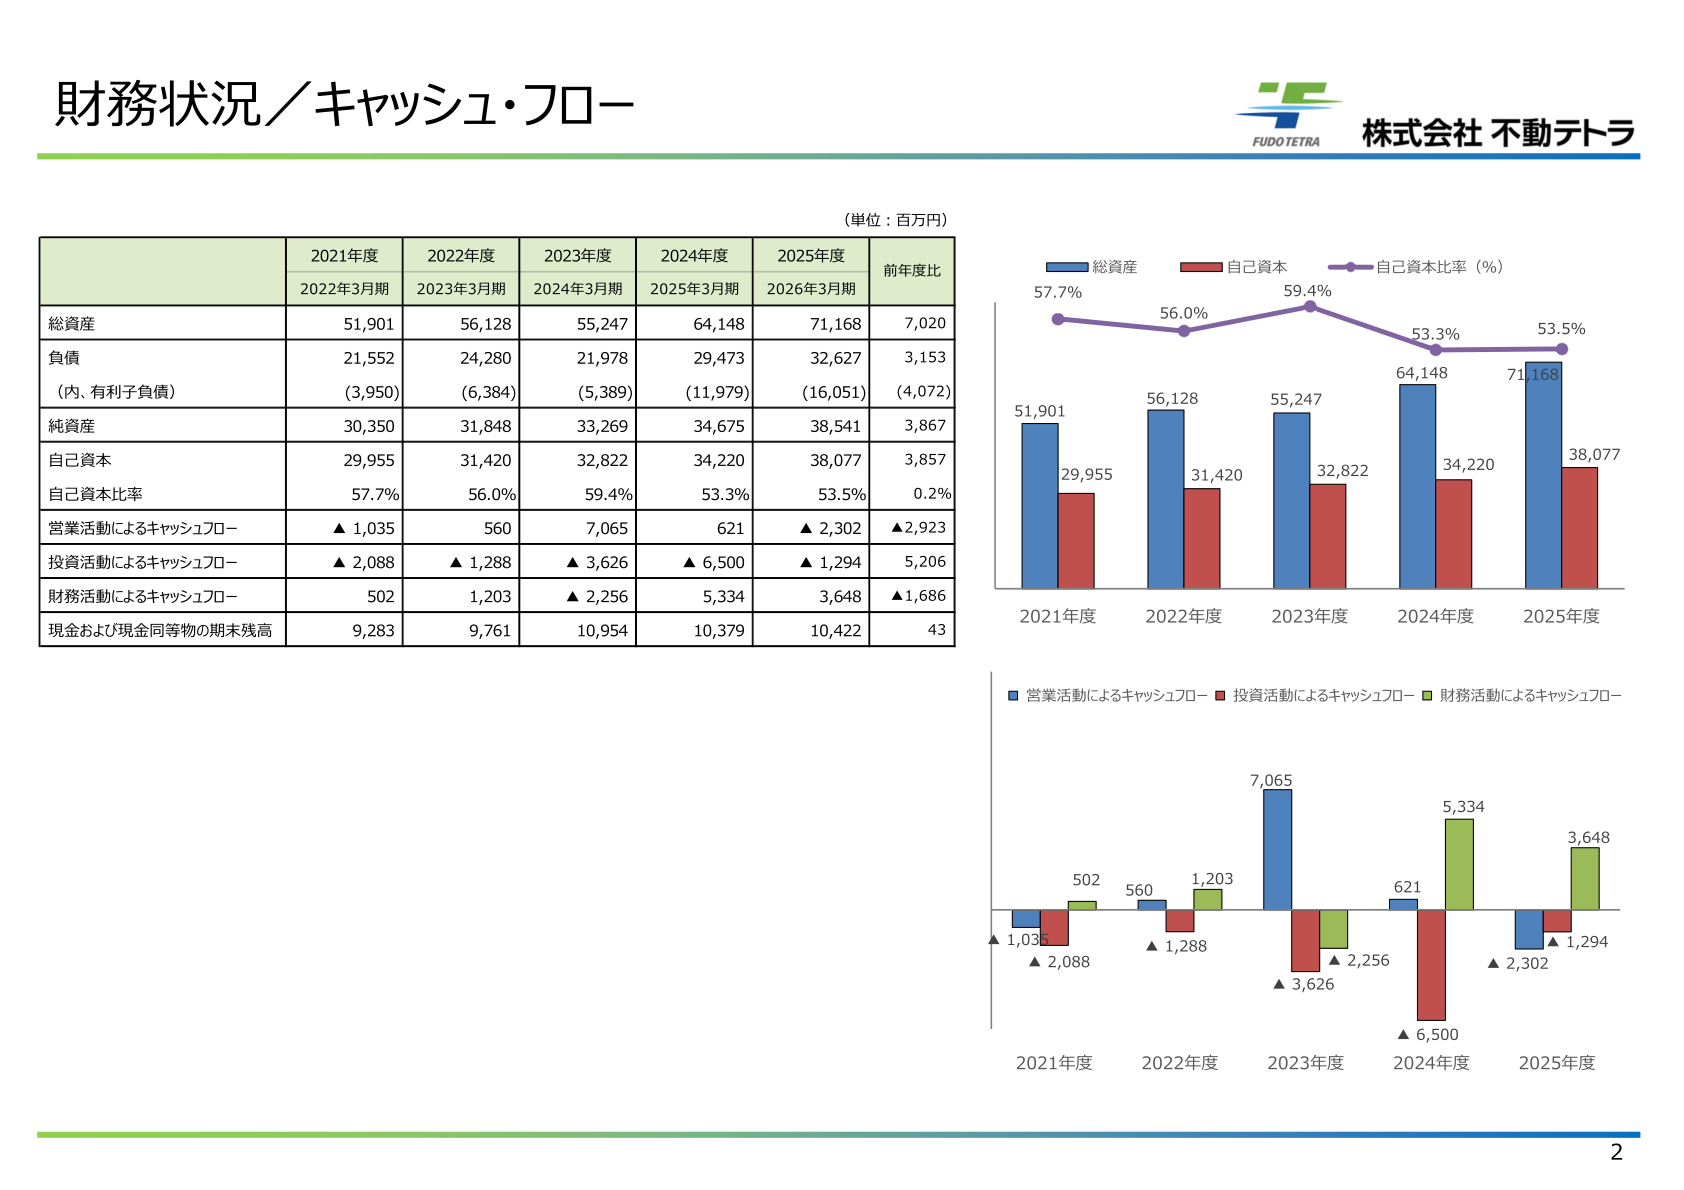
Total assets were 71,168 million yen (end of previous fiscal year: 64,148 million yen) and net assets 38,541 million yen (end of previous fiscal year: 34,675 million yen). Shareholders’ equity was 38,077 million yen (end of previous fiscal year: 34,220 million yen) and the equity ratio 53.5% (end of previous fiscal year: 53.3%). Interest-bearing debt (included in liabilities) increased to 16,051 million yen (end of previous fiscal year: 11,979 million yen). Cash and cash equivalents at the end of the period were 10,422 million yen (end of previous fiscal year: 10,379 million yen).
| Item | End of FY March 2026 (¥ million) | End of FY March 2025 (¥ million) | Change |
|---|---|---|---|
| Total assets | 71,168 | 64,148 | 7,020 |
| Liabilities | 32,627 | 29,473 | 3,153 |
| (of which, interest-bearing debt) | 16,051 | 11,979 | 4,072 |
| Net assets | 38,541 | 34,675 | 3,867 |
| Shareholders’ equity | 38,077 | 34,220 | 3,857 |
| Equity ratio | 53.5% | 53.3% | 0.2% |
Shareholder Returns
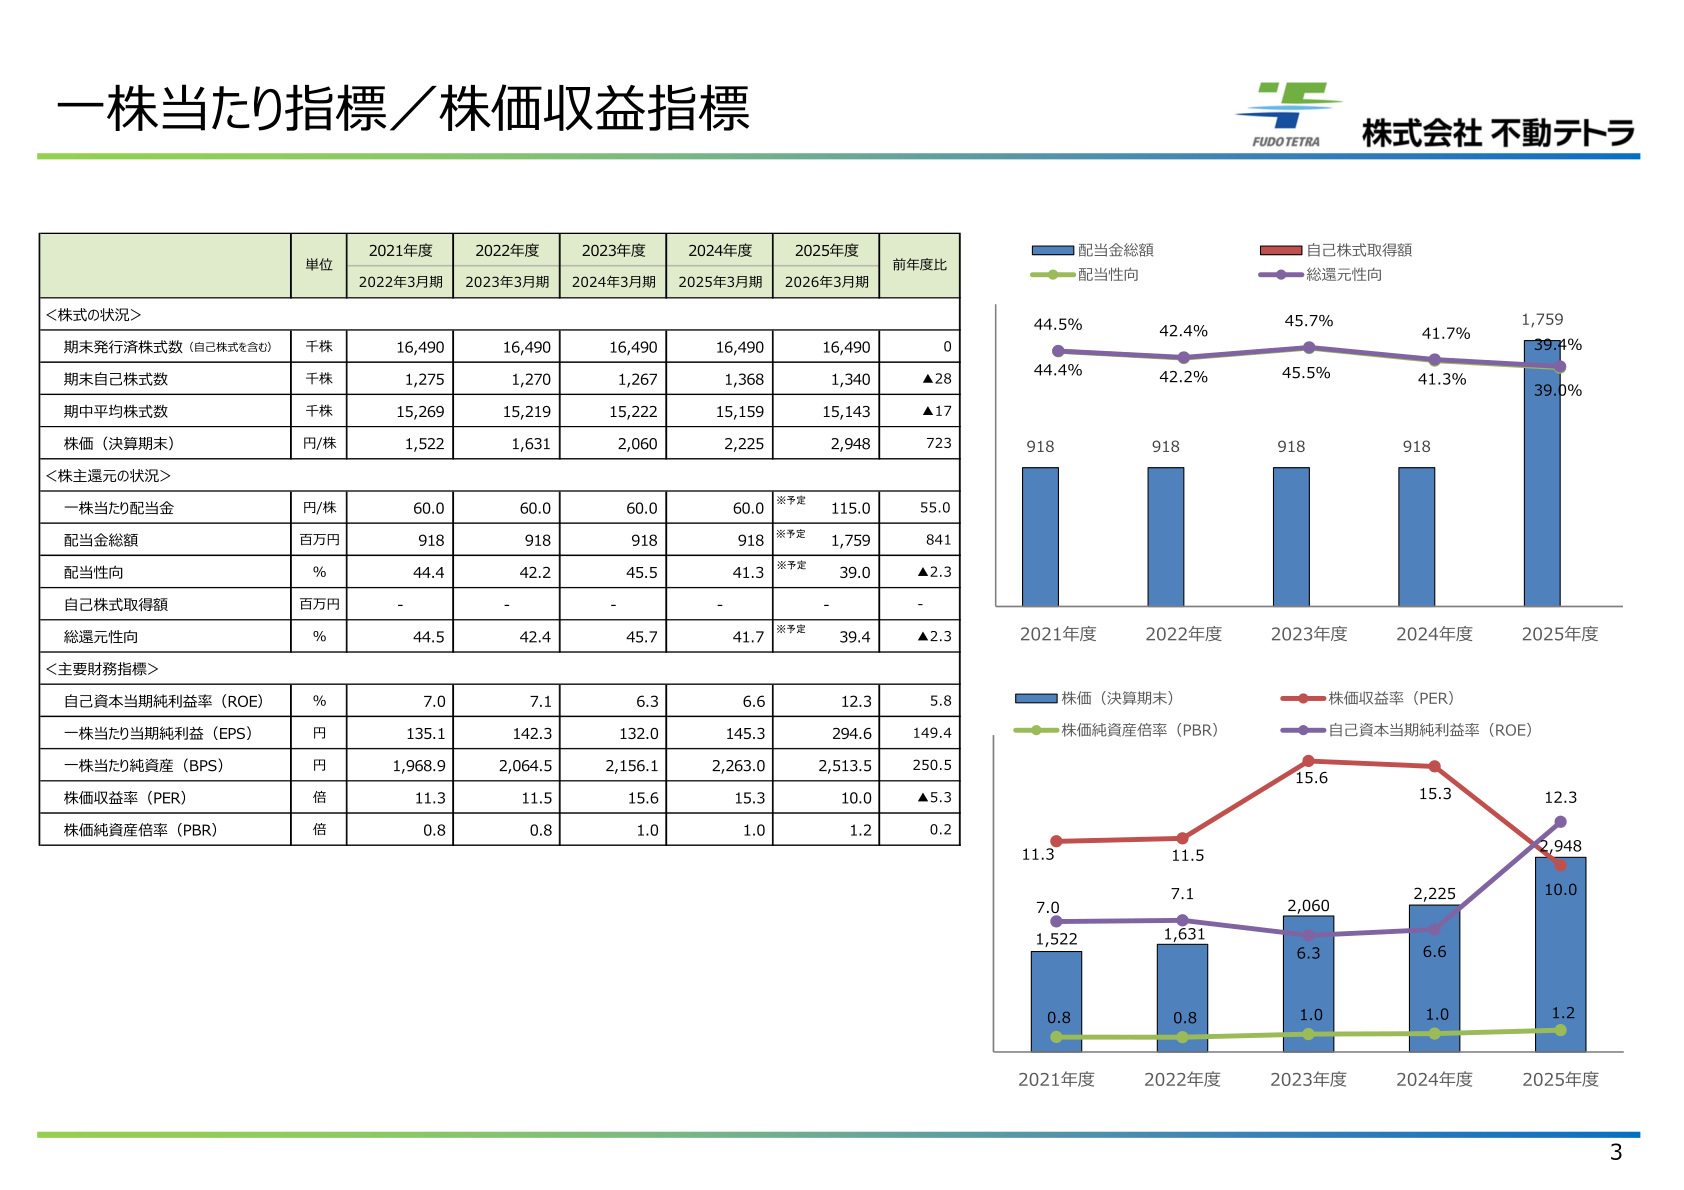
The dividend per share was ¥115.0 (previous fiscal year: ¥60.0), and total dividends were 1,759 million yen (previous fiscal year: 918 million yen). The payout ratio was 39.0% (previous fiscal year: 41.3%) and the total return ratio 39.4% (previous fiscal year: 41.7%). There were no share buybacks in any of the five periods disclosed.
| Item | FY ended March 2026 | FY ended March 2025 |
|---|---|---|
| Dividend per share | ¥115.0 | ¥60.0 |
| Total dividends | 1,759 million yen | 918 million yen |
| Payout ratio | 39.0% | 41.3% |
| Total return ratio | 39.4% | 41.7% |
Per-Share Indicators, Capital Expenditure and Other Items
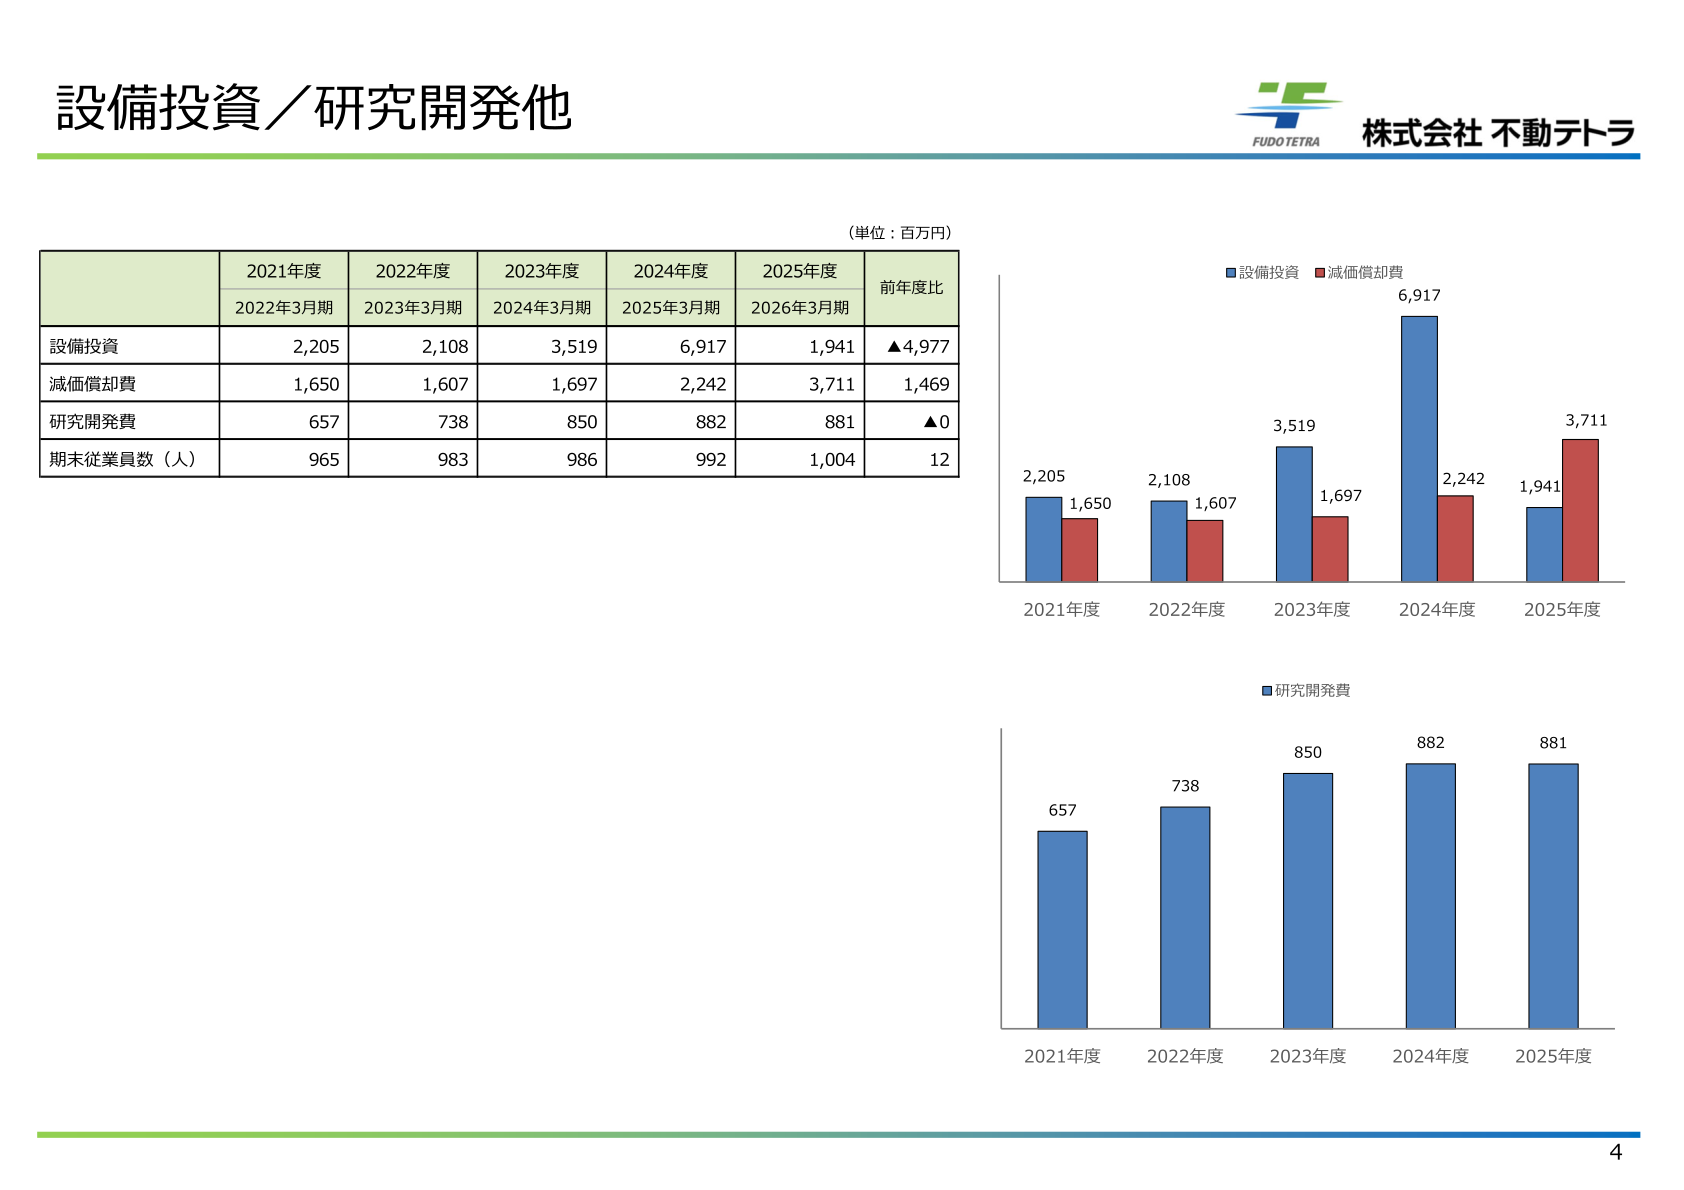
Earnings per share (EPS) was ¥294.6 (previous fiscal year: ¥145.3), net assets per share (BPS) ¥2,513.5 (previous fiscal year: ¥2,263.0), return on equity (ROE) 12.3% (previous fiscal year: 6.6%), the price-earnings ratio (PER) 10.0 times (previous fiscal year: 15.3 times) and the price-to-book ratio (PBR) 1.2 times (previous fiscal year: 1.0 times). Capital expenditure was 1,941 million yen (previous fiscal year: 6,917 million yen), depreciation 3,711 million yen (previous fiscal year: 2,242 million yen), research and development expenses 881 million yen (previous fiscal year: 882 million yen), and the number of employees at the end of the period 1,004 (previous fiscal year: 992).
This article is an analysis based on publicly available information and is not a recommendation to buy or sell any specific securities. Investment decisions are your own responsibility.
















