
This article is based on publicly available IR materials and is not a recommendation to buy or sell any specific securities.
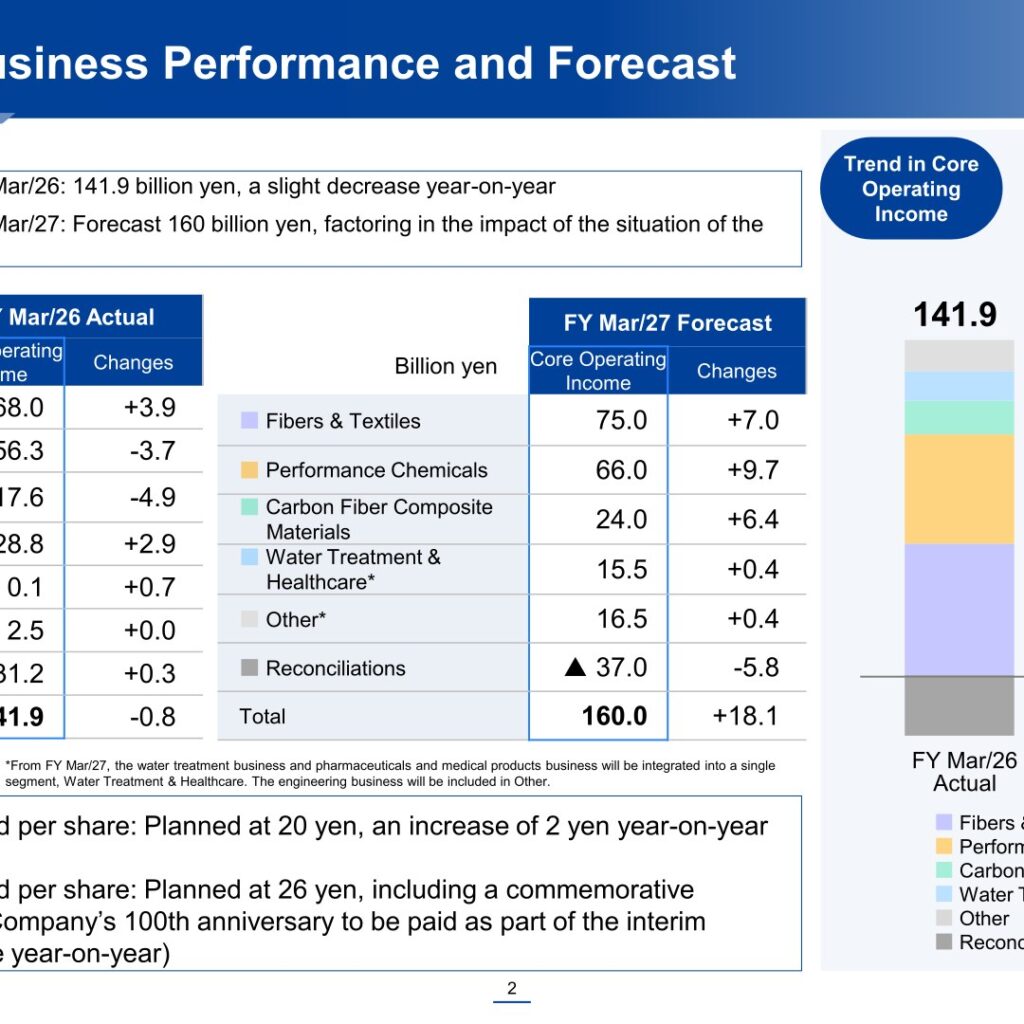
Toray Industries reported consolidated revenue of 2,585.1 billion yen for the fiscal year ended March 2026 (FY2025), up 0.9% year on year, while core operating income declined 0.6% to 141.9 billion yen amid weak market conditions in Performance Chemicals and demand correction in industrial applications of Carbon Fiber Composite Materials. Profit attributable to owners of parent rose 2.1% to 79.5 billion yen, helped by a swing to a 21.5 billion yen gain from equity-method investments from a 2.4 billion yen loss the prior year, which more than offset an increase in special losses to 44.7 billion yen from 15.3 billion yen. For FY2026, Toray forecasts revenue of 2,830.0 billion yen (+9.5%) and core operating income of 160.0 billion yen (+12.7%), factoring in risks associated with the Middle East situation, and plans an annual dividend of 26 yen per share including a 3 yen commemorative dividend for the Company’s 100th anniversary.
Consolidated Results (Full-Year Actual)
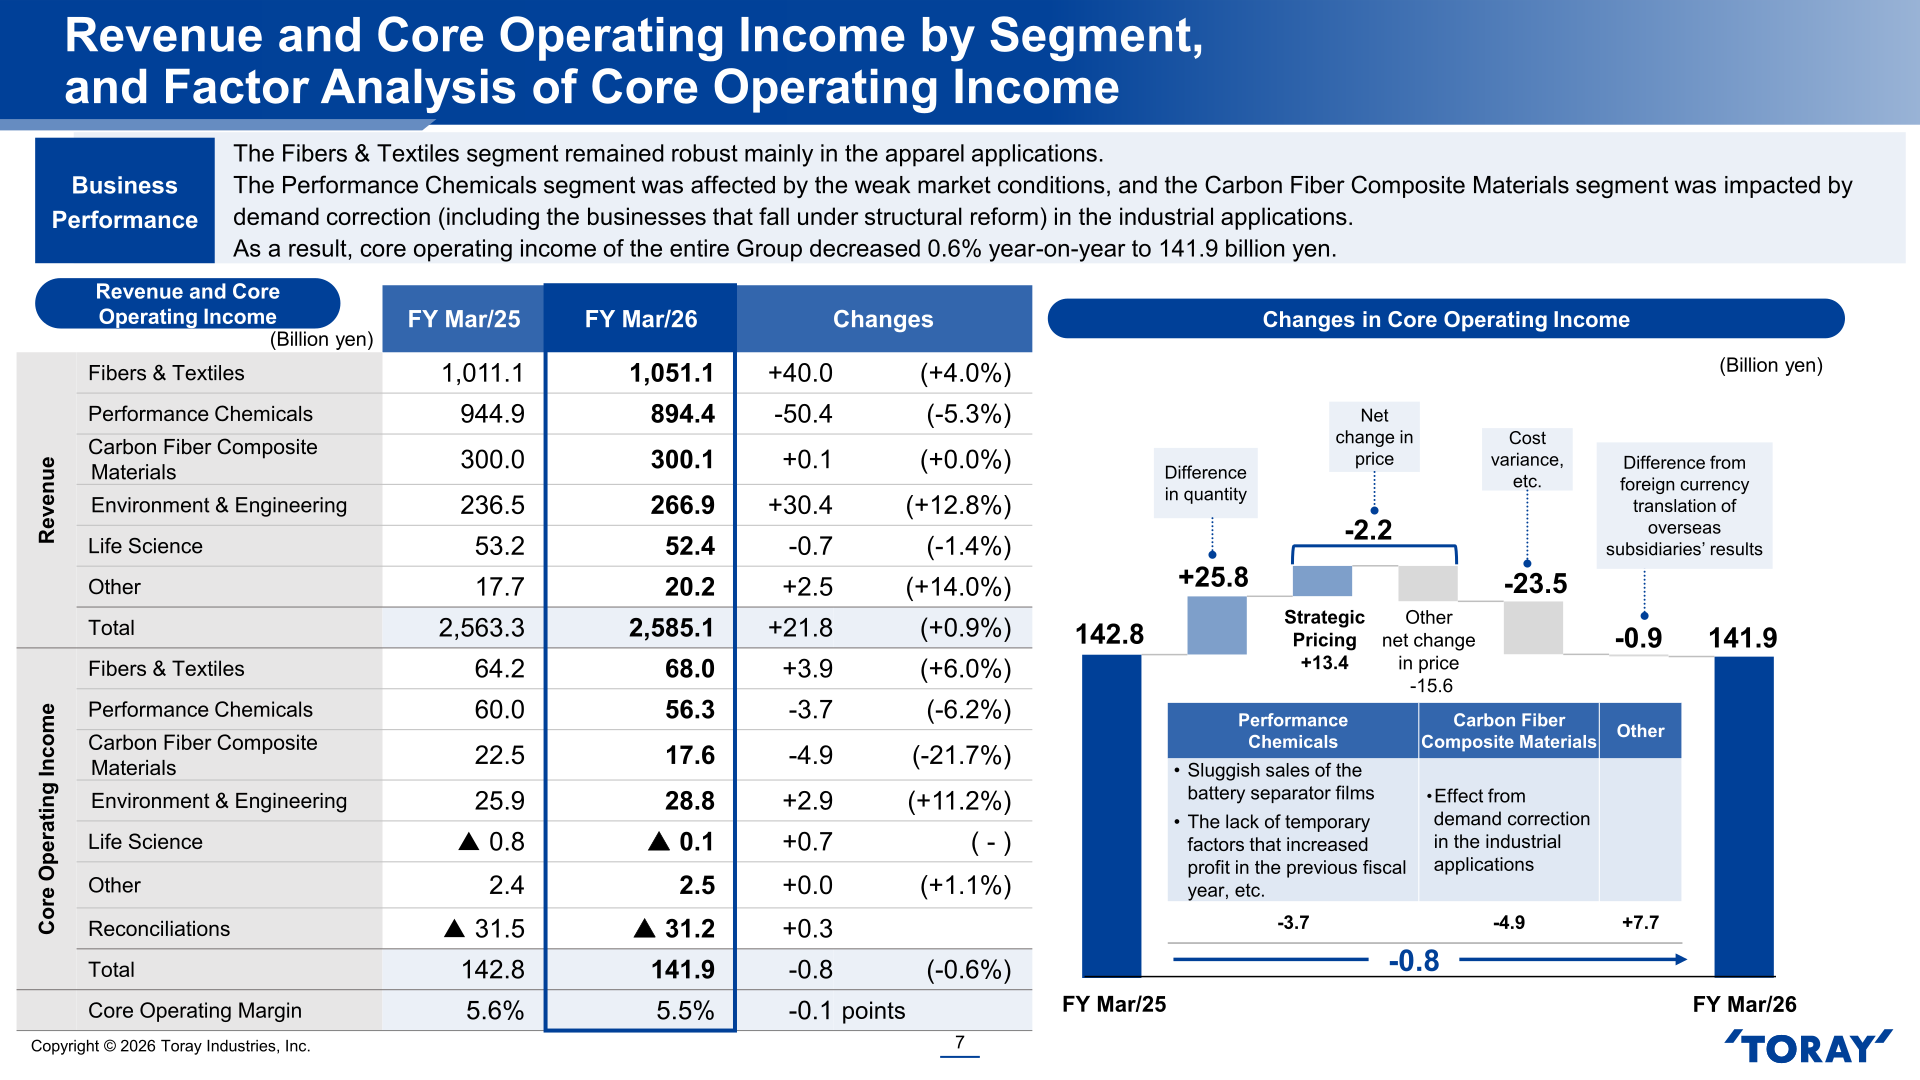
Revenue for FY2025 (fiscal year ended March 2026) was 2,585.1 billion yen and core operating income was 141.9 billion yen, with core operating margin at 5.5%. Profit before tax declined 5.9% to 107.6 billion yen on higher special losses, but profit attributable to owners of parent increased 2.1% to 79.5 billion yen, supported by the swing in equity-method investment results. Earnings per share rose to 52.96 yen from 48.93 yen, and the annual dividend per share increased to 20.00 yen from 18.00 yen.
| Item | FY2025 (2025.4-2026.3) | FY2024 (2024.4-2025.3) | Change |
|---|---|---|---|
| Revenue (billion yen) | 2,585.1 | 2,563.3 | +21.8 (+0.9%) |
| Core Operating Income (billion yen) | 141.9 | 142.8 | -0.8 (-0.6%) |
| Core Operating Margin | 5.5% | 5.6% | -0.1 points |
| Special Items (billion yen) | ▲44.7 | ▲15.3 | -29.4 |
| Finance Income and Costs (billion yen) | ▲11.2 | ▲10.8 | -0.3 |
| Share of Profit (Loss) of Investments Accounted for Using Equity Method (billion yen) | 21.5 | ▲2.4 | +23.9 |
| Profit Before Tax (billion yen) | 107.6 | 114.3 | -6.7 (-5.9%) |
| Profit Attributable to Owners of Parent (billion yen) | 79.5 | 77.9 | +1.6 (+2.1%) |
| Earnings per Share | 52.96 yen | 48.93 yen | – |
| Dividend per Share | 20.00 yen | 18.00 yen | – |
| ROIC | 4.7% | 4.4% | – |
| ROE | 4.5% | 4.5% | – |
Segment Results
The Fibers & Textiles segment increased both revenue and core operating income, remaining robust mainly in apparel applications despite stagnation in the European market and continued competition with overseas products. The Performance Chemicals segment was affected by weak market conditions, including a stagnant resins business linked to the automotive applications slowdown and sluggish sales of battery separator film. The Carbon Fiber Composite Materials segment’s core operating income fell 21.7%, impacted by demand correction in industrial applications, including businesses that fall under structural reform, though aerospace application sales continued to recover as inventory adjustment in the supply chain eased. The Environment & Engineering segment grew, supported by solid reverse osmosis (RO) membrane sales for the Middle East and plant construction projects in Japan, as well as strong results at Japanese engineering and construction subsidiaries, even as the water treatment business was affected by stagnant market conditions in China and intensified competition.
| Segment | Metric | FY2025 (2025.4-2026.3) | FY2024 (2024.4-2025.3) |
|---|---|---|---|
| Fibers & Textiles | Revenue (billion yen) | 1,051.1 | 1,011.1 |
| Fibers & Textiles | Core Operating Income (billion yen) | 68.0 | 64.2 |
| Performance Chemicals | Revenue (billion yen) | 894.4 | 944.9 |
| Performance Chemicals | Core Operating Income (billion yen) | 56.3 | 60.0 |
| Carbon Fiber Composite Materials | Revenue (billion yen) | 300.1 | 300.0 |
| Carbon Fiber Composite Materials | Core Operating Income (billion yen) | 17.6 | 22.5 |
| Environment & Engineering | Revenue (billion yen) | 266.9 | 236.5 |
| Environment & Engineering | Core Operating Income (billion yen) | 28.8 | 25.9 |
| Life Science | Revenue (billion yen) | 52.4 | 53.2 |
| Life Science | Core Operating Income (billion yen) | ▲0.1 | ▲0.8 |
| Other | Revenue (billion yen) | 20.2 | 17.7 |
| Other | Core Operating Income (billion yen) | 2.5 | 2.4 |
| Reconciliations | Core Operating Income (billion yen) | ▲31.2 | ▲31.5 |
| Total | Revenue (billion yen) | 2,585.1 | 2,563.3 |
| Total | Core Operating Income (billion yen) | 141.9 | 142.8 |
FY2026 Forecast
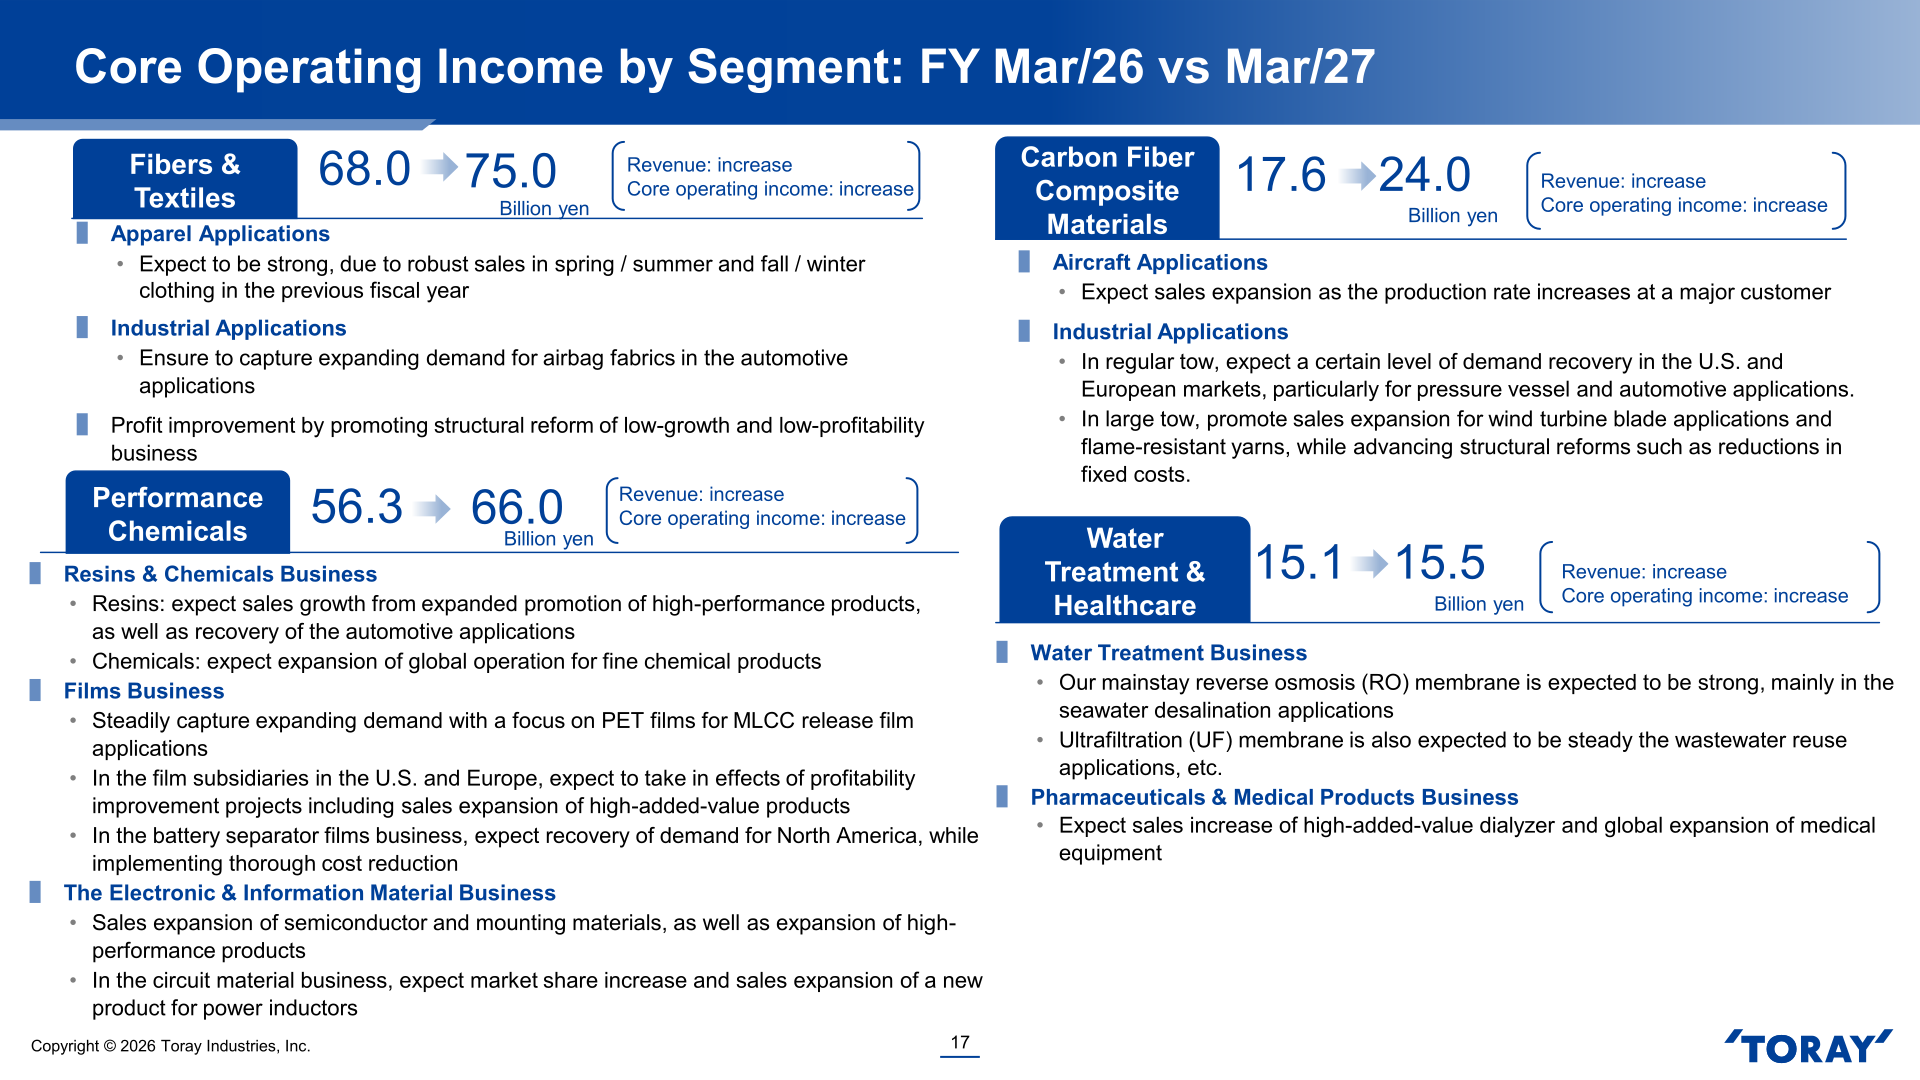
For FY2026 (fiscal year ending March 2027), Toray forecasts revenue of 2,830.0 billion yen, up 9.5% year on year, and core operating income of 160.0 billion yen, up 12.7%, reflecting expected demand expansion in growth business fields across the Fibers & Textiles, Performance Chemicals, and Carbon Fiber Composite Materials segments, together with the effects of strategic pricing and profitability improvement projects. The forecast factors in risks associated with the Middle East situation. Profit attributable to owners of parent is forecast at 90.0 billion yen (+13.2%), and basic earnings per share is forecast at 61.82 yen. The assumed exchange rate is 150 yen per US dollar.
| Item | FY2026 Forecast (2026.4-2027.3) | FY2025 (Actual) |
|---|---|---|
| Revenue (billion yen) | 2,830.0 | 2,585.1 |
| Core Operating Income (billion yen) | 160.0 | 141.9 |
| Core Operating Margin | 5.7% | 5.5% |
| Profit Attributable to Owners of Parent (billion yen) | 90.0 | 79.5 |
| Basic Earnings per Share | 61.82 yen | 52.96 yen |
| Dividend per Share | 26.00 yen | 20.00 yen |
| Dividend Payout Ratio | 42% | 38% |
| Assumed Exchange Rate (Yen/US$) | 150 | 150.8 (Average) |
From FY2026, Toray will integrate the water treatment business and the pharmaceuticals and medical products business into a single segment, Water Treatment & Healthcare, while the engineering business will be included in Other; the FY2025 actual figures below are shown on this restated segment basis for comparison with the FY2026 forecast.
| Segment | FY2026 Forecast Revenue (billion yen) | FY2025 Actual Revenue* (billion yen) | FY2026 Forecast Core Operating Income (billion yen) | FY2025 Actual Core Operating Income* (billion yen) |
|---|---|---|---|---|
| Fibers & Textiles | 1,100.0 | 1,051.1 | 75.0 | 68.0 |
| Performance Chemicals | 1,020.0 | 894.4 | 66.0 | 56.3 |
| Carbon Fiber Composite Materials | 345.0 | 300.1 | 24.0 | 17.6 |
| Water Treatment & Healthcare | 180.0 | 166.8 | 15.5 | 15.1 |
| Other | 185.0 | 172.6 | 16.5 | 16.1 |
| Reconciliations | – | – | ▲37.0 | ▲31.2 |
| Total | 2,830.0 | 2,585.1 | 160.0 | 141.9 |
Shareholder Returns
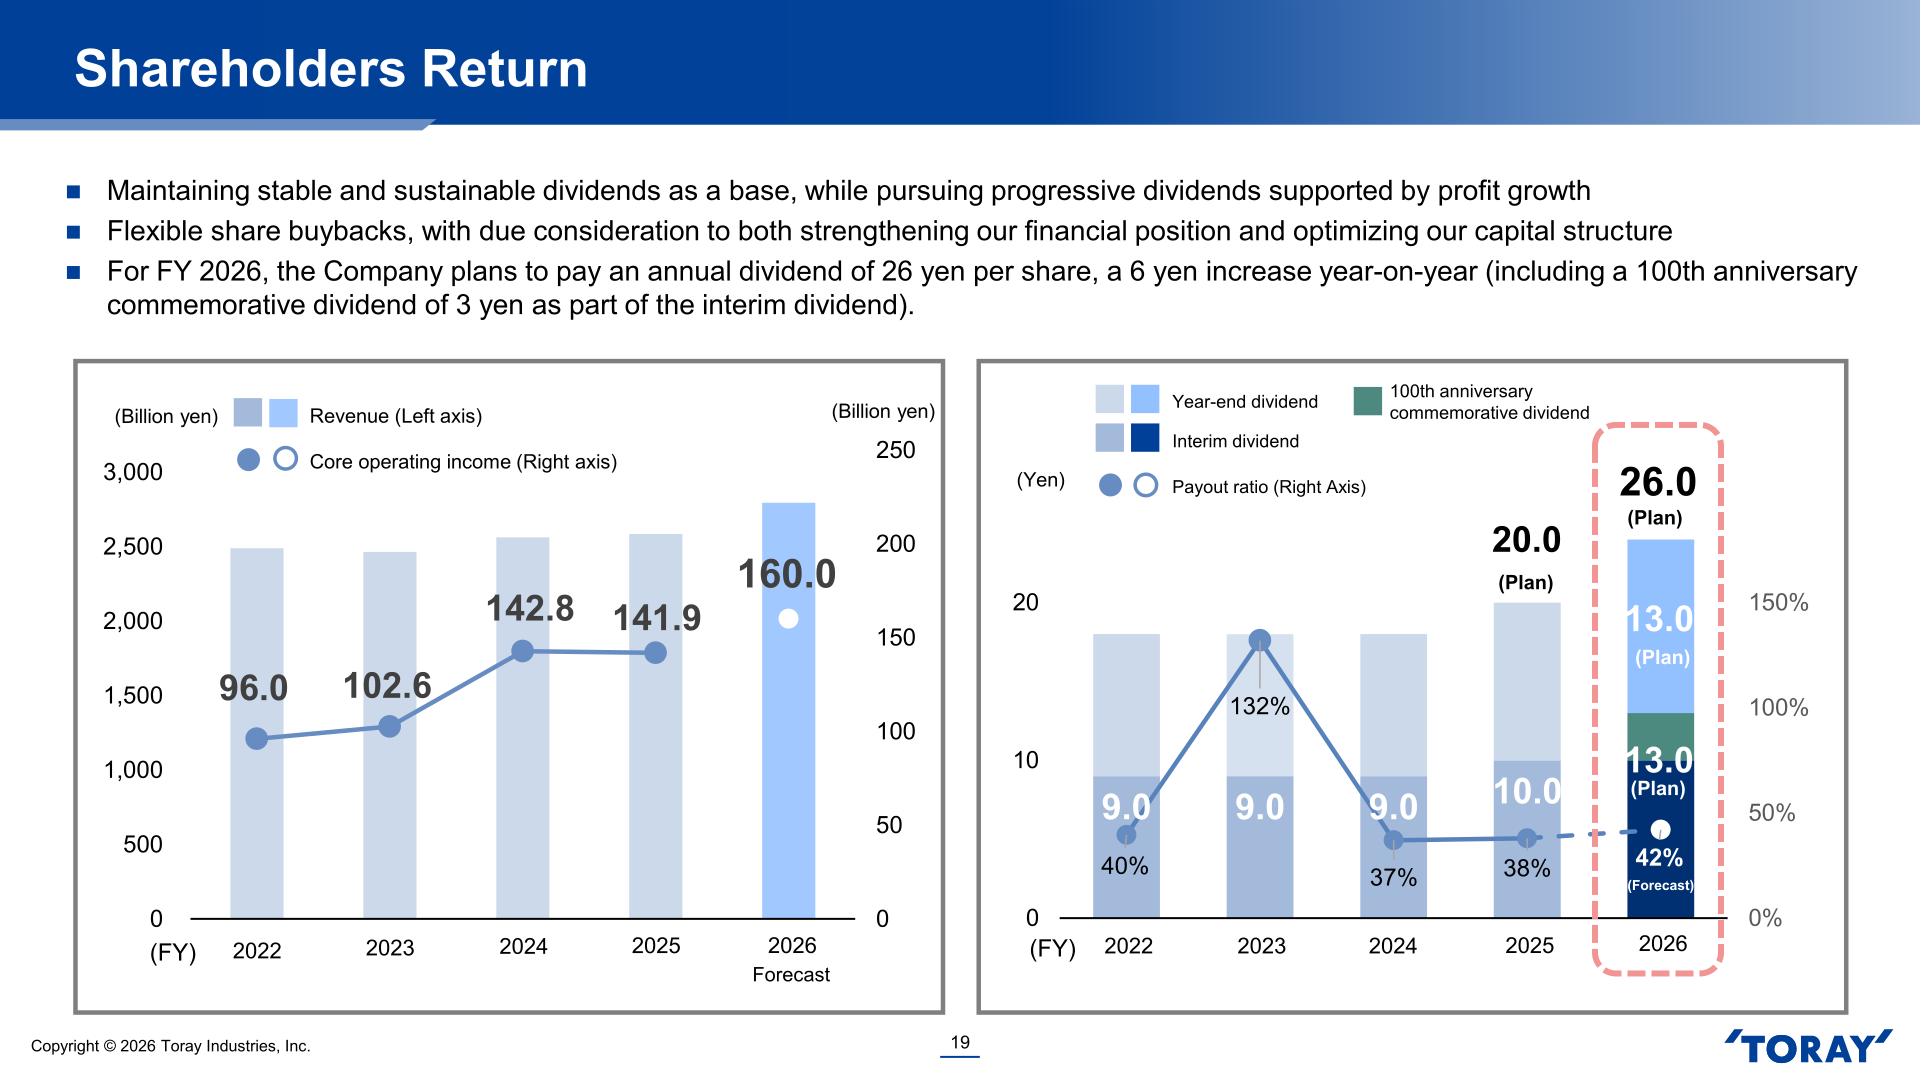
Toray plans an annual dividend per share of 20 yen for FY2025 (up 2 yen year on year) and 26 yen for FY2026 (up 6 yen year on year), which includes a 3 yen commemorative dividend for the Company’s 100th anniversary to be paid as part of the interim dividend. The dividend payout ratio is expected to rise to 42% for FY2026 from 38% for FY2025. The Company’s shareholder return policy is to maintain stable and sustainable dividends as a base while pursuing progressive dividends supported by profit growth, and to conduct flexible share buybacks with due consideration to both strengthening its financial position and optimizing its capital structure.
Medium-Term Plan / Topics
Under the AP-G 2025 medium-term management plan, FY2025 (fiscal year ended March 2026) results remained below the plan’s FY2025 targets for revenue, core operating income, core operating margin, ROIC and ROE, while free cash flow was positive for the year and the D/E ratio of 0.50 stayed within the 0.7-or-lower guideline.
| Metric | FY2023 Actual | FY2024 Actual | FY2025 Actual | AP-G 2025 FY2025 Target |
|---|---|---|---|---|
| Revenue (billion yen) | 2,464.6 | 2,563.3 | 2,585.1 | 2,800.0 |
| Core Operating Income (billion yen) | 102.6 | 142.8 | 141.9 | 180.0 |
| Core Operating Margin | 4.2% | 5.6% | 5.5% | 6% |
| ROIC | 2.8% | 4.4% | 4.7% | Around 5% |
| ROE | 1.3% | 4.5% | 4.5% | Around 8% |
| Free Cash Flow (billion yen) | 64.7 | 191.8 | 144.8 | Positive (3-year total) |
| D/E Ratio | 0.55 | 0.49 | 0.50 | 0.7 or lower (Guideline) |
The Group’s Total Cost Down Project delivered a cumulative cost reduction of 216.6 billion yen over FY2023-FY2025 (variable cost reduction activities: 134.7 billion yen versus a 125.0 billion yen target; fixed cost reduction activities: 68.6 billion yen versus a 60.0 billion yen target; production process innovations: 13.3 billion yen versus a 15.0 billion yen target), exceeding the Group’s 3-year cumulative target of 200.0 billion yen.
This article is an analysis based on publicly available information and is not a recommendation to buy or sell any specific securities. Investment decisions are your own responsibility.
![[Obayashi] Investors’ Guide 2026 — The Complete 24-Article Breakdown](https://japan-equity.com/wp-content/uploads/2026/07/hub_cover-1024x1024.png)
![[Obayashi] IR & SR Policy — Feeding Dialogue Back into Management](https://japan-equity.com/wp-content/uploads/2026/07/p32_sq-1024x1024.jpg)
![[Obayashi] Real Estate Development — 18.7% Margin, ¥287.7bn Unrealized Gains](https://japan-equity.com/wp-content/uploads/2026/07/p20_sq-1024x1024.jpg)
![[Obayashi] Domestic Civil Engineering — Resilience Spending Supports 9.6% Margin](https://japan-equity.com/wp-content/uploads/2026/07/p11_sq-1024x1024.jpg)
![[Obayashi] Share Price & External Ratings — vs TOPIX, ESG Index Inclusion](https://japan-equity.com/wp-content/uploads/2026/07/p40_sq-1024x1024.jpg)
![[Construction] ¥75.5tn Investment, Shrinking Workforce — Big-5 Market Share](https://japan-equity.com/wp-content/uploads/2026/07/p12_sq-1024x1024.jpg)



![[Obayashi] Capital Policy & Shareholder Returns — ROE 10%+, DOE ~5%, ¥100bn Buyback](https://japan-equity.com/wp-content/uploads/2026/07/p27_sq-1024x1024.jpg)
![[Obayashi] Reducing Cross-Shareholdings — ¥285.2bn Sold in Five Years](https://japan-equity.com/wp-content/uploads/2026/07/p29_sq-1024x1024.jpg)
![[Obayashi] ¥750bn Investment Plan — ¥300bn to Development, ¥190bn to Tech/DX](https://japan-equity.com/wp-content/uploads/2026/07/p30_sq-1024x1024.jpg)
![[Obayashi] MTP2022 KPIs — Operating Profit ~2x Target, ROE 14.4%](https://japan-equity.com/wp-content/uploads/2026/07/p25_sq-1024x1024.jpg)
![[Obayashi] Cash Allocation — ¥420bn Investment CF Over Five Years](https://japan-equity.com/wp-content/uploads/2026/07/p26_sq-1024x1024.jpg)
![[Obayashi] Green Energy — 44 Plants, 344MW, and the Green Hydrogen Challenge](https://japan-equity.com/wp-content/uploads/2026/07/p21_sq-1024x1024.jpg)
![[Obayashi] Tackling the Labor Shortage — Robotics Construction®](https://japan-equity.com/wp-content/uploads/2026/07/p14_sq-1024x1024.jpg)
