
This article is based on publicly available IR materials and is not a recommendation to buy or sell any specific securities.
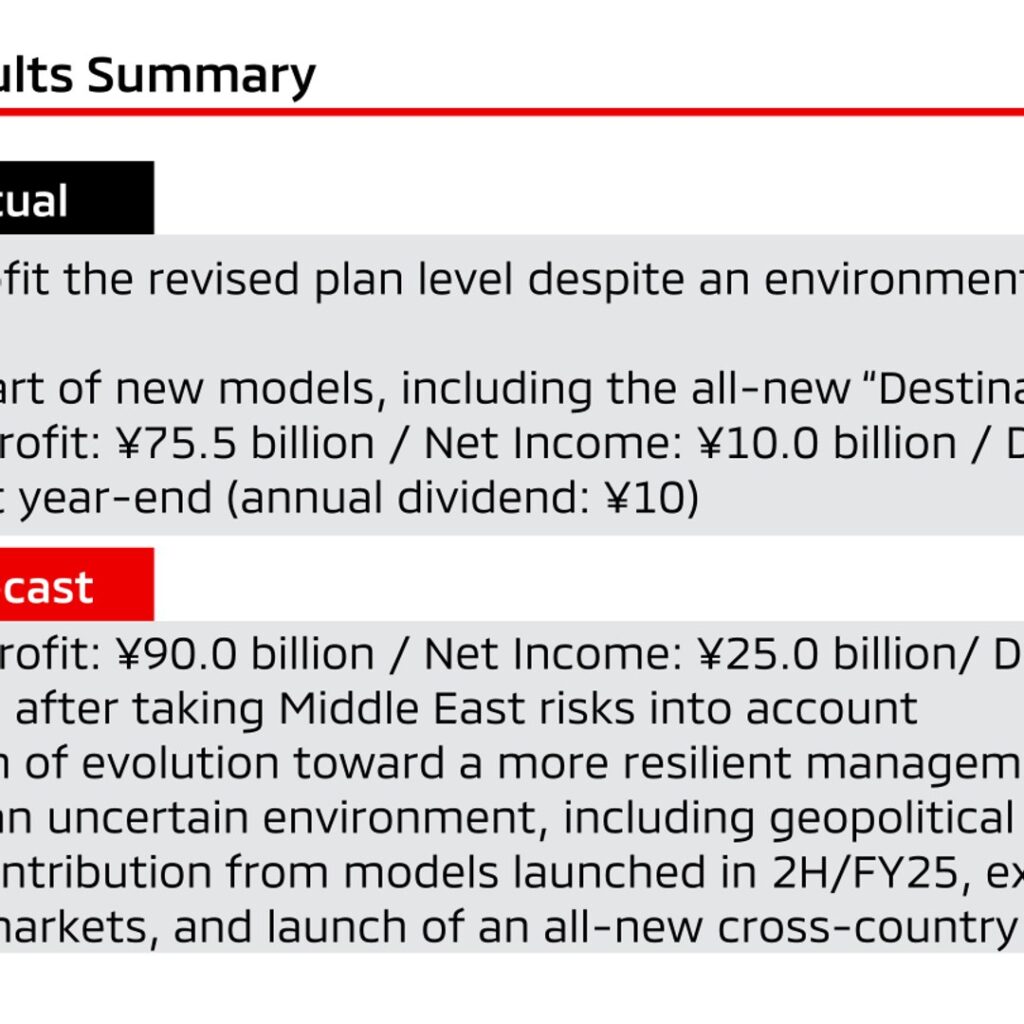
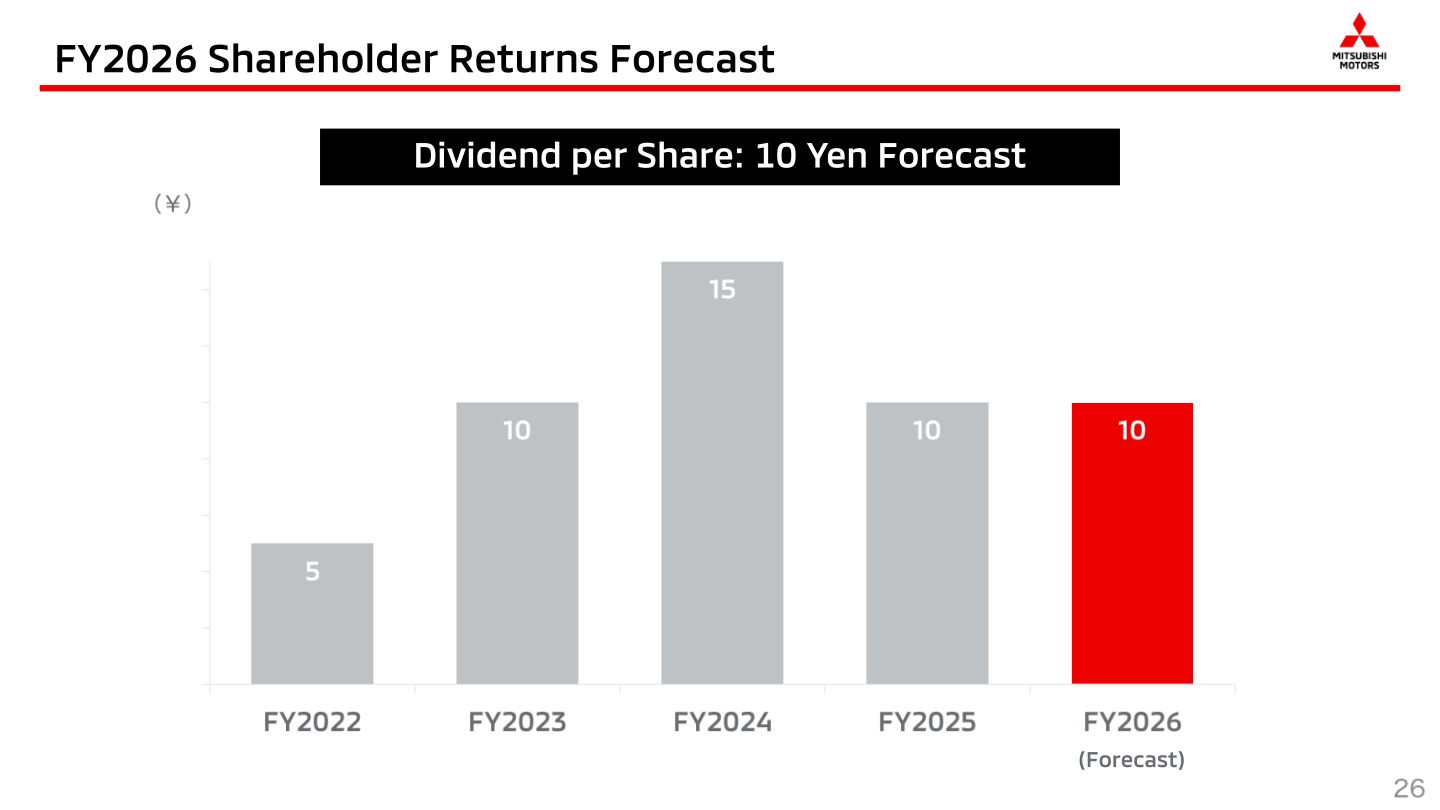
Mitsubishi Motors reported FY2025 (April 2025–March 2026) consolidated net sales of ¥2,896.5 billion, up 4% year on year, but operating profit fell 46% to ¥75.5 billion (OP margin 2.6%) and net income attributable to owners of the parent dropped 76% to ¥10.0 billion, as U.S. tariff payments, incentive pressure and inflation weighed on results. The company said it secured profit at the level of its revised plan despite an increasingly uncertain environment, citing a strong start for new models including the all-new “Destinator”. The annual dividend per share for FY2025 was ¥10 (¥5 at year-end), down from ¥15 in FY2024. For FY2026, Mitsubishi Motors forecasts operating profit of ¥90.0 billion and net income of ¥25.0 billion, after taking Middle East risks into account, with dividend per share forecast at ¥10.
Consolidated Results (Full-Year Actual)
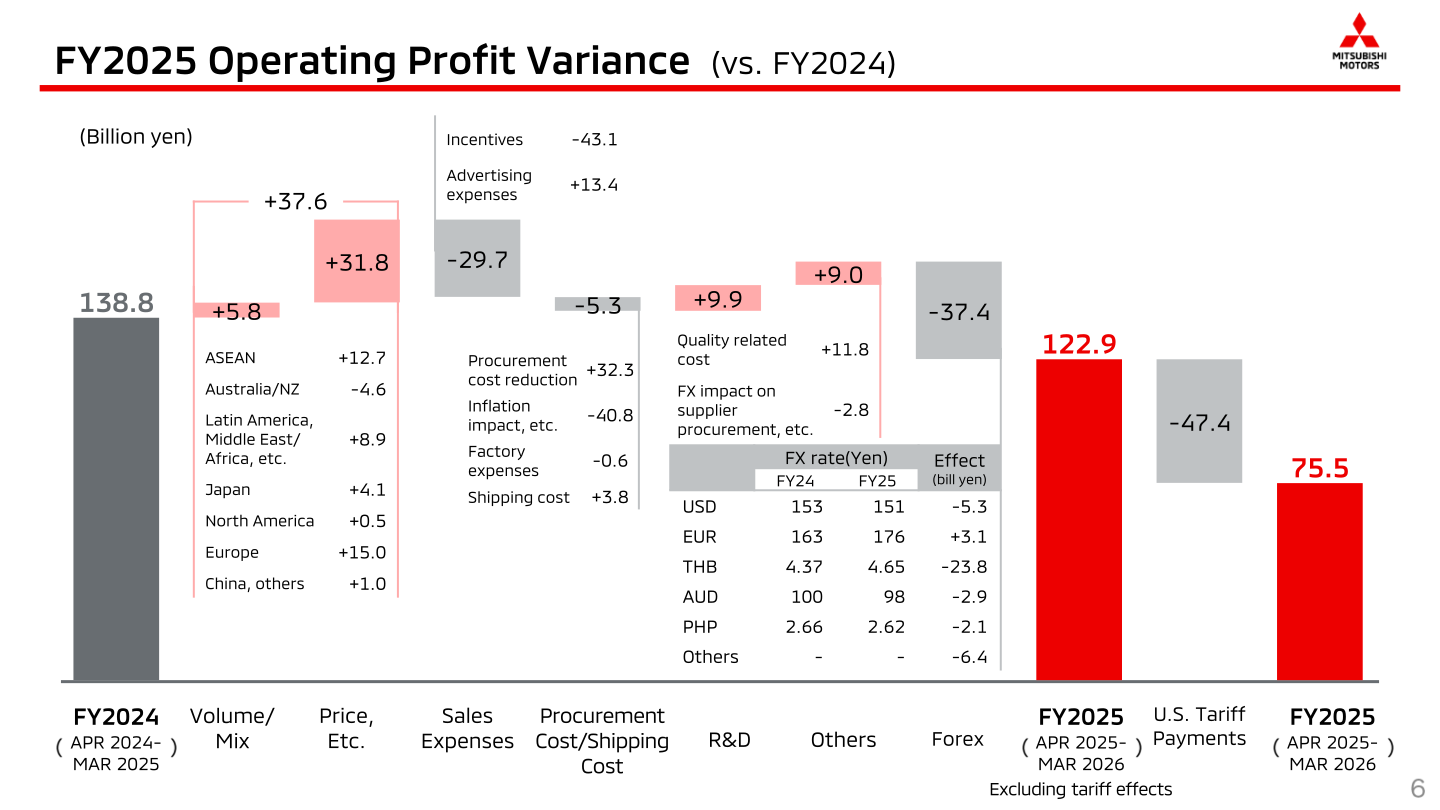
Full-year retail sales volume declined 5% to 797 thousand units (FY2024: 842 thousand units). Ordinary profit fell 20% to ¥78.9 billion. By quarter, operating profit strengthened through the year, from ¥5.6 billion (1Q) and ¥11.7 billion (2Q) to ¥14.3 billion (3Q) and ¥43.9 billion (4Q); net income was negative in 2Q (-¥9.9 billion) before recovering to ¥4.7 billion in 3Q and ¥14.5 billion in 4Q. On a full-year basis excluding U.S. tariff effects, operating profit was ¥122.9 billion; U.S. tariff payments reduced operating profit by ¥47.4 billion. Other key drivers of the year-on-year decline included incentives (-¥43.1 billion), inflation impact, etc. (-¥40.8 billion) and foreign exchange effects (-¥37.4 billion, led by Thai baht appreciation), partly offset by procurement cost reduction (+¥32.3 billion) and a quality related cost improvement (+¥11.8 billion).
| Item | FY2025 | FY2024 | Change |
|---|---|---|---|
| Net Sales (Billion yen) | 2,896.5 | 2,788.2 | +108.3 (+4%) |
| Operating Profit (Billion yen) / OP Margin | 75.5 (2.6%) | 138.8 (5.0%) | -63.3 (-2.4pp) / -46% |
| Ordinary Profit (Billion yen) | 78.9 | 98.6 | -19.7 (-20%) |
| Net Income* (Billion yen) | 10.0 | 41.0 | -31.0 (-76%) |
| Dividend per Share (¥) | ¥10 | ¥15 | – |
| Retail Sales Volume (000 units) | 797 | 842 | -45 (-5%) |
Segment Results
Mitsubishi Motors reports results by region rather than by business segment. In FY2025, net sales grew in Europe (+¥84.9 billion), Japan (+¥27.8 billion), ASEAN (+¥47.1 billion) and China, others (+¥7.6 billion), while Australia/NZ (-¥35.1 billion) and North America (-¥72.5 billion) declined. Regional operating profit fell sharply in North America (¥76.9 billion → ¥19.1 billion) and swung to a loss in Australia/NZ (¥25.2 billion → -¥7.5 billion), while Japan improved to a profit of ¥17.8 billion from a loss of ¥7.4 billion in FY2024. ASEAN, Europe and China, others all posted higher operating profit than FY2024.
| Segment | Metric | FY2025 | FY2024 |
|---|---|---|---|
| GLOBAL | Net Sales (Billion yen) | 2,896.5 | 2,788.2 |
| GLOBAL | Operating Profit (Billion yen) | 75.5 | 138.8 |
| ASEAN | Net Sales (Billion yen) | 613.5 | 566.4 |
| ASEAN | Operating Profit (Billion yen) | 22.9 | 19.8 |
| Australia/NZ | Net Sales (Billion yen) | 286.0 | 321.1 |
| Australia/NZ | Operating Profit (Billion yen) | -7.5 | 25.2 |
| Latin America, Middle East/Africa, etc. | Net Sales (Billion yen) | 452.8 | 404.3 |
| Latin America, Middle East/Africa, etc. | Operating Profit (Billion yen) | 14.3 | 17.2 |
| Japan | Net Sales (Billion yen) | 659.4 | 631.6 |
| Japan | Operating Profit (Billion yen) | 17.8 | -7.4 |
| North America | Net Sales (Billion yen) | 661.7 | 734.2 |
| North America | Operating Profit (Billion yen) | 19.1 | 76.9 |
| Europe | Net Sales (Billion yen) | 212.0 | 127.1 |
| Europe | Operating Profit (Billion yen) | 7.1 | 6.5 |
| China, others | Net Sales (Billion yen) | 11.1 | 3.5 |
| China, others | Operating Profit (Billion yen) | 1.8 | 0.6 |
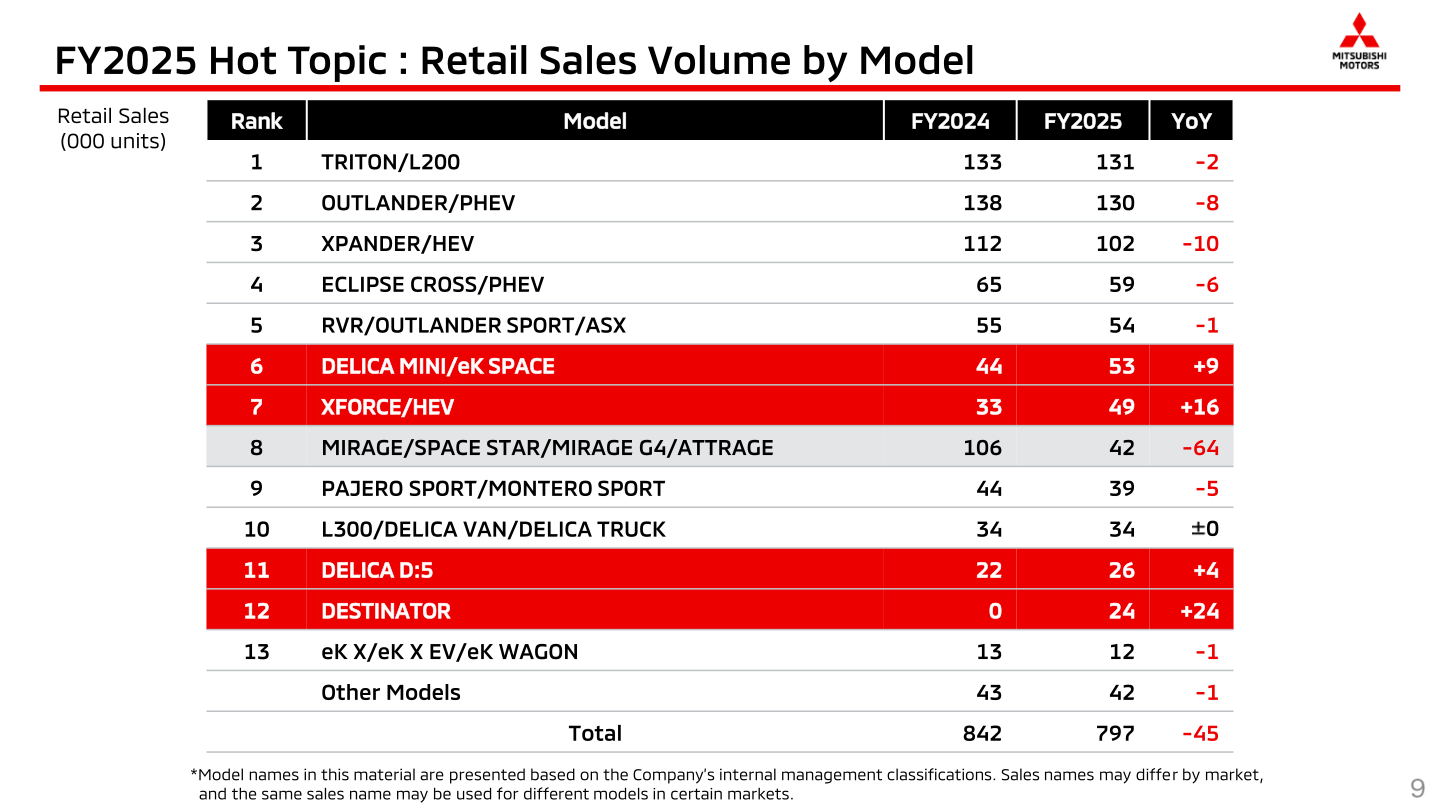
By model, the newly launched “Destinator” contributed 24 thousand retail units in FY2025 (rank 12), while “XFORCE/HEV” rose 16 thousand units to 49 thousand units and “Delica Mini/eK Space” rose 9 thousand units to 53 thousand units. “Outlander/PHEV” remained the No.2 model at 130 thousand units despite an 8 thousand unit decline, while “Mirage/Space Star/Mirage G4/Attrage” fell 64 thousand units to 42 thousand units.
FY2026 Forecast
For FY2026 (April 2026–March 2027), Mitsubishi Motors forecasts net sales of ¥3,260.0 billion (+13%), operating profit of ¥90.0 billion (+19%, OP margin 2.8%), ordinary profit of ¥80.0 billion (+1%) and net income attributable to owners of the parent of ¥25.0 billion (+150%), on retail sales volume of 857 thousand units (+8%). The forecast is made after taking Middle East risks into account. Cost items expected to affect the bridge from FY2025 to FY2026 operating profit include procurement cost reduction (+¥27.8 billion), inflation impact, etc. (-¥49.3 billion), environmental regulatory compliance costs (-¥7.2 billion), factory expenses (-¥7.0 billion) and incentives (-¥7.2 billion), partly offset by advertising expenses (+¥0.4 billion).
| Item | Forecast | FY2025 (Actual) |
|---|---|---|
| Net Sales (Billion yen) | 3,260.0 | 2,896.5 |
| Operating Profit (Billion yen) / OP Margin | 90.0 (2.8%) | 75.5 (2.6%) |
| Ordinary Profit (Billion yen) | 80.0 | 78.9 |
| Net Income* (Billion yen) | 25.0 | 10.0 |
| Dividend per Share (¥) | ¥10 | ¥10 |
| Retail Sales Volume (000 units) | 857 | 797 |
| Region | Net Sales FY2026 Forecast | Net Sales FY2025 (Actual) | Change |
|---|---|---|---|
| GLOBAL | 3,260.0 | 2,896.5 | +363.5 |
| ASEAN | 710.0 | 613.5 | +96.5 |
| Australia/NZ | 335.0 | 286.0 | +49.0 |
| Latin America, Middle East/Africa, etc. | 460.0 | 452.8 | +7.2 |
| Japan | 765.0 | 659.4 | +105.6 |
| North America | 710.0 | 661.7 | +48.3 |
| Europe | 270.0 | 212.0 | +58.0 |
| China, others | 10.0 | 11.1 | -1.1 |
FY2026 Initiatives
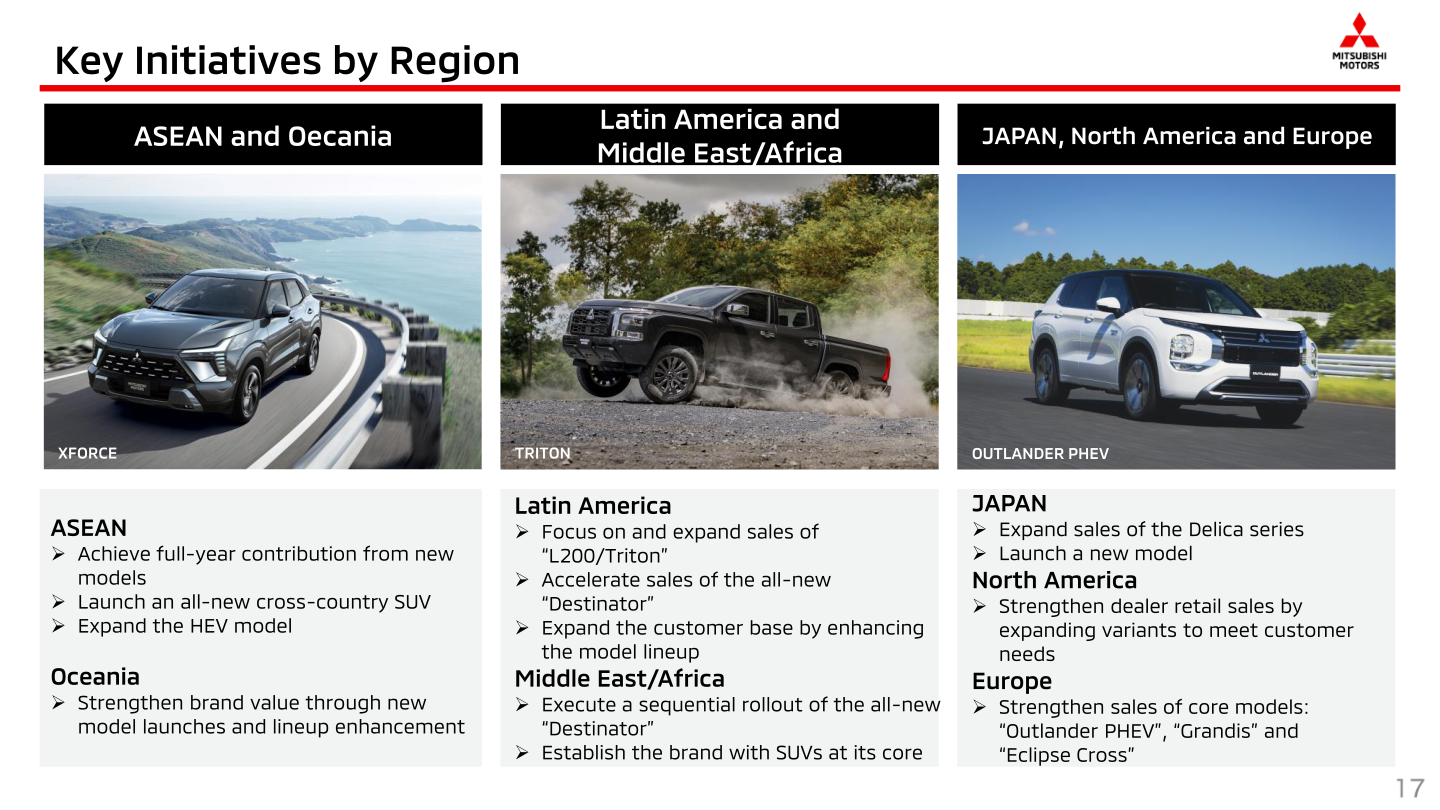
Mitsubishi Motors plans to grow retail sales volume from 797 thousand units in FY2025 to 857 thousand units in FY2026 (+60 thousand units), driven in part by its ASEAN strategic models — XPANDER (ICE/HEV), XFORCE (ICE/HEV) and DESTINATOR — which are forecast to increase from 174 thousand units to 221 thousand units (+47 thousand units). By region, key initiatives include: ASEAN — achieve full-year contribution from new models, launch an all-new cross-country SUV, and expand the HEV model; Oceania — strengthen brand value through new model launches and lineup enhancement; Latin America — focus on and expand sales of “L200/Triton” and accelerate sales of the all-new “Destinator”; Middle East/Africa — execute a sequential rollout of the all-new “Destinator” and establish the brand with SUVs at its core; Japan — expand sales of the Delica series and launch a new model; North America — strengthen dealer retail sales by expanding variants; and Europe — strengthen sales of core models “Outlander PHEV”, “Grandis” and “Eclipse Cross”.
Shareholder Returns
Mitsubishi Motors paid a full-year dividend per share of ¥10 for FY2025 (¥5 at year-end), down from ¥15 in FY2024. For FY2026, the company forecasts a dividend per share of ¥10, unchanged from FY2025, after taking Middle East risks into account.
This article is an analysis based on publicly available information and is not a recommendation to buy or sell any specific securities. Investment decisions are your own responsibility.
![[Obayashi] Investors’ Guide 2026 — The Complete 24-Article Breakdown](https://japan-equity.com/wp-content/uploads/2026/07/hub_cover-1024x1024.png)
![[Obayashi] IR & SR Policy — Feeding Dialogue Back into Management](https://japan-equity.com/wp-content/uploads/2026/07/p32_sq-1024x1024.jpg)
![[Obayashi] Real Estate Development — 18.7% Margin, ¥287.7bn Unrealized Gains](https://japan-equity.com/wp-content/uploads/2026/07/p20_sq-1024x1024.jpg)
![[Obayashi] Domestic Civil Engineering — Resilience Spending Supports 9.6% Margin](https://japan-equity.com/wp-content/uploads/2026/07/p11_sq-1024x1024.jpg)
![[Obayashi] Share Price & External Ratings — vs TOPIX, ESG Index Inclusion](https://japan-equity.com/wp-content/uploads/2026/07/p40_sq-1024x1024.jpg)
![[Construction] ¥75.5tn Investment, Shrinking Workforce — Big-5 Market Share](https://japan-equity.com/wp-content/uploads/2026/07/p12_sq-1024x1024.jpg)



![[Obayashi] Capital Policy & Shareholder Returns — ROE 10%+, DOE ~5%, ¥100bn Buyback](https://japan-equity.com/wp-content/uploads/2026/07/p27_sq-1024x1024.jpg)
![[Obayashi] Reducing Cross-Shareholdings — ¥285.2bn Sold in Five Years](https://japan-equity.com/wp-content/uploads/2026/07/p29_sq-1024x1024.jpg)
![[Obayashi] ¥750bn Investment Plan — ¥300bn to Development, ¥190bn to Tech/DX](https://japan-equity.com/wp-content/uploads/2026/07/p30_sq-1024x1024.jpg)
![[Obayashi] MTP2022 KPIs — Operating Profit ~2x Target, ROE 14.4%](https://japan-equity.com/wp-content/uploads/2026/07/p25_sq-1024x1024.jpg)
![[Obayashi] Cash Allocation — ¥420bn Investment CF Over Five Years](https://japan-equity.com/wp-content/uploads/2026/07/p26_sq-1024x1024.jpg)
![[Obayashi] Green Energy — 44 Plants, 344MW, and the Green Hydrogen Challenge](https://japan-equity.com/wp-content/uploads/2026/07/p21_sq-1024x1024.jpg)
![[Obayashi] Tackling the Labor Shortage — Robotics Construction®](https://japan-equity.com/wp-content/uploads/2026/07/p14_sq-1024x1024.jpg)
