
This article is based on publicly available IR materials and is not a recommendation to buy or sell any specific securities.
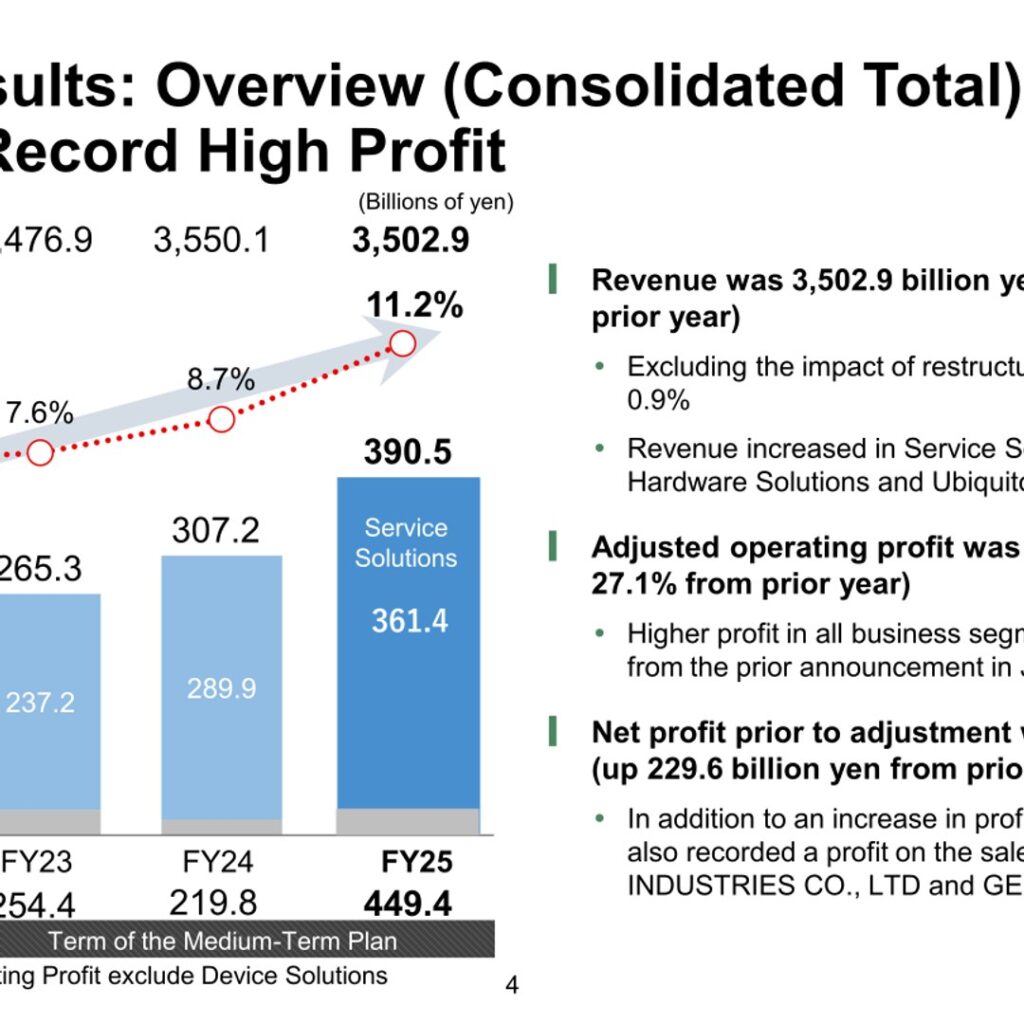
Fujitsu Limited announced its FY2025 consolidated financial results on April 28, 2026, reporting record-high adjusted operating profit of 390.5 billion yen, up 27.1% from the prior year, and an adjusted operating profit margin of 11.2%, up from 8.7%. Revenue declined 1.3% to 3,502.9 billion yen, as growth in Service Solutions was offset by declines in Hardware Solutions and Ubiquitous Solutions; excluding the impact of restructuring, revenue increased 0.9%. Net profit rose 229.6 billion yen to 449.4 billion yen, reflecting higher core business profit as well as gains on the sales of SHINKO ELECTRIC INDUSTRIES CO., LTD. and GENERAL Inc.
Consolidated Results (Full-Year Actual)
Adjusted operating profit of 390.5 billion yen came in 10.5 billion yen above the previous forecast announced in January, with higher profit recorded in all business segments. Adjusted net profit was 298.2 billion yen, up 23.8% from the prior year and 23.2 billion yen above the previous forecast. Net profit prior to adjustment reached 449.4 billion yen, up 104.5% from the prior year and 24.4 billion yen above the previous forecast.
| Item | FY2025 | FY2024 | Change |
|---|---|---|---|
| Revenue | 3,502.9 | 3,550.1 | -47.1 (-1.3%) |
| Adjusted Operating Profit | 390.5 | 307.2 | +83.3 (+27.1%) |
| Adjusted Operating Profit Margin | 11.2% | 8.7% | +2.5% |
| Adjusted Net Profit | 298.2 | 240.9 | +57.3 (+23.8%) |
| Operating Profit (Consolidated, GAAP) | 348.3 | 265.0 | +83.2 (+31.4%) |
| Net Profit | 449.4 | 219.8 | +229.6 (+104.5%) |
Segment Results
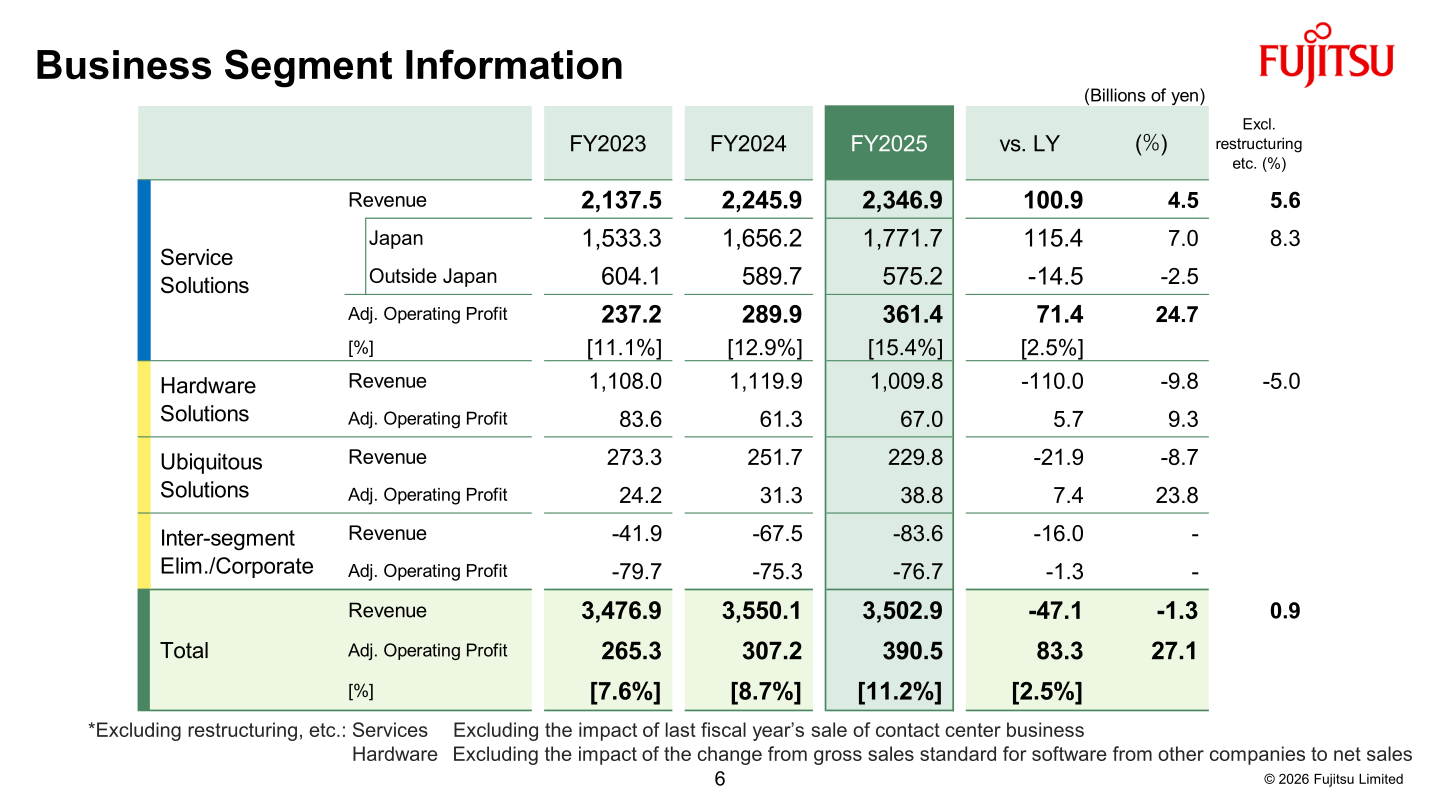
Service Solutions revenue rose 4.5% to 2,346.9 billion yen (up 5.6% excluding restructuring, and up 8.3% in Japan excluding restructuring), with adjusted operating profit up 24.7% to 361.4 billion yen and margin expanding to 15.4% from 12.9%. Hardware Solutions revenue fell 9.8% (down 5.0% excluding restructuring) to 1,009.8 billion yen, while adjusted operating profit rose 9.3% to 67.0 billion yen and margin improved to 6.6% from 5.5%. Ubiquitous Solutions revenue declined 8.7% to 229.8 billion yen, mainly due to the ending of higher demand from the conclusion of Windows 10 support, while adjusted operating profit increased 23.8% to 38.8 billion yen and margin rose to 16.9% from 12.5% on a shift toward higher value-added products.
| Segment | Metric | FY2025 | FY2024 |
|---|---|---|---|
| Service Solutions | Revenue | 2,346.9 | 2,245.9 |
| Service Solutions | Adjusted Operating Profit | 361.4 | 289.9 |
| Service Solutions | Adj. Operating Profit Margin | 15.4% | 12.9% |
| Hardware Solutions | Revenue | 1,009.8 | 1,119.9 |
| Hardware Solutions | Adjusted Operating Profit | 67.0 | 61.3 |
| Hardware Solutions | Adj. Operating Profit Margin | 6.6% | 5.5% |
| Ubiquitous Solutions | Revenue | 229.8 | 251.7 |
| Ubiquitous Solutions | Adjusted Operating Profit | 38.8 | 31.3 |
| Ubiquitous Solutions | Adj. Operating Profit Margin | 16.9% | 12.5% |
| Inter-segment Elim./Corporate | Adjusted Operating Profit | -76.7 | -75.3 |
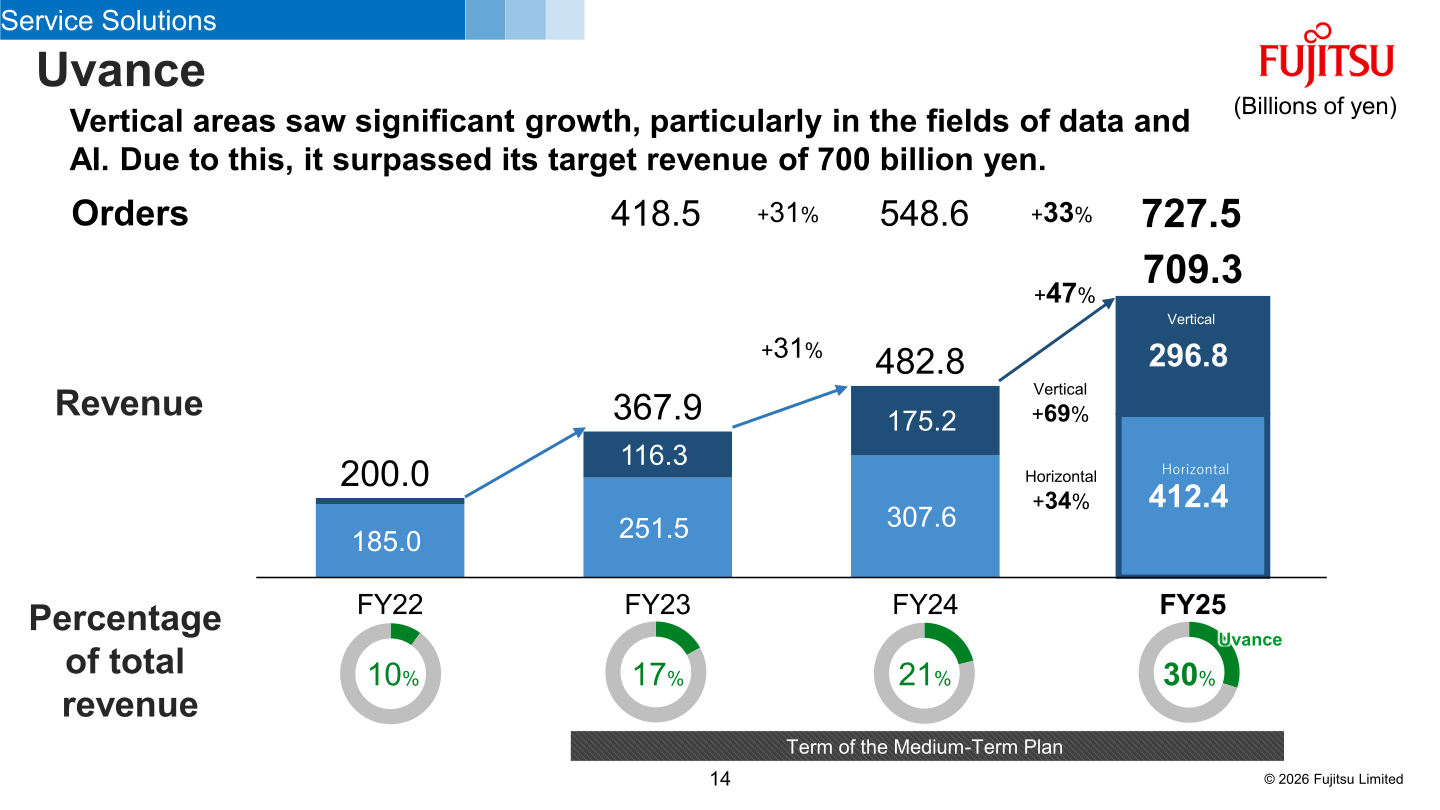
Within Service Solutions, Uvance revenue increased 46.9% to 709.3 billion yen, surpassing its Medium-Term Management Plan target of 700 billion yen on strong growth in vertical areas such as data and AI. Modernization revenue increased 24.2% to 249.7 billion yen; the materials state that group-wide modernization demand was high and surpassed its Medium-Term Management Plan target revenue of 330 billion yen.
| Item | FY2024 | FY2025 | Change |
|---|---|---|---|
| Uvance Revenue | 482.8 | 709.3 | +226.4 (+46.9%) |
| Modernization Revenue (Service Solutions) | 201.0 | 249.7 | +48.7 (+24.2%) |
FY2026 Forecast
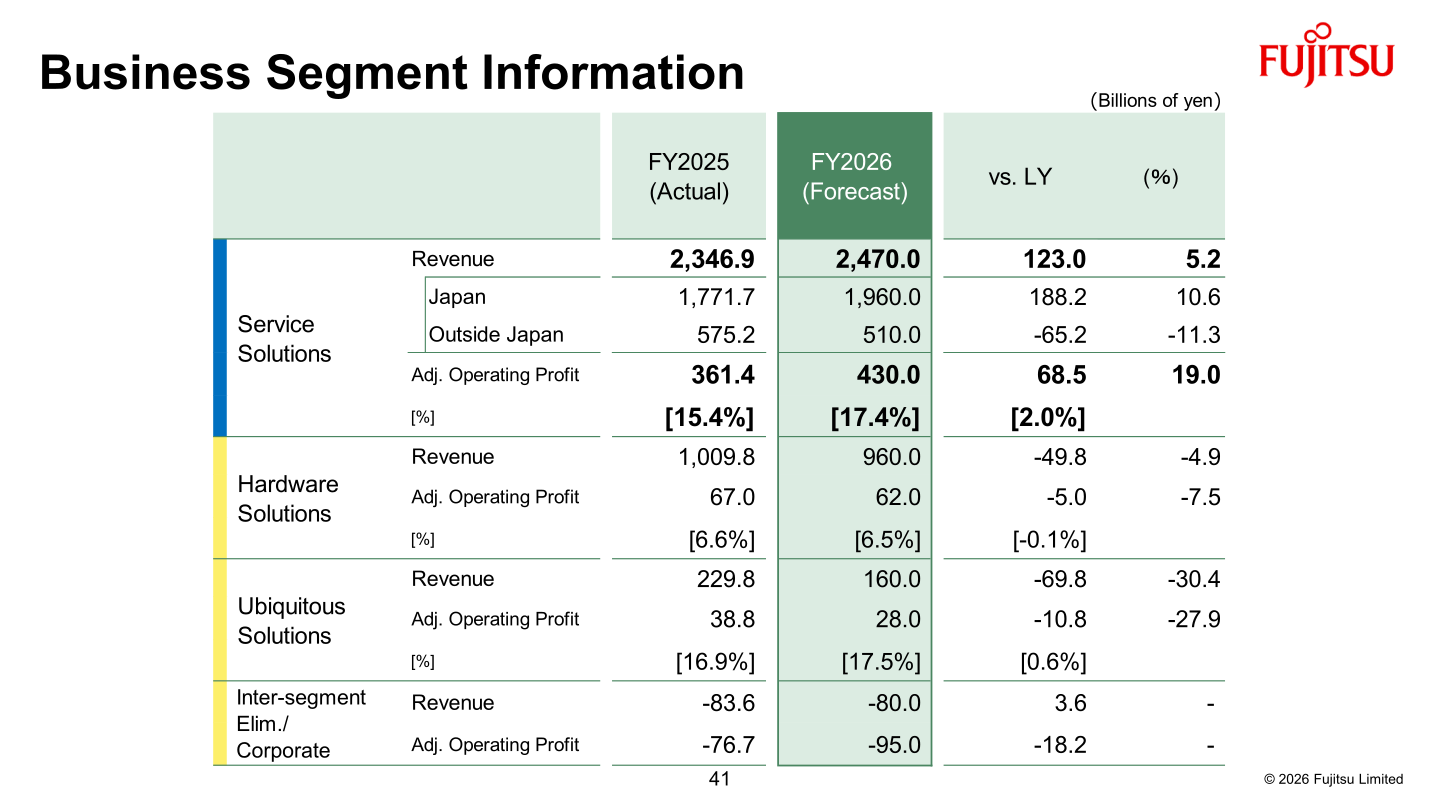
Fujitsu forecasts revenue of 3,510.0 billion yen for FY2026, up 0.2% from FY2025, with adjusted operating profit of 425.0 billion yen (up 8.8%) and an adjusted operating profit margin of 12.1% (up 0.9% from 11.2%). Adjusted net profit is forecast at 320.0 billion yen, up 7.3%. The forecast is based on exchange rate assumptions of 150 yen to the U.S. dollar, 170 yen to the euro, and 195 yen to the British pound. By segment, Service Solutions revenue is forecast to rise 5.2% to 2,470.0 billion yen with adjusted operating profit up 19.0% to 430.0 billion yen (margin 17.4%), while Hardware Solutions revenue is forecast to fall 4.9% to 960.0 billion yen and Ubiquitous Solutions revenue is forecast to fall 30.4% to 160.0 billion yen due to a pullback from the growth in demand driven by the discontinuation of Windows 10 support.
| Item | Forecast | FY2025 (Actual) |
|---|---|---|
| Revenue | 3,510.0 | 3,502.9 |
| Adjusted Operating Profit | 425.0 | 390.5 |
| Adjusted Operating Profit Margin | 12.1% | 11.2% |
| Adjusted Net Profit | 320.0 | 298.2 |
Shareholder Returns
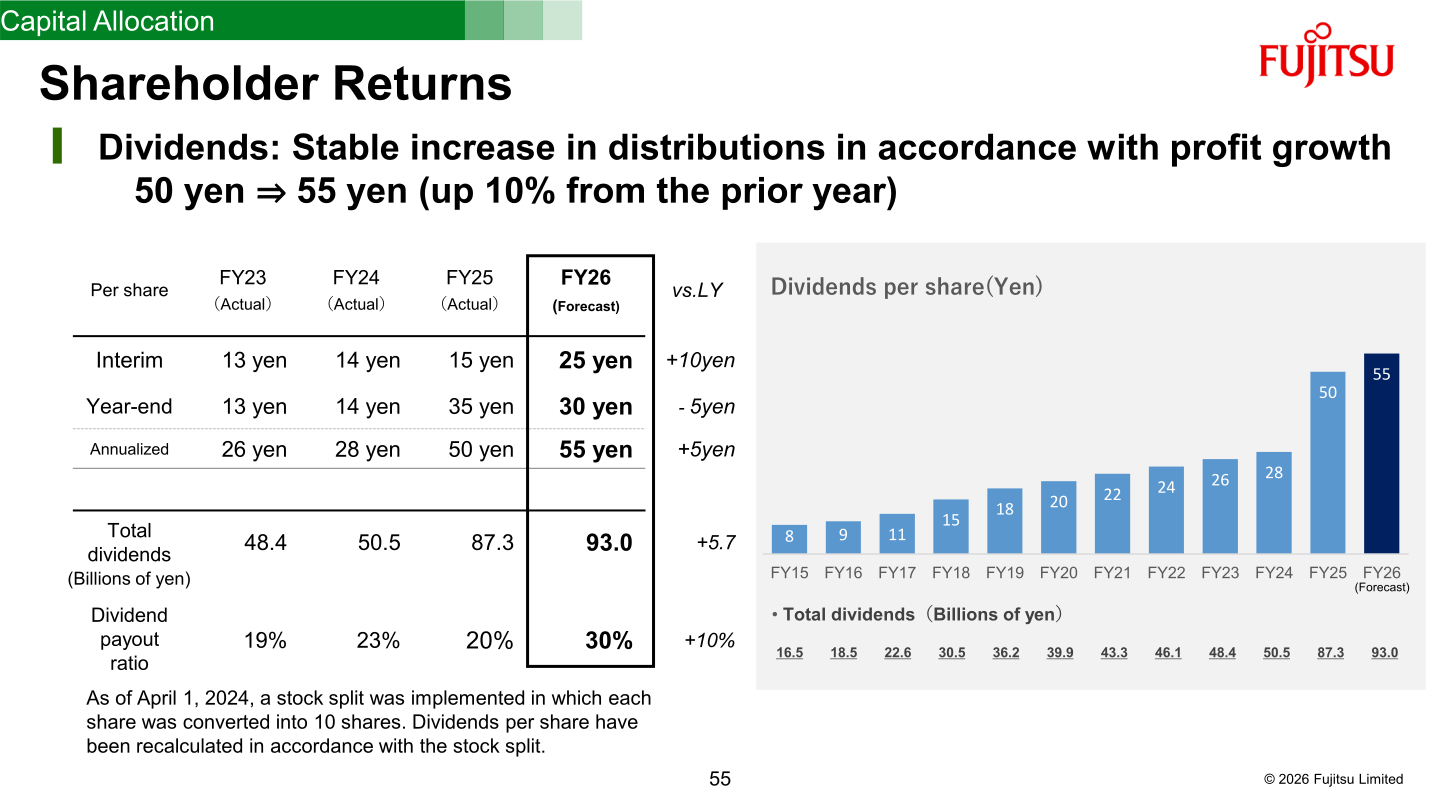
Fujitsu paid an annualized dividend of 50 yen per share for FY2025 (interim 15 yen, year-end 35 yen), up 22 yen from FY2024, for total dividends of 87.3 billion yen and a dividend payout ratio of 20%. Share buybacks in FY2025 totaled 170.0 billion yen, resulting in a total shareholder return ratio of 57%. All shares held as treasury stock at the end of FY2025 were cancelled. Over the three years of the FY23-25 Medium-Term Management Plan, cumulative dividends were 186.2 billion yen and cumulative share buybacks were 639.3 billion yen, for a three-year average total return ratio of 69%. For FY2026, Fujitsu forecasts an annualized dividend of 55 yen per share (interim 25 yen, year-end 30 yen), up 5 yen from FY2025, with total dividends of 93.0 billion yen, a dividend payout ratio of 30%, share buybacks of 150.0 billion yen, and a total return ratio of 78%.
| Item | FY2025 (Actual) | FY2026 (Forecast) |
|---|---|---|
| Annualized Dividend per Share | 50 yen | 55 yen |
| Total Dividends | 87.3 billion yen | 93.0 billion yen |
| Dividend Payout Ratio | 20% | 30% |
| Share Buybacks | 170.0 billion yen | 150.0 billion yen |
| Total Return Ratio | 57% | 78% |
Medium-Term Plan / Topics
Over the term of the FY23-25 Medium-Term Management Plan, Fujitsu’s consolidated adjusted operating profit margin rose from 7% to 11%, with operating profit growing 1.6 times and Core Free Cash Flow growing 1.8 times versus FY2022. Cumulative base cash flows for FY23-25 totaled 1,349.1 billion yen, allocated toward growth investments of 672.3 billion yen (including Uvance, modernization and consulting, advanced R&D, and strengthening the management foundation) and shareholder returns of 639.3 billion yen. Starting in FY2026, Fujitsu will reclassify its Service Solutions sub-segments from the current ‘Global Solutions / Regions (Japan) / Regions (International)’ structure to ‘Enterprise’ and ‘Public’, in order to strengthen management focus by sector.
This article is an analysis based on publicly available information and is not a recommendation to buy or sell any specific securities. Investment decisions are your own responsibility.
![[Obayashi] Investors’ Guide 2026 — The Complete 24-Article Breakdown](https://japan-equity.com/wp-content/uploads/2026/07/hub_cover-1024x1024.png)
![[Obayashi] IR & SR Policy — Feeding Dialogue Back into Management](https://japan-equity.com/wp-content/uploads/2026/07/p32_sq-1024x1024.jpg)
![[Obayashi] Real Estate Development — 18.7% Margin, ¥287.7bn Unrealized Gains](https://japan-equity.com/wp-content/uploads/2026/07/p20_sq-1024x1024.jpg)
![[Obayashi] Domestic Civil Engineering — Resilience Spending Supports 9.6% Margin](https://japan-equity.com/wp-content/uploads/2026/07/p11_sq-1024x1024.jpg)
![[Obayashi] Share Price & External Ratings — vs TOPIX, ESG Index Inclusion](https://japan-equity.com/wp-content/uploads/2026/07/p40_sq-1024x1024.jpg)
![[Construction] ¥75.5tn Investment, Shrinking Workforce — Big-5 Market Share](https://japan-equity.com/wp-content/uploads/2026/07/p12_sq-1024x1024.jpg)



![[Obayashi] Capital Policy & Shareholder Returns — ROE 10%+, DOE ~5%, ¥100bn Buyback](https://japan-equity.com/wp-content/uploads/2026/07/p27_sq-1024x1024.jpg)
![[Obayashi] Reducing Cross-Shareholdings — ¥285.2bn Sold in Five Years](https://japan-equity.com/wp-content/uploads/2026/07/p29_sq-1024x1024.jpg)
![[Obayashi] ¥750bn Investment Plan — ¥300bn to Development, ¥190bn to Tech/DX](https://japan-equity.com/wp-content/uploads/2026/07/p30_sq-1024x1024.jpg)
![[Obayashi] MTP2022 KPIs — Operating Profit ~2x Target, ROE 14.4%](https://japan-equity.com/wp-content/uploads/2026/07/p25_sq-1024x1024.jpg)
![[Obayashi] Cash Allocation — ¥420bn Investment CF Over Five Years](https://japan-equity.com/wp-content/uploads/2026/07/p26_sq-1024x1024.jpg)
![[Obayashi] Green Energy — 44 Plants, 344MW, and the Green Hydrogen Challenge](https://japan-equity.com/wp-content/uploads/2026/07/p21_sq-1024x1024.jpg)
![[Obayashi] Tackling the Labor Shortage — Robotics Construction®](https://japan-equity.com/wp-content/uploads/2026/07/p14_sq-1024x1024.jpg)
