
This article is based on publicly available IR materials and is not a recommendation to buy or sell any specific securities.
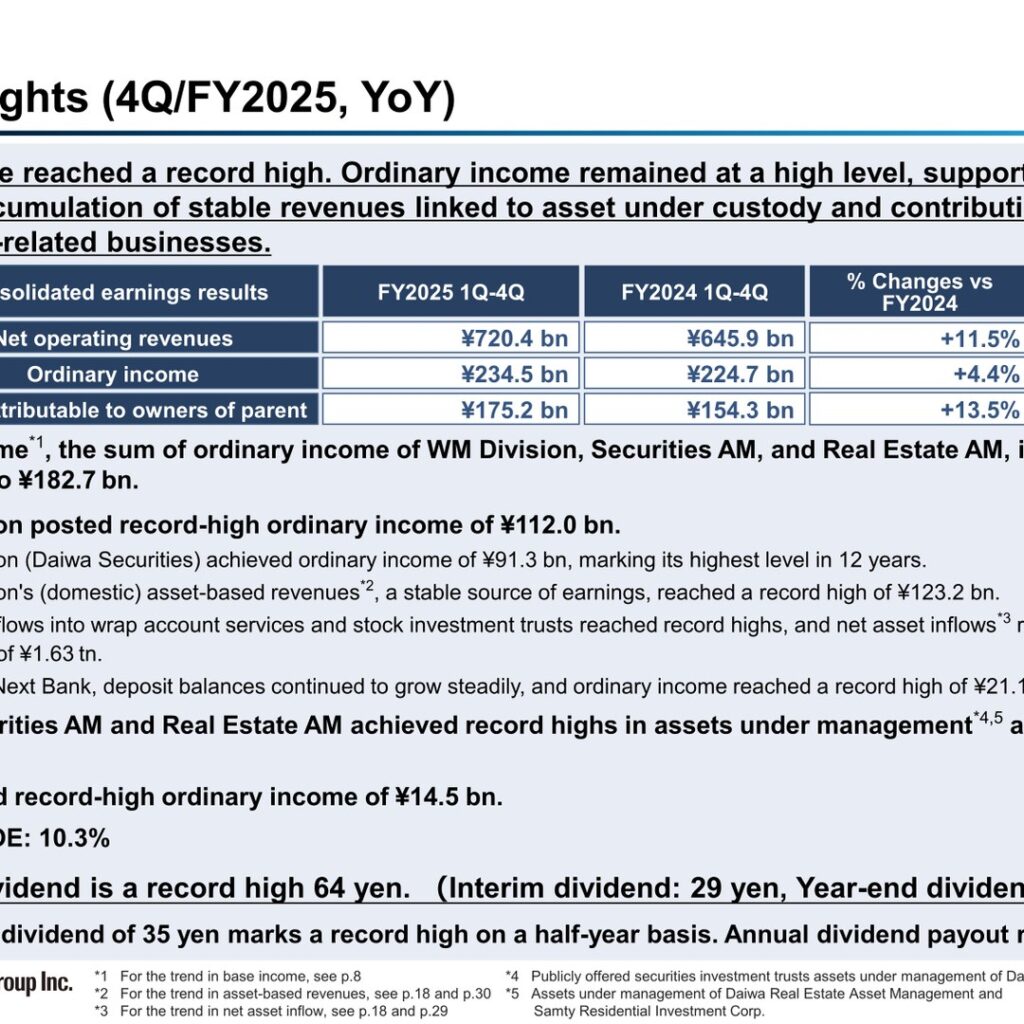
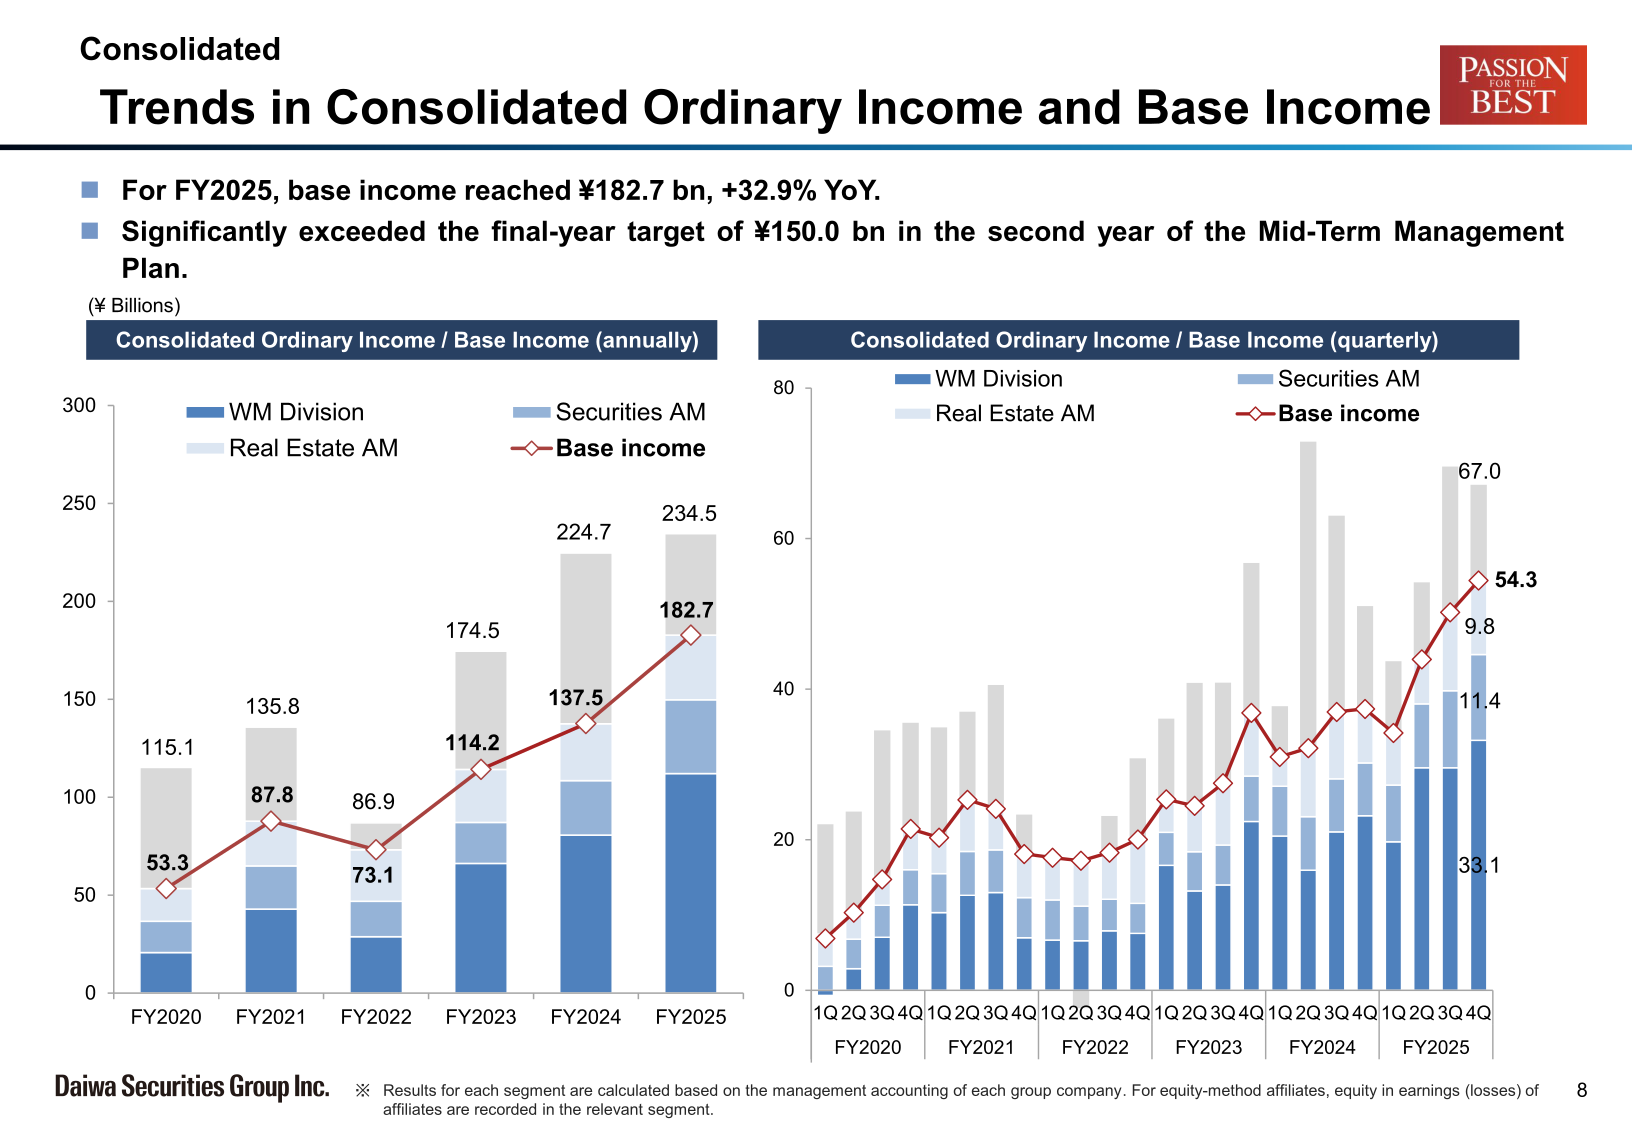
Daiwa Securities Group Inc. reported record-high profit attributable to owners of parent of ¥175,281 million for FY2025 (fiscal year ended March 31, 2026), up 13.5% year on year, while ordinary income rose 4.4% to ¥234,510 million. Base income — the sum of ordinary income from the Wealth Management (WM) Division, Securities Asset Management, and Real Estate Asset Management — increased 32.9% to ¥182,738 million, significantly exceeding the ¥150.0 billion final-year target set under the Mid-Term Management Plan. FY2025 ROE reached 10.3%, and the annual dividend rose to a record 64 yen per share.
Consolidated Results (Full-Year Actual)
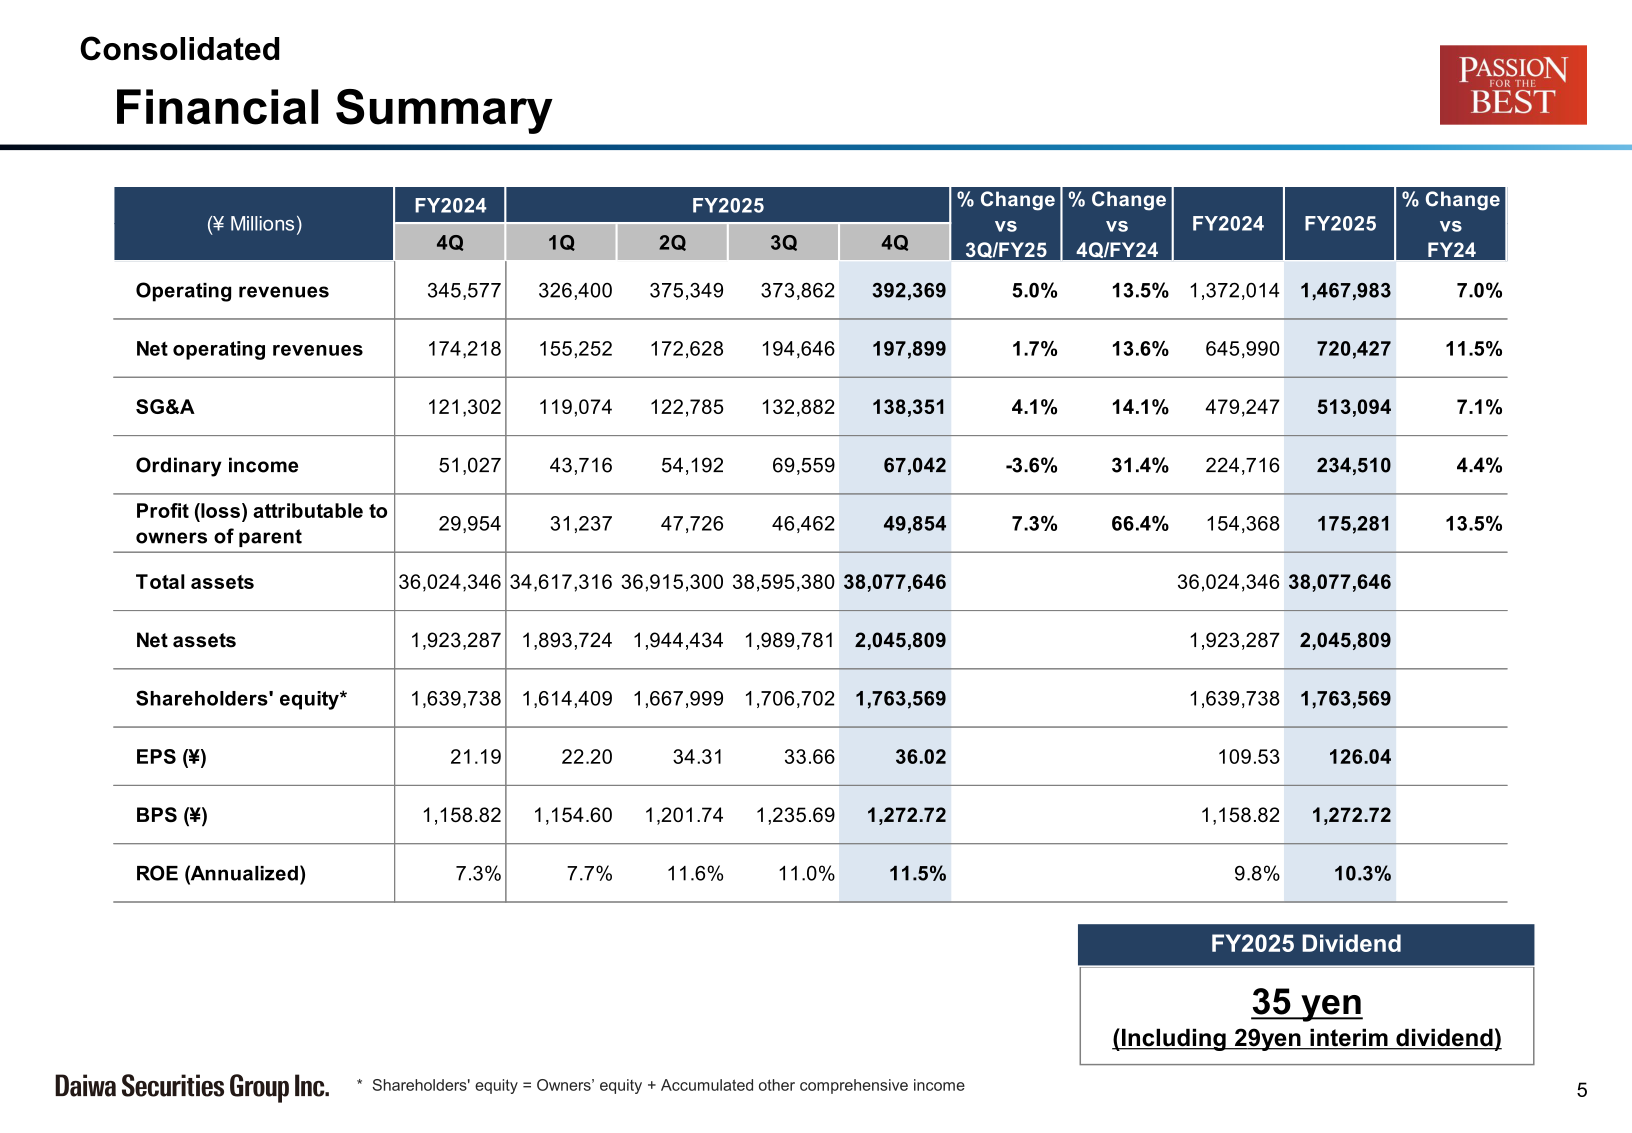
Net operating revenues grew 11.5% year on year to ¥720,427 million, supported by steady accumulation of stable revenues linked to assets under custody and contributions from securities-related businesses. SG&A increased 7.1% to ¥513,094 million. On a quarterly basis, 4Q FY2025 ordinary income was ¥67,042 million (-3.6% QoQ) and profit attributable to owners of parent was ¥49,854 million (+7.3% QoQ), with annualized ROE of 11.5% for the quarter.
| Item | FY2025 | FY2024 | Change |
|---|---|---|---|
| Operating revenues | ¥1,467,983 million | ¥1,372,014 million | +7.0% |
| Net operating revenues | ¥720,427 million | ¥645,990 million | +11.5% |
| SG&A | ¥513,094 million | ¥479,247 million | +7.1% |
| Ordinary income | ¥234,510 million | ¥224,716 million | +4.4% |
| Profit attributable to owners of parent | ¥175,281 million | ¥154,368 million | +13.5% |
| Item | FY2025 (Mar. 31, 2026) | FY2024 (Mar. 31, 2025) |
|---|---|---|
| Total assets | ¥38,077,646 million | ¥36,024,346 million |
| Net assets | ¥2,045,809 million | ¥1,923,287 million |
| Shareholders’ equity* | ¥1,763,569 million | ¥1,639,738 million |
| EPS | ¥126.04 | ¥109.53 |
| BPS | ¥1,272.72 | ¥1,158.82 |
| ROE (Annualized) | 10.3% | 9.8% |
Segment Results
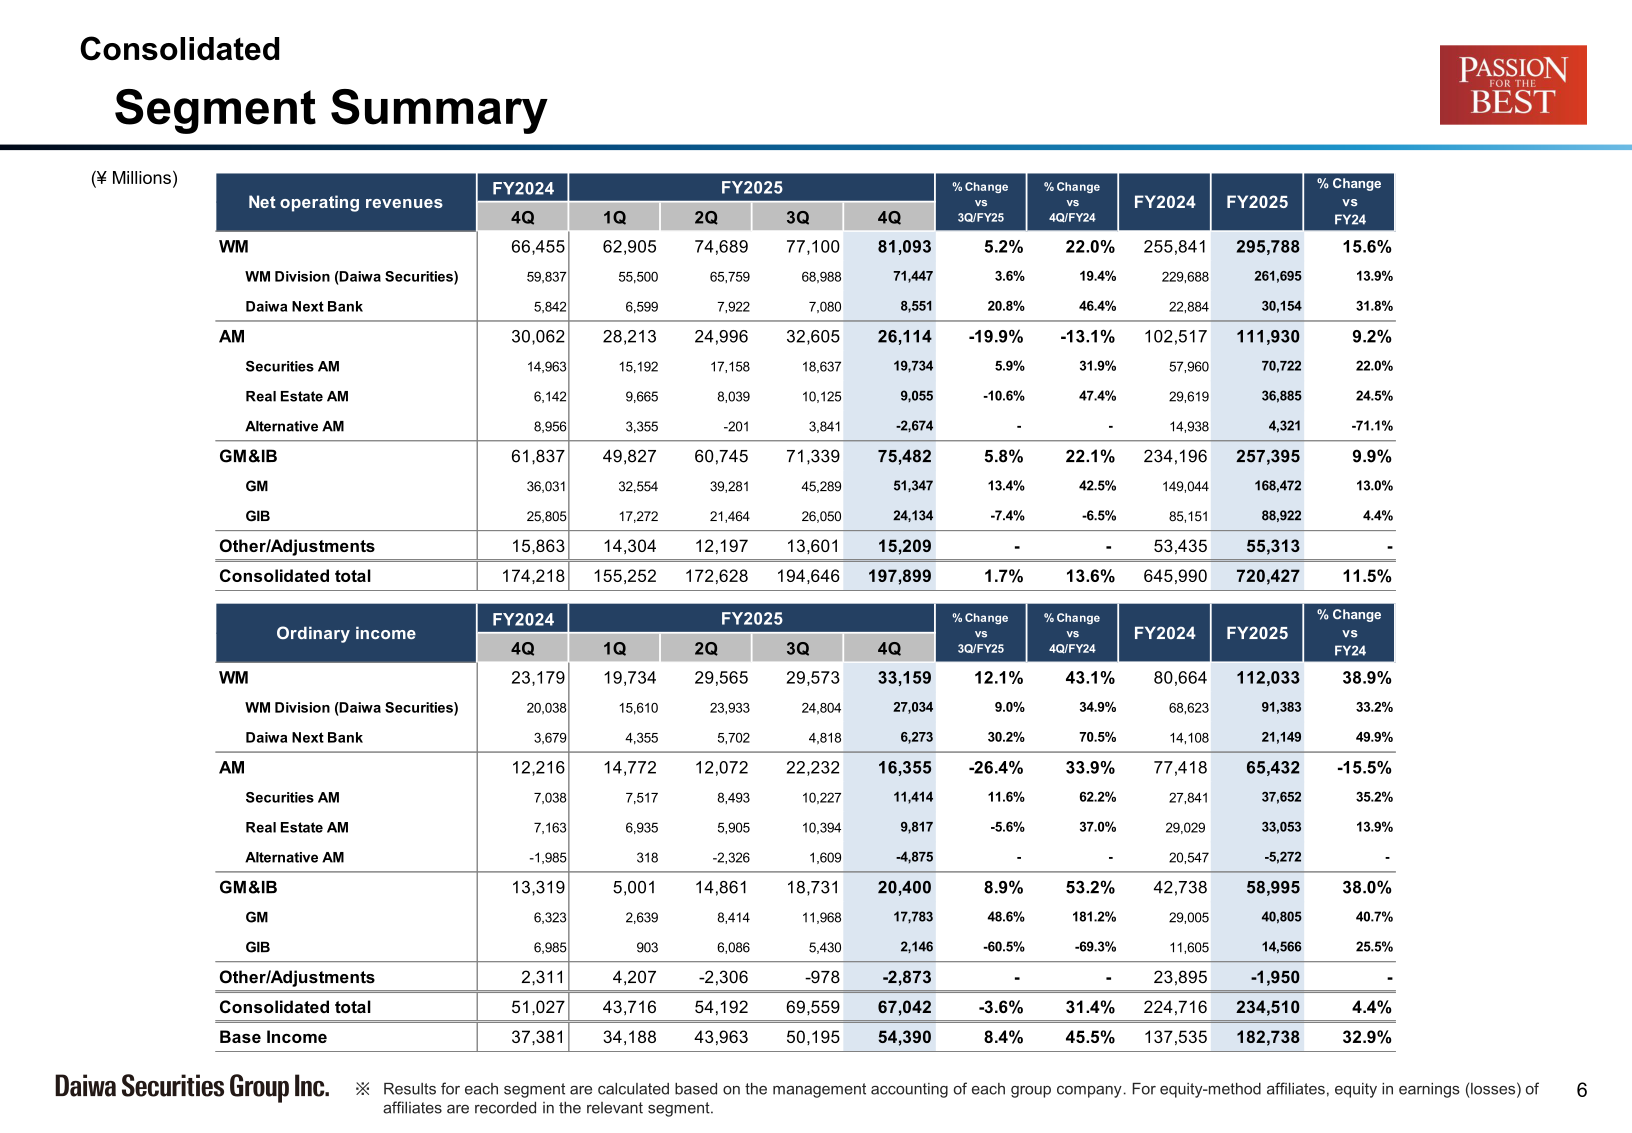
By division, the WM Division posted record-high ordinary income of ¥112,033 million (+38.9% YoY), with WM Division (Daiwa Securities) ordinary income of ¥91,383 million marking its highest level in 12 years, and Daiwa Next Bank ordinary income reaching a record ¥21,149 million. The AM Division’s ordinary income declined 15.5% to ¥65,432 million, as Alternative AM recorded provisions and impairment losses from the revaluation of certain renewable energy investments, even as Securities AM and Real Estate AM both achieved record-high ordinary income and assets under management. The GM&IB Division’s ordinary income rose 38.0% to ¥58,995 million, with GIB posting record-high ordinary income of ¥14,566 million on strong domestic M&A activity, while overseas operations posted ordinary income of ¥26,745 million for FY2025 (+28.6% YoY), led by growth in the Americas and Asia/Oceania.
Within the WM Division, asset-based revenues (domestic) reached a record ¥123.2 billion in FY2025, up from ¥111.7 billion in FY2024, and net asset inflows remained at a high level of ¥1.63 trillion for the year. Wrap-related revenues rose to a record ¥18.0 billion in 4Q, and Daiwa Securities’ contract assets under management for wrap accounts reached a record ¥6.04 trillion at fiscal year-end.
| Segment | Metric | FY2025 | FY2024 |
|---|---|---|---|
| WM Division | Net operating revenues | ¥295,788 million (+15.6%) | ¥255,841 million |
| WM Division | Ordinary income | ¥112,033 million (+38.9%) | ¥80,664 million |
| AM Division | Net operating revenues | ¥111,930 million (+9.2%) | ¥102,517 million |
| AM Division | Ordinary income | ¥65,432 million (-15.5%) | ¥77,418 million |
| GM&IB Division | Net operating revenues | ¥257,395 million (+9.9%) | ¥234,196 million |
| GM&IB Division | Ordinary income | ¥58,995 million (+38.0%) | ¥42,738 million |
| Other/Adjustments | Ordinary income | -¥1,950 million | ¥23,895 million |
| Consolidated total | Net operating revenues | ¥720,427 million (+11.5%) | ¥645,990 million |
| Consolidated total | Ordinary income | ¥234,510 million (+4.4%) | ¥224,716 million |
| Base Income** | Ordinary income | ¥182,738 million (+32.9%) | ¥137,535 million |
Balance Sheet and Capital Adequacy
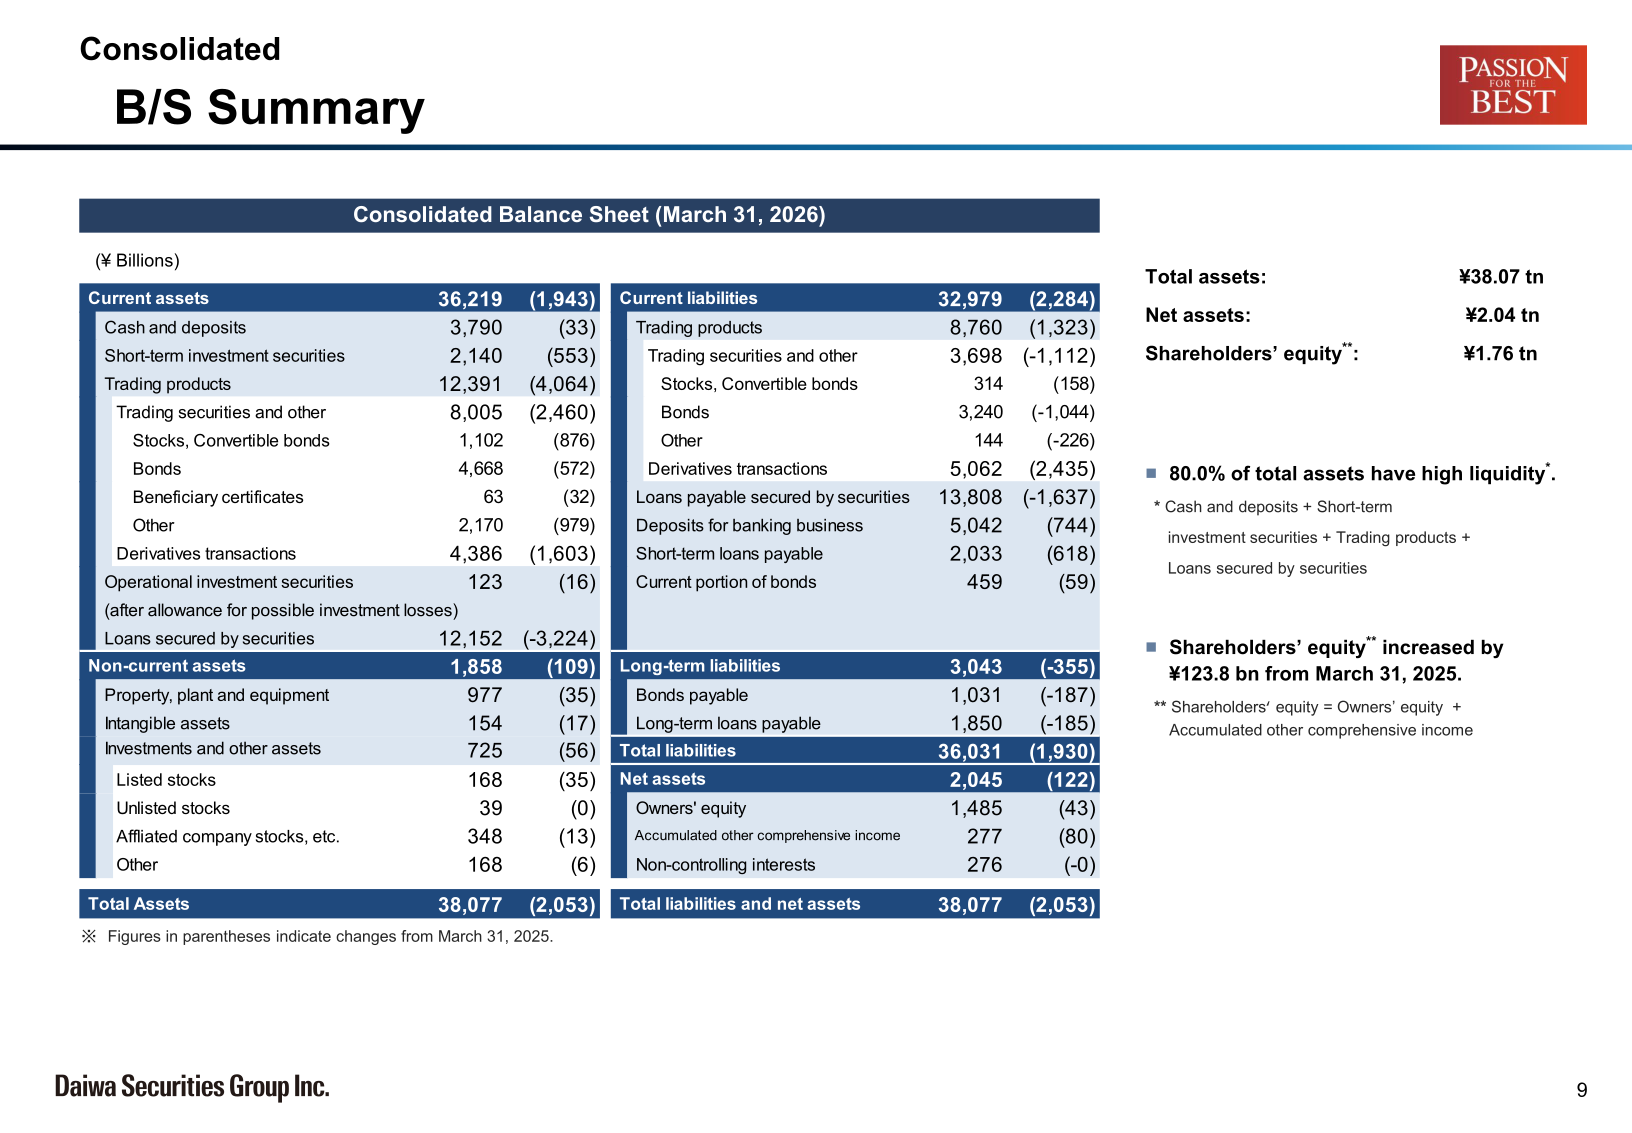
As of March 31, 2026, consolidated total assets stood at ¥38.08 trillion, net assets at ¥2.04 trillion, and shareholders’ equity at ¥1.76 trillion, up ¥123.8 billion from March 31, 2025. Approximately 80.0% of total assets were classified as highly liquid. As at December 31, 2025, the Consolidated Common Equity Tier 1 Capital Ratio was 19.13% and the Consolidated Leverage Ratio was 5.27%; the Consolidated Liquidity Coverage Ratio (daily average, January–March 2026) was 125.8%.
| Item | Value | As of |
|---|---|---|
| Consolidated Total Capital Ratio | 21.67% | Dec. 31, 2025 |
| Consolidated Tier 1 Capital Ratio | 21.61% | Dec. 31, 2025 |
| Consolidated Common Equity Tier 1 Capital Ratio | 19.13% | Dec. 31, 2025 |
| Consolidated Leverage Ratio | 5.27% | Dec. 31, 2025 |
| Consolidated Liquidity Coverage Ratio | 125.8% | Daily average, Jan.–Mar. 2026 |
Shareholder Returns
The annual dividend for FY2025 was a record 64 yen per share, comprising an interim dividend of 29 yen and a year-end dividend of 35 yen — the year-end dividend marking a record high on a half-year basis. The annual dividend payout ratio was 50.8%.
Medium-Term Management Plan / Topics
This material does not disclose specific FY2026 consolidated earnings or dividend forecasts; forward-looking figures for FY2026 cannot be confirmed from the materials. Under the Group’s Mid-Term Management Plan, a final-year (third-year) base income target of ¥150.0 billion had been set; base income of ¥182,738 million achieved in FY2025 — the second year of the plan — already significantly exceeded that target.
This article is an analysis based on publicly available information and is not a recommendation to buy or sell any specific securities. Investment decisions are your own responsibility.
![[Obayashi] Investors’ Guide 2026 — The Complete 24-Article Breakdown](https://japan-equity.com/wp-content/uploads/2026/07/hub_cover-1024x1024.png)
![[Obayashi] IR & SR Policy — Feeding Dialogue Back into Management](https://japan-equity.com/wp-content/uploads/2026/07/p32_sq-1024x1024.jpg)
![[Obayashi] Real Estate Development — 18.7% Margin, ¥287.7bn Unrealized Gains](https://japan-equity.com/wp-content/uploads/2026/07/p20_sq-1024x1024.jpg)
![[Obayashi] Domestic Civil Engineering — Resilience Spending Supports 9.6% Margin](https://japan-equity.com/wp-content/uploads/2026/07/p11_sq-1024x1024.jpg)
![[Obayashi] Share Price & External Ratings — vs TOPIX, ESG Index Inclusion](https://japan-equity.com/wp-content/uploads/2026/07/p40_sq-1024x1024.jpg)
![[Construction] ¥75.5tn Investment, Shrinking Workforce — Big-5 Market Share](https://japan-equity.com/wp-content/uploads/2026/07/p12_sq-1024x1024.jpg)



![[Obayashi] Capital Policy & Shareholder Returns — ROE 10%+, DOE ~5%, ¥100bn Buyback](https://japan-equity.com/wp-content/uploads/2026/07/p27_sq-1024x1024.jpg)
![[Obayashi] Reducing Cross-Shareholdings — ¥285.2bn Sold in Five Years](https://japan-equity.com/wp-content/uploads/2026/07/p29_sq-1024x1024.jpg)
![[Obayashi] ¥750bn Investment Plan — ¥300bn to Development, ¥190bn to Tech/DX](https://japan-equity.com/wp-content/uploads/2026/07/p30_sq-1024x1024.jpg)
![[Obayashi] MTP2022 KPIs — Operating Profit ~2x Target, ROE 14.4%](https://japan-equity.com/wp-content/uploads/2026/07/p25_sq-1024x1024.jpg)
![[Obayashi] Cash Allocation — ¥420bn Investment CF Over Five Years](https://japan-equity.com/wp-content/uploads/2026/07/p26_sq-1024x1024.jpg)
![[Obayashi] Green Energy — 44 Plants, 344MW, and the Green Hydrogen Challenge](https://japan-equity.com/wp-content/uploads/2026/07/p21_sq-1024x1024.jpg)
![[Obayashi] Tackling the Labor Shortage — Robotics Construction®](https://japan-equity.com/wp-content/uploads/2026/07/p14_sq-1024x1024.jpg)
