
This article is based on publicly available IR materials and is not a recommendation to buy or sell any specific securities.
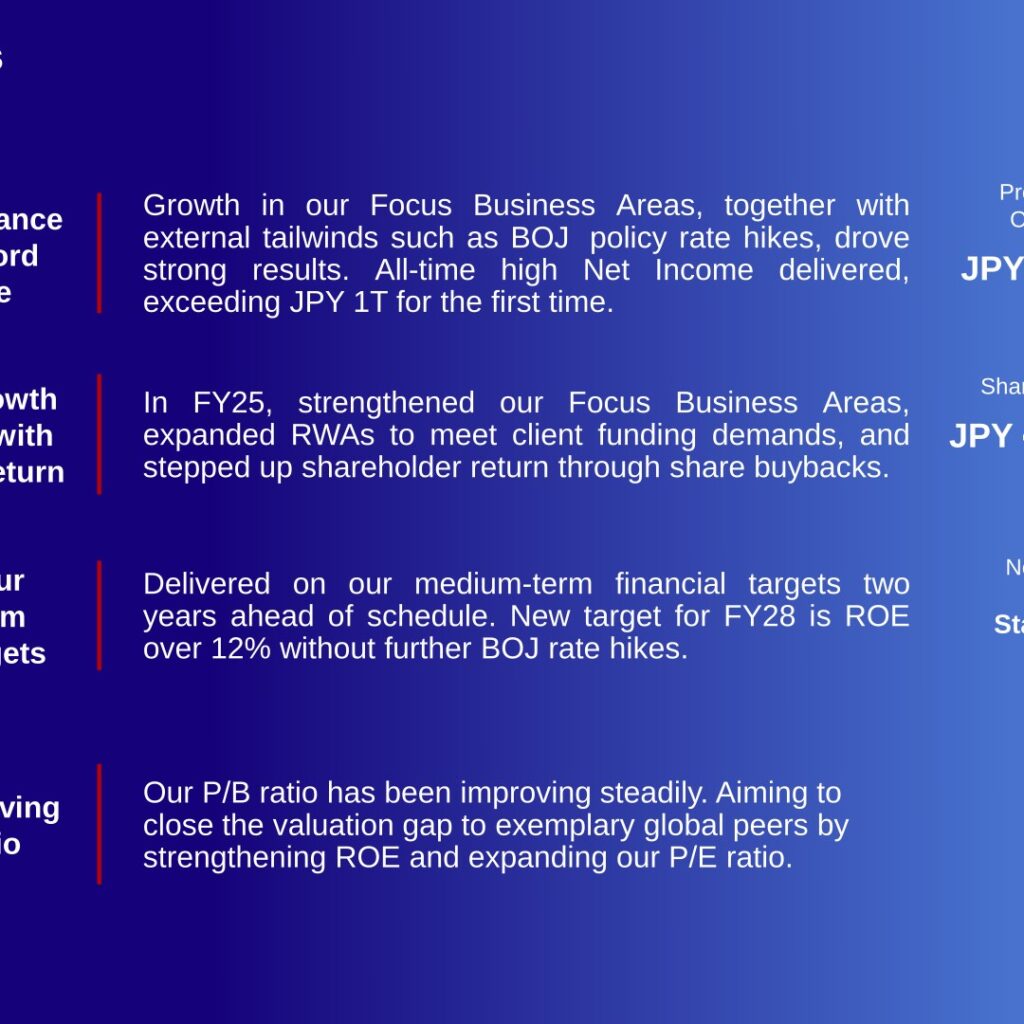
Mizuho Financial Group reported Profit Attributable to Owners of Parent of JPY 1,248.6B for FY25 (Apr. 2025 – Mar. 2026), up JPY 363.1B (+41.0% YoY) and exceeding JPY 1 trillion for the first time, an achievement rate of 110% versus its outlook of JPY 1.13T. Consolidated Net Business Profits rose 27.6% YoY to JPY 1,461.1B, an achievement rate of 108% versus the JPY 1.35T outlook, driven by strong performance in Customer Groups and Markets. ROE improved 2.9 percentage points YoY to 11.4%, achieving the company’s FY27 target of over 10% two years ahead of schedule. Mizuho has accordingly raised its medium-term financial targets, now aiming for ROE over 12% by FY28.
Consolidated Results (Full-Year Actual)
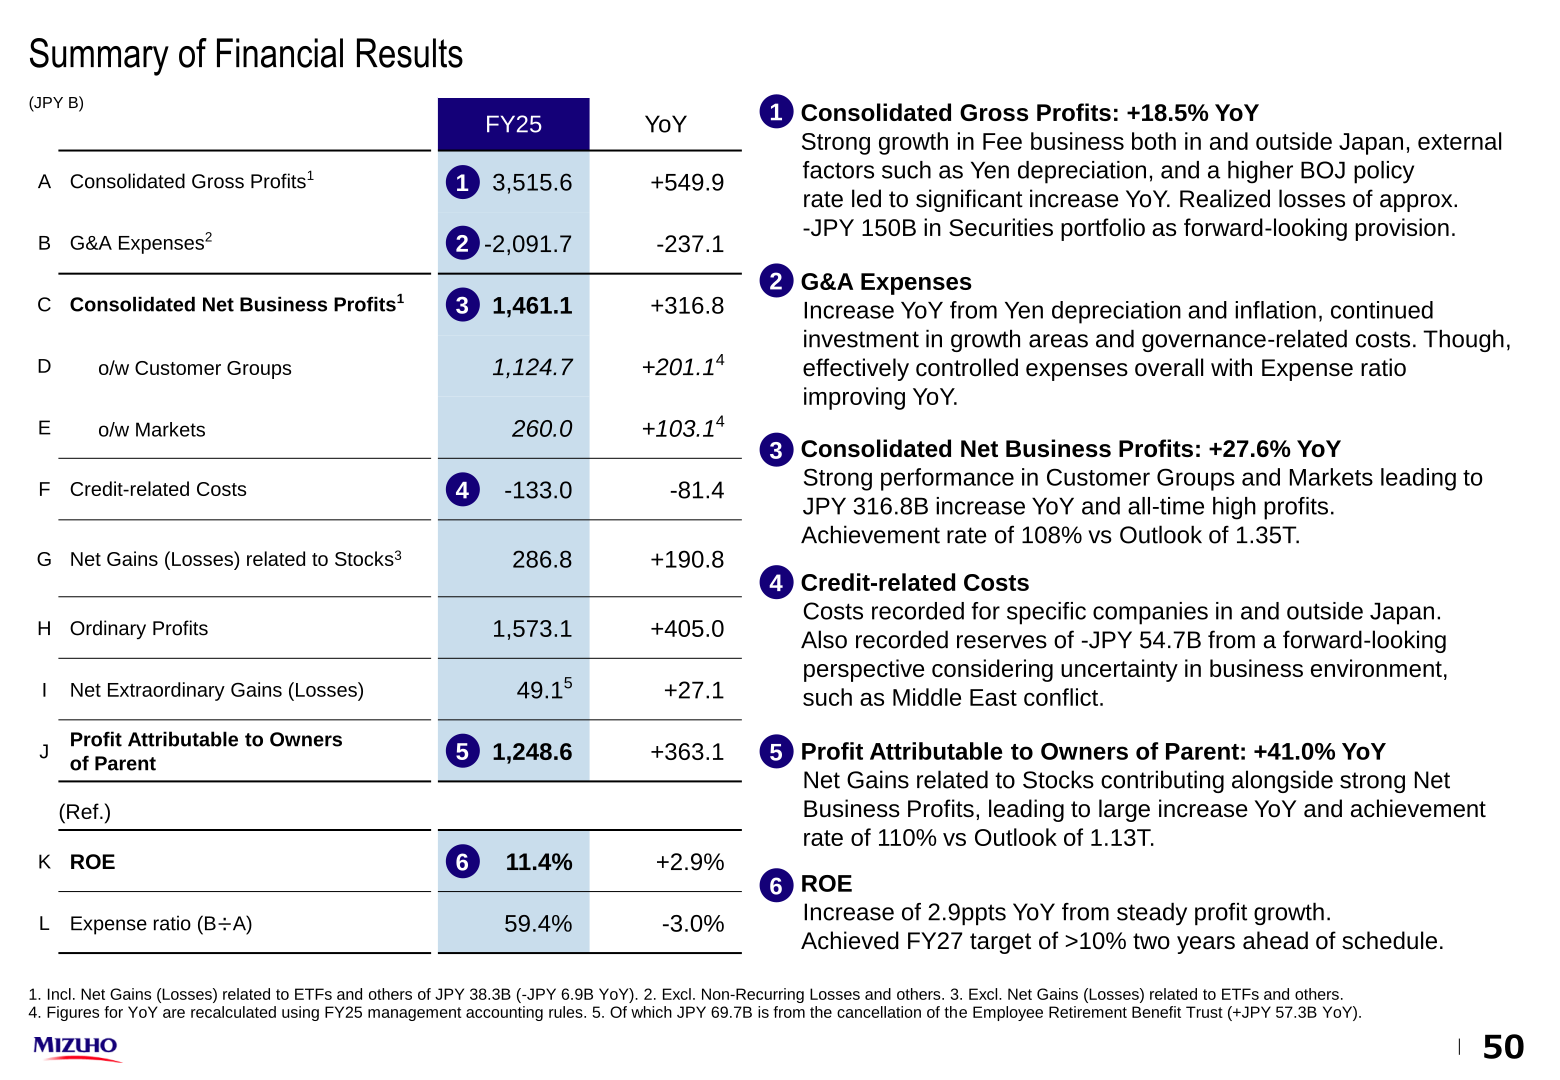
Consolidated Gross Profits increased 18.5% YoY to JPY 3,515.6B, supported by strong fee business growth in and outside Japan, yen depreciation, and a higher Bank of Japan policy rate, while the company also realized approx. -JPY 150B of losses in its securities portfolio as a forward-looking provision. G&A Expenses rose to JPY 2,091.7B on yen depreciation, inflation, and continued investment in growth areas and governance-related costs, though the Expense ratio improved 3.0 percentage points YoY to 59.4%. Credit-related Costs were -JPY 133.0B, including -JPY 54.7B of reserves recorded from a forward-looking perspective in light of uncertainty from the Middle East conflict. Net Gains related to Stocks contributed JPY 286.8B (+JPY 190.8B YoY), and Ordinary Profits rose to JPY 1,573.1B (+JPY 405.0B YoY).
| Item | FY2025 | YoY Change |
|---|---|---|
| Consolidated Gross Profits | JPY 3,515.6B | +JPY 549.9B |
| G&A Expenses | -JPY 2,091.7B | -JPY 237.1B |
| Consolidated Net Business Profits | JPY 1,461.1B | +JPY 316.8B |
| o/w Customer Groups | JPY 1,124.7B | +JPY 201.1B |
| o/w Markets | JPY 260.0B | +JPY 103.1B |
| Credit-related Costs | -JPY 133.0B | -JPY 81.4B |
| Net Gains (Losses) related to Stocks | JPY 286.8B | +JPY 190.8B |
| Ordinary Profits | JPY 1,573.1B | +JPY 405.0B |
| Net Extraordinary Gains (Losses) | JPY 49.1B | +JPY 27.1B |
| Profit Attributable to Owners of Parent | JPY 1,248.6B | +JPY 363.1B |
| ROE | 11.4% | +2.9%pt |
| Expense ratio | 59.4% | -3.0%pt |
Segment Results
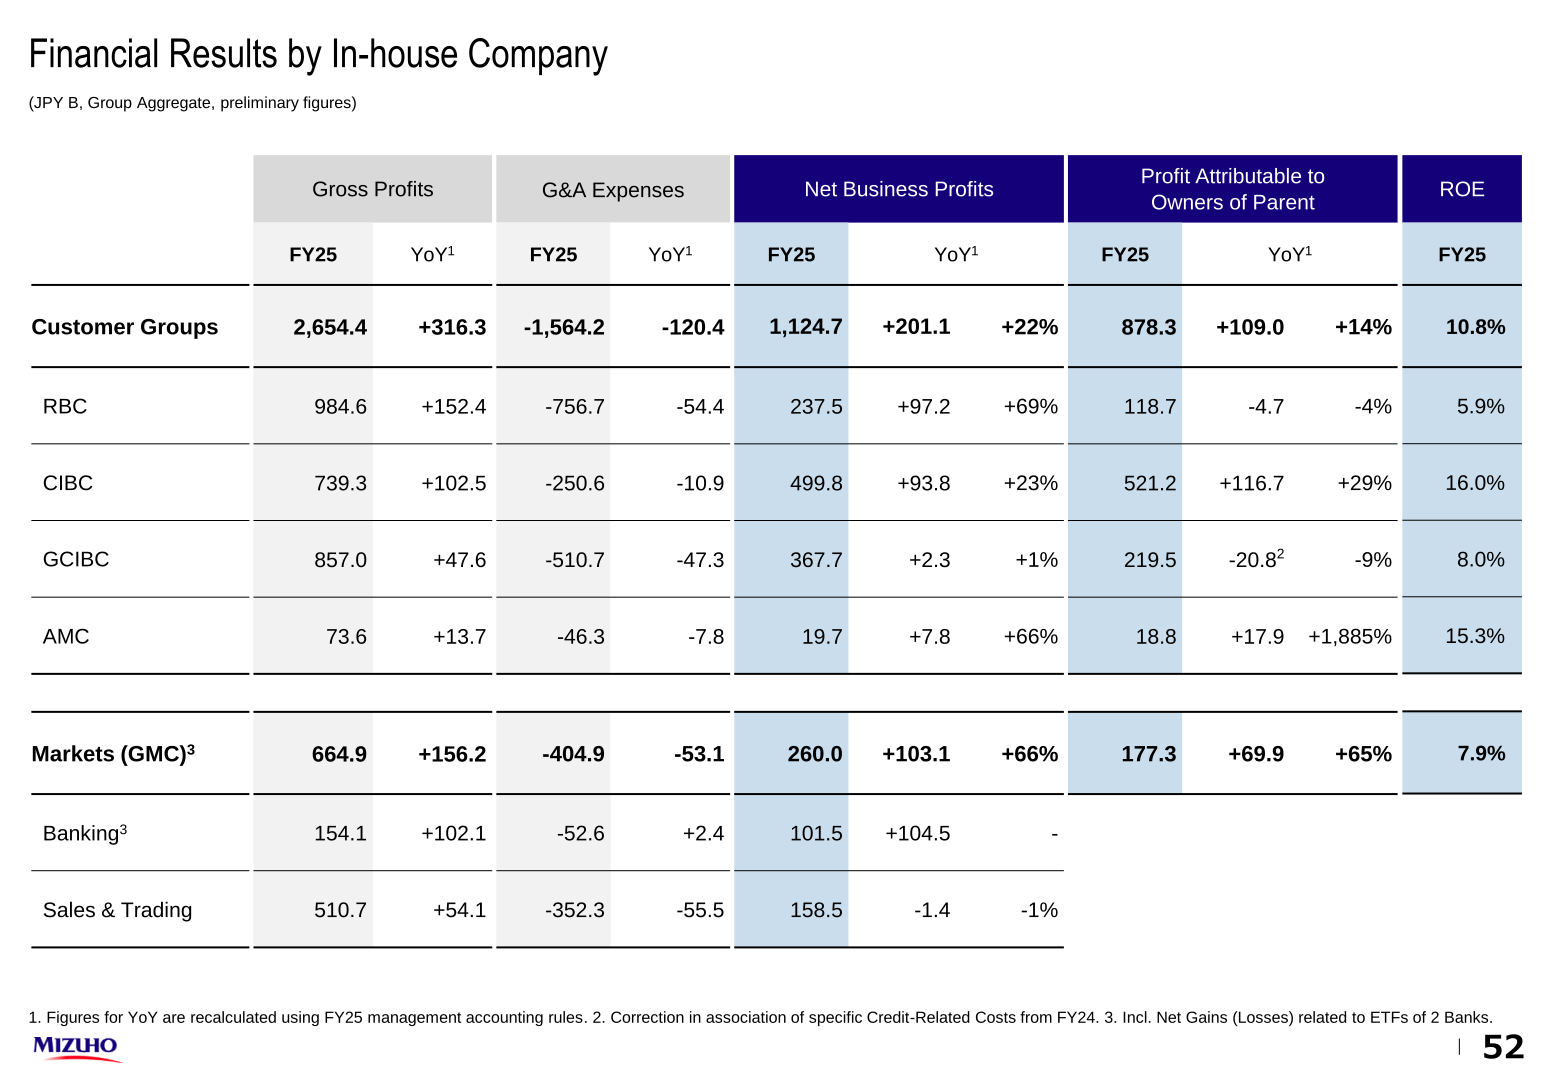
Among Mizuho’s in-house companies, Corporate & Investment Banking Company (CIBC) delivered the strongest profit growth, with Net Business Profits up 23% YoY to JPY 499.8B and Profit Attributable to Owners of Parent up 29% YoY to JPY 521.2B on stronger interest and non-interest income. Retail & Business Banking Company (RBC) and the Global Markets Company (GMC) also posted sharply higher Net Business Profits, up 69% and 66% YoY respectively. Global Corporate & Investment Banking Company (GCIBC) Net Business Profits were roughly flat (+1% YoY), with Profit Attributable to Owners of Parent down 9% YoY. Asset Management Company (AMC) Net Income rose to JPY 18.8B from JPY 0.9B in FY24. By group company, Mizuho Bank (BK) non-consolidated Net Business Profits rose to JPY 907.6B (FY24: JPY 690.1B) and Profit Attributable to Owners of Parent rose to JPY 822.4B (FY24: JPY 573.4B).
| In-house Company | Gross Profits FY2025 (YoY) | Net Business Profits FY2025 (YoY) | Profit Attributable to Owners of Parent FY2025 (YoY) | ROE FY2025 |
|---|---|---|---|---|
| Customer Groups | JPY 2,654.4B (+JPY 316.3B) | JPY 1,124.7B (+JPY 201.1B, +22%) | JPY 878.3B (+JPY 109.0B, +14%) | 10.8% |
| RBC (Retail & Business Banking) | JPY 984.6B (+JPY 152.4B) | JPY 237.5B (+JPY 97.2B, +69%) | JPY 118.7B (-JPY 4.7B, -4%) | 5.9% |
| CIBC (Corporate & Investment Banking) | JPY 739.3B (+JPY 102.5B) | JPY 499.8B (+JPY 93.8B, +23%) | JPY 521.2B (+JPY 116.7B, +29%) | 16.0% |
| GCIBC (Global Corporate & Investment Banking) | JPY 857.0B (+JPY 47.6B) | JPY 367.7B (+JPY 2.3B, +1%) | JPY 219.5B (-JPY 20.8B, -9%) | 8.0% |
| AMC (Asset Management) | JPY 73.6B (+JPY 13.7B) | JPY 19.7B (+JPY 7.8B, +66%) | JPY 18.8B (+JPY 17.9B, +1,885%) | 15.3% |
| Markets (GMC, Global Markets) | JPY 664.9B (+JPY 156.2B) | JPY 260.0B (+JPY 103.1B, +66%) | JPY 177.3B (+JPY 69.9B, +65%) | 7.9% |
| Group Company | Net Business Profits FY2025 | Net Business Profits FY2024 | Profit Attributable to Owners of Parent FY2025 | Profit Attributable to Owners of Parent FY2024 |
|---|---|---|---|---|
| BK (Mizuho Bank, non-consolidated) | JPY 907.6B | JPY 690.1B | JPY 822.4B | JPY 573.4B |
| TB (Mizuho Trust & Banking, non-consolidated) | JPY 108.0B | JPY 46.7B | JPY 123.4B | JPY 45.8B |
| SC (Mizuho Securities, U.S. and Europe-based entities aggregated) | JPY 261.5B | JPY 214.7B | JPY 193.0B | JPY 147.0B |
| AM-One | JPY 26.0B | JPY 22.8B | JPY 19.0B | JPY 15.0B |
| Equity in Income from Investments in Affiliates | JPY 52.2B | JPY 46.7B | JPY 52.2B | JPY 46.7B |
| Other | JPY 105.5B | JPY 122.9B | JPY 38.3B | JPY 57.2B |
| FG Consolidated | JPY 1,461.1B | JPY 1,144.2B | JPY 1,248.6B | JPY 885.4B |
FY2026 Forecast
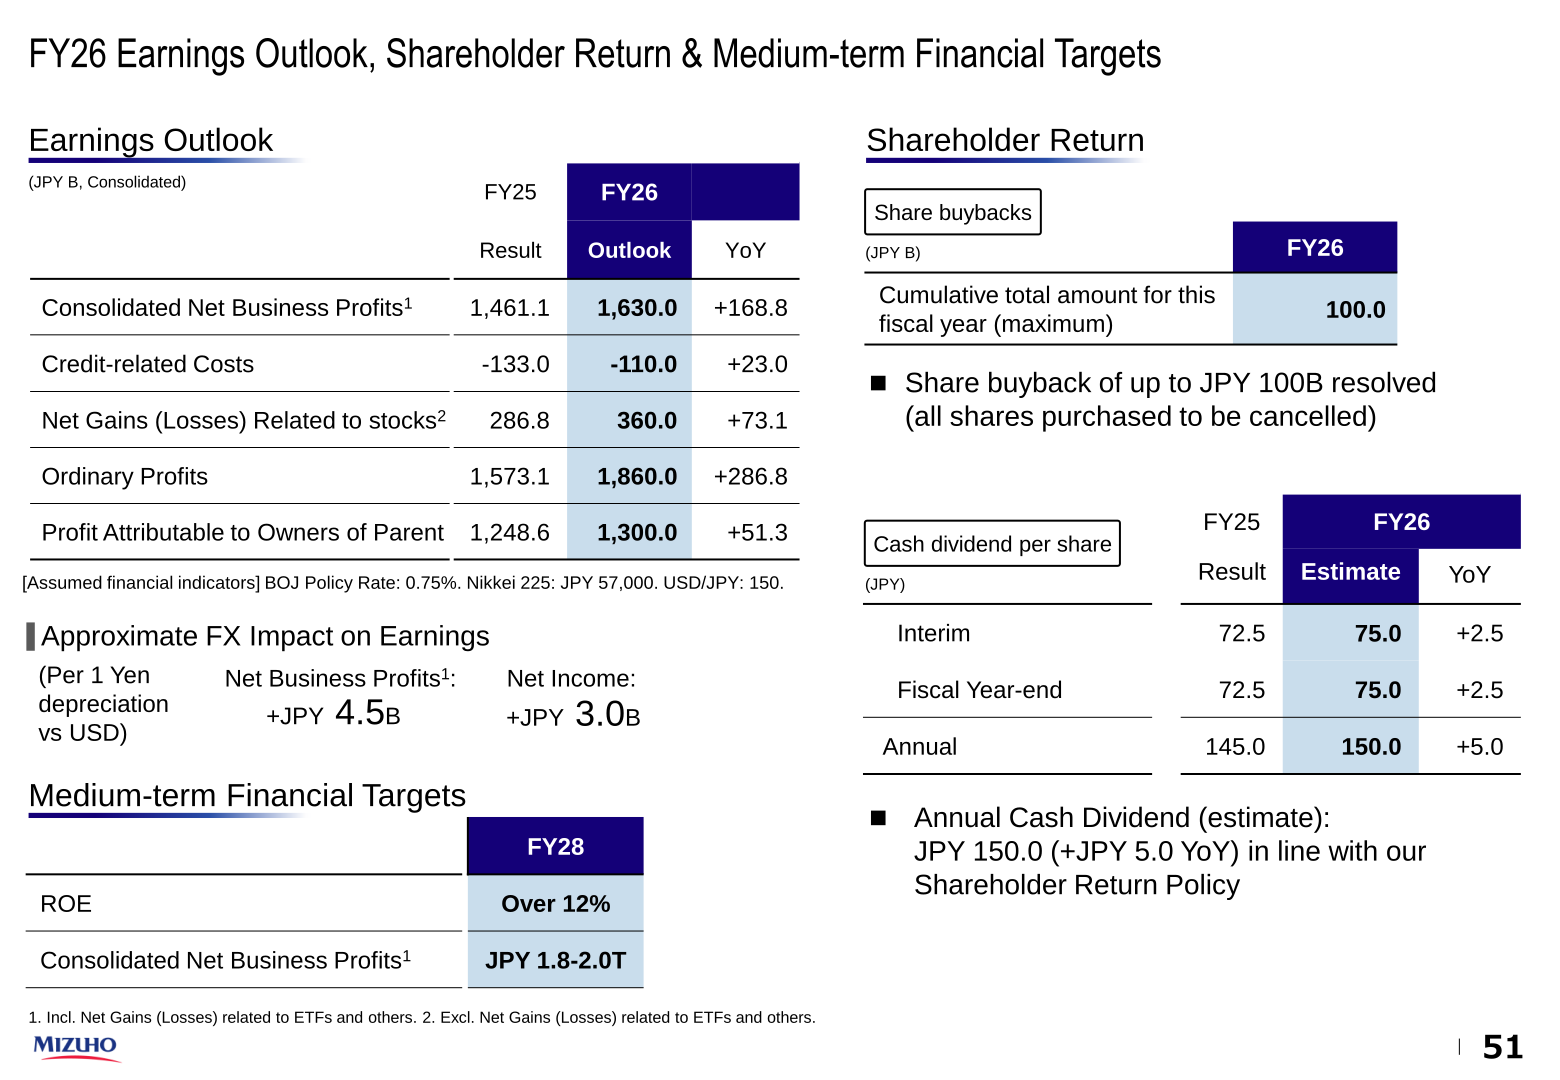
For FY26, Mizuho expects Consolidated Net Business Profits of JPY 1,630.0B (+JPY 168.8B YoY) and Profit Attributable to Owners of Parent of JPY 1,300.0B (+JPY 51.3B YoY), which would mark another all-time high. Credit-related Costs are forecast to improve to -JPY 110.0B from -JPY 133.0B in FY25, while Net Gains related to Stocks are expected to rise to JPY 360.0B. The outlook assumes a BOJ policy rate of 0.75%, USD/JPY of 150, and Nikkei 225 of JPY 57,000.
| Item | FY2025 (Result) | FY2026 (Outlook) | YoY Change |
|---|---|---|---|
| Consolidated Net Business Profits | JPY 1,461.1B | JPY 1,630.0B | +JPY 168.8B |
| Credit-related Costs | -JPY 133.0B | -JPY 110.0B | +JPY 23.0B |
| Net Gains (Losses) related to Stocks | JPY 286.8B | JPY 360.0B | +JPY 73.1B |
| Ordinary Profits | JPY 1,573.1B | JPY 1,860.0B | +JPY 286.8B |
| Profit Attributable to Owners of Parent | JPY 1,248.6B | JPY 1,300.0B | +JPY 51.3B |
Shareholder Returns
Mizuho plans to increase its FY26 annual dividend per share to JPY 150.0 (+JPY 5.0 YoY), continuing its policy of increasing dividends per share by approximately JPY 5.0 each fiscal year based on steady growth of its stable earnings base. The company has also resolved a share buyback of up to JPY 100.0B for FY26, with all shares repurchased to be cancelled, using a Total Payout Ratio (TPR) of 50% or more as a guide; combined share buybacks and TPR for FY25 (through April 2026) totaled JPY 400B and 60% respectively.
| Item | FY2025 (Result) | FY2026 (Estimate) | YoY Change |
|---|---|---|---|
| Interim Dividend per Share | JPY 72.5 | JPY 75.0 | +JPY 2.5 |
| Fiscal Year-end Dividend per Share | JPY 72.5 | JPY 75.0 | +JPY 2.5 |
| Annual Dividend per Share | JPY 145.0 | JPY 150.0 | +JPY 5.0 |
| Share buybacks (cumulative total for the fiscal year, maximum) | – | JPY 100.0B | – |
Capital Adequacy & Asset Quality
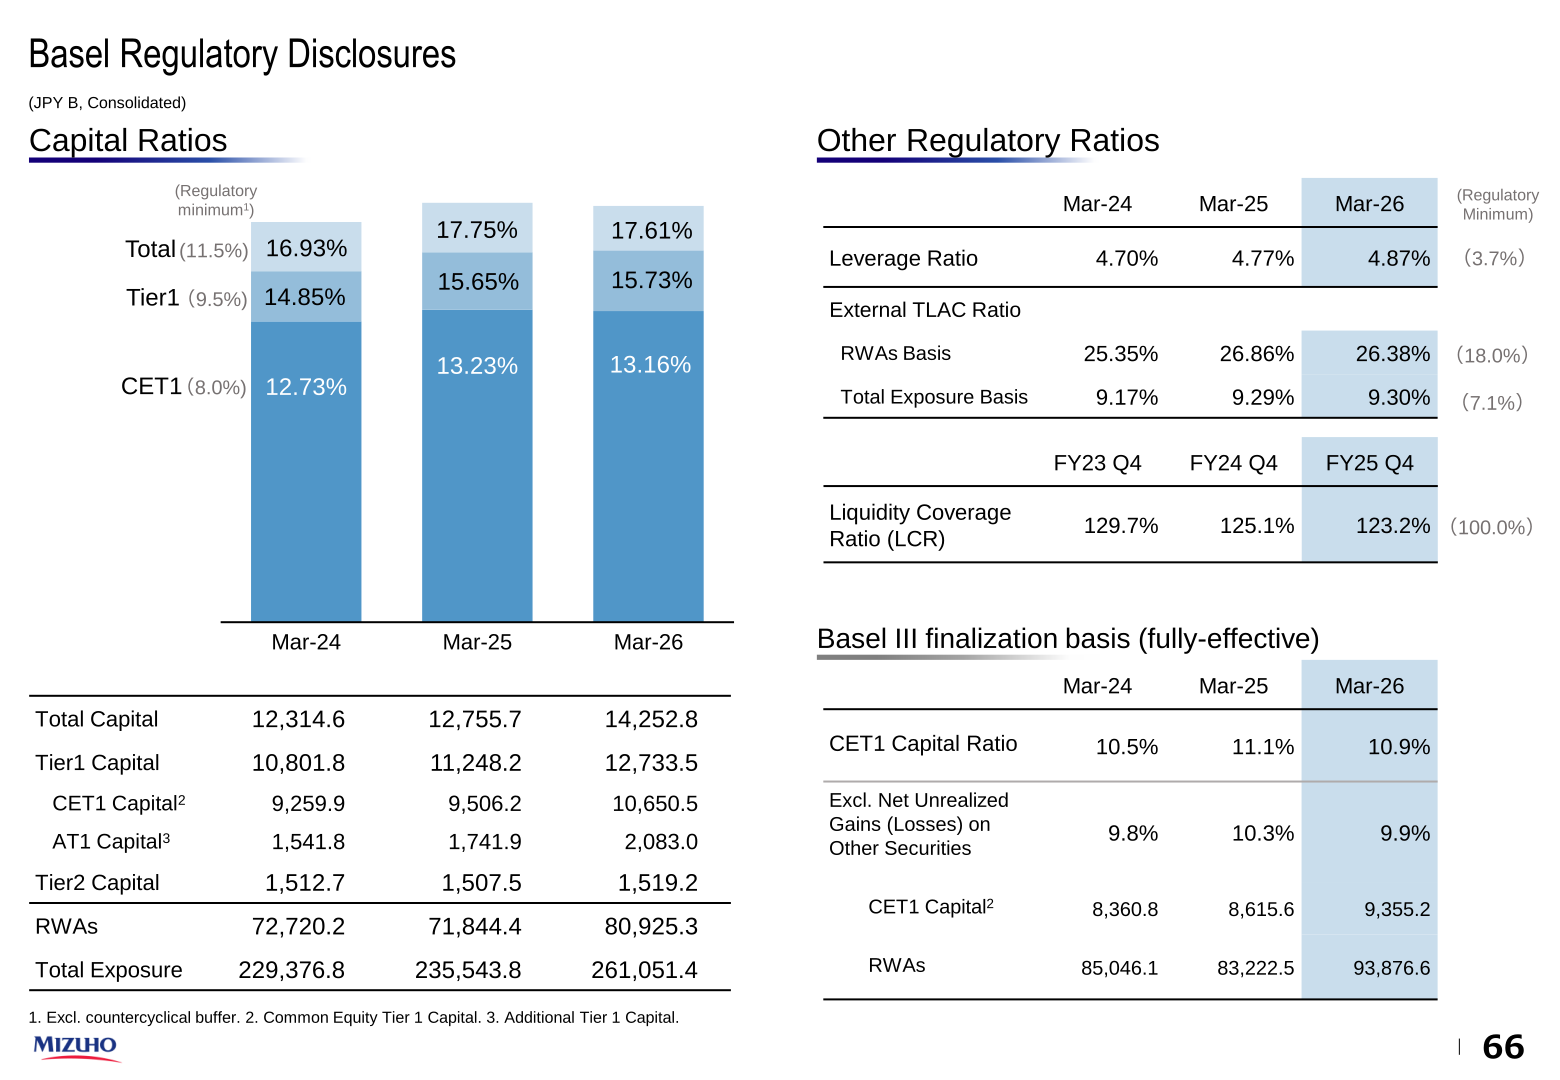
Mizuho’s CET1 capital ratio (Basel III finalization fully effective basis, excluding net unrealized gains on other securities) stood at 9.9% as of March 2026, down from 10.3% a year earlier but within the company’s operational range of mid 9-10% to mid 10-11%, after RWAs increased to JPY 93,876.6B on robust growth in financing demand. Including net unrealized gains, the CET1 ratio was 10.9% (Mar-25: 11.1%). The Leverage Ratio improved to 4.87% (Mar-25: 4.77%), and the Liquidity Coverage Ratio (LCR) was 123.2% for FY25 Q4 versus a regulatory minimum of 100%.
| Item | Mar-2025 | Mar-2026 |
|---|---|---|
| CET1 Capital Ratio (incl. unrealized gains) | 11.1% | 10.9% |
| CET1 Capital Ratio (excl. unrealized gains) | 10.3% | 9.9% |
| CET1 Capital (excl. unrealized gains basis) | JPY 8,615.6B | JPY 9,355.2B |
| Risk-Weighted Assets (RWAs) | JPY 83,222.5B | JPY 93,876.6B |
| Leverage Ratio | 4.77% | 4.87% |
| Liquidity Coverage Ratio (LCR, quarterly) | 125.1% (FY24 Q4) | 123.2% (FY25 Q4) |
Medium-Term Plan / Topics
Mizuho delivered on its previous FY27 ROE target of over 10% two years ahead of schedule and has raised its medium-term financial targets: it now aims to stably achieve ROE over 12% by FY28 (previously targeting over 10% by FY27), together with Consolidated Net Business Profits of approximately JPY 1.8-2.0T by FY28 (previously approx. JPY 1.4-1.6T for FY27), assuming a BOJ policy rate of 0.75% and USD/JPY of 150. The company’s P/B ratio has improved steadily, from 0.52x in FY22 to 0.75x in FY23, 0.97x in FY24 and 1.49x in FY25, and Mizuho states it is aiming toward and beyond a P/B ratio of 2.0x by strengthening ROE and expanding its P/E ratio.
This article is an analysis based on publicly available information and is not a recommendation to buy or sell any specific securities. Investment decisions are your own responsibility.
![[Obayashi] Investors’ Guide 2026 — The Complete 24-Article Breakdown](https://japan-equity.com/wp-content/uploads/2026/07/hub_cover-1024x1024.png)
![[Obayashi] IR & SR Policy — Feeding Dialogue Back into Management](https://japan-equity.com/wp-content/uploads/2026/07/p32_sq-1024x1024.jpg)
![[Obayashi] Domestic Civil Engineering — Resilience Spending Supports 9.6% Margin](https://japan-equity.com/wp-content/uploads/2026/07/p11_sq-1024x1024.jpg)
![[Obayashi] Overseas Construction — Orders Reach ¥1.2tn](https://japan-equity.com/wp-content/uploads/2026/07/p15_sq-1024x1024.jpg)
![[Obayashi] Share Price & External Ratings — vs TOPIX, ESG Index Inclusion](https://japan-equity.com/wp-content/uploads/2026/07/p40_sq-1024x1024.jpg)
![[Construction] ¥75.5tn Investment, Shrinking Workforce — Big-5 Market Share](https://japan-equity.com/wp-content/uploads/2026/07/p12_sq-1024x1024.jpg)



![[Obayashi] Capital Policy & Shareholder Returns — ROE 10%+, DOE ~5%, ¥100bn Buyback](https://japan-equity.com/wp-content/uploads/2026/07/p27_sq-1024x1024.jpg)
![[Obayashi] Reducing Cross-Shareholdings — ¥285.2bn Sold in Five Years](https://japan-equity.com/wp-content/uploads/2026/07/p29_sq-1024x1024.jpg)
![[Obayashi] ¥750bn Investment Plan — ¥300bn to Development, ¥190bn to Tech/DX](https://japan-equity.com/wp-content/uploads/2026/07/p30_sq-1024x1024.jpg)
![[Obayashi] MTP2022 KPIs — Operating Profit ~2x Target, ROE 14.4%](https://japan-equity.com/wp-content/uploads/2026/07/p25_sq-1024x1024.jpg)
![[Obayashi] Cash Allocation — ¥420bn Investment CF Over Five Years](https://japan-equity.com/wp-content/uploads/2026/07/p26_sq-1024x1024.jpg)
![[Obayashi] Green Energy — 44 Plants, 344MW, and the Green Hydrogen Challenge](https://japan-equity.com/wp-content/uploads/2026/07/p21_sq-1024x1024.jpg)
![[Obayashi] Tackling the Labor Shortage — Robotics Construction®](https://japan-equity.com/wp-content/uploads/2026/07/p14_sq-1024x1024.jpg)
