
This article is based on publicly available IR materials and is not a recommendation to buy or sell any specific securities.
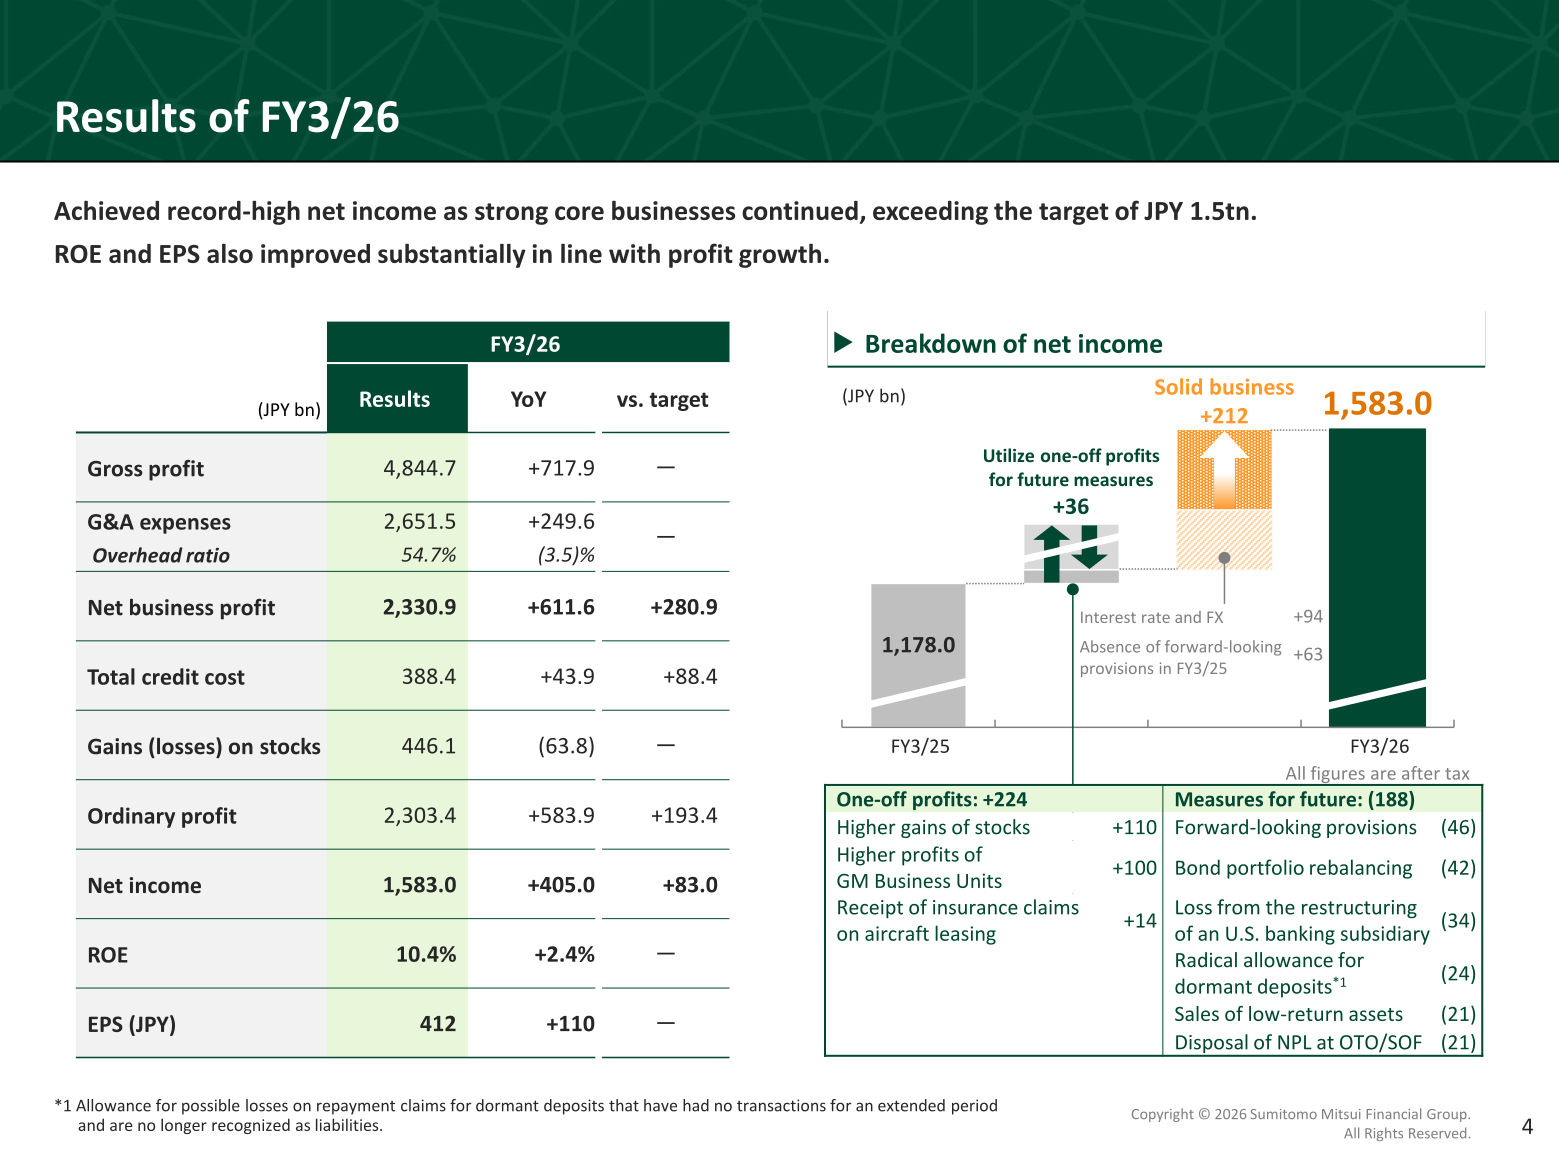
Sumitomo Mitsui Financial Group, Inc. (SMFG) reported record-high consolidated net income of JPY 1,583.0bn for the fiscal year ended March 2026 (FY3/26), up JPY 405.0bn year on year and JPY 83.0bn above its target of JPY 1.5tn, as strong core businesses continued. Net business profit rose to JPY 2,330.9bn (+JPY 611.6bn YoY), and ROE improved to 10.4% (+2.4pt) with EPS rising to JPY 412 (+JPY 110). For FY3/27, SMFG targets net income of JPY 1,700.0bn.
Consolidated Results (FY3/26, Full-Year Actual)
Gross profit increased to JPY 4,844.7bn (+JPY 717.9bn YoY), supported by higher net interest income in the domestic market, increased fee income in domestic wholesale business, and strong performance in wealth management, payment and consumer finance businesses, despite a JPY (60)bn drag from bond portfolio rebalancing and JPY (30)bn from sales of low-return assets. G&A expenses rose to JPY 2,651.5bn (+JPY 249.6bn) mainly due to inflation and higher variable marketing costs, while the overhead ratio improved 3.5pt YoY to 54.7%. Total credit cost increased to JPY 388.4bn (+JPY 43.9bn), reflecting forward-looking provisions related to Middle East tensions (JPY 65bn) and disposal of NPLs at OTO/SOF (JPY 31bn). Ordinary profit reached JPY 2,303.4bn (+JPY 583.9bn) and net income was JPY 1,583.0bn (+JPY 405.0bn), both exceeding target.
| Item | FY3/26 Results (JPY bn) | YoY | vs. Target |
|---|---|---|---|
| Gross profit | 4,844.7 | +717.9 | – |
| G&A expenses | 2,651.5 | +249.6 | – |
| Overhead ratio | 54.7% | (3.5)% | – |
| Net business profit | 2,330.9 | +611.6 | +280.9 |
| Total credit cost | 388.4 | +43.9 | +88.4 |
| Gains (losses) on stocks | 446.1 | (63.8) | – |
| Ordinary profit | 2,303.4 | +583.9 | +193.4 |
| Net income | 1,583.0 | +405.0 | +83.0 |
| ROE | 10.4% | +2.4% | – |
| EPS (JPY) | 412 | +110 | – |
Segment Results by Business Unit
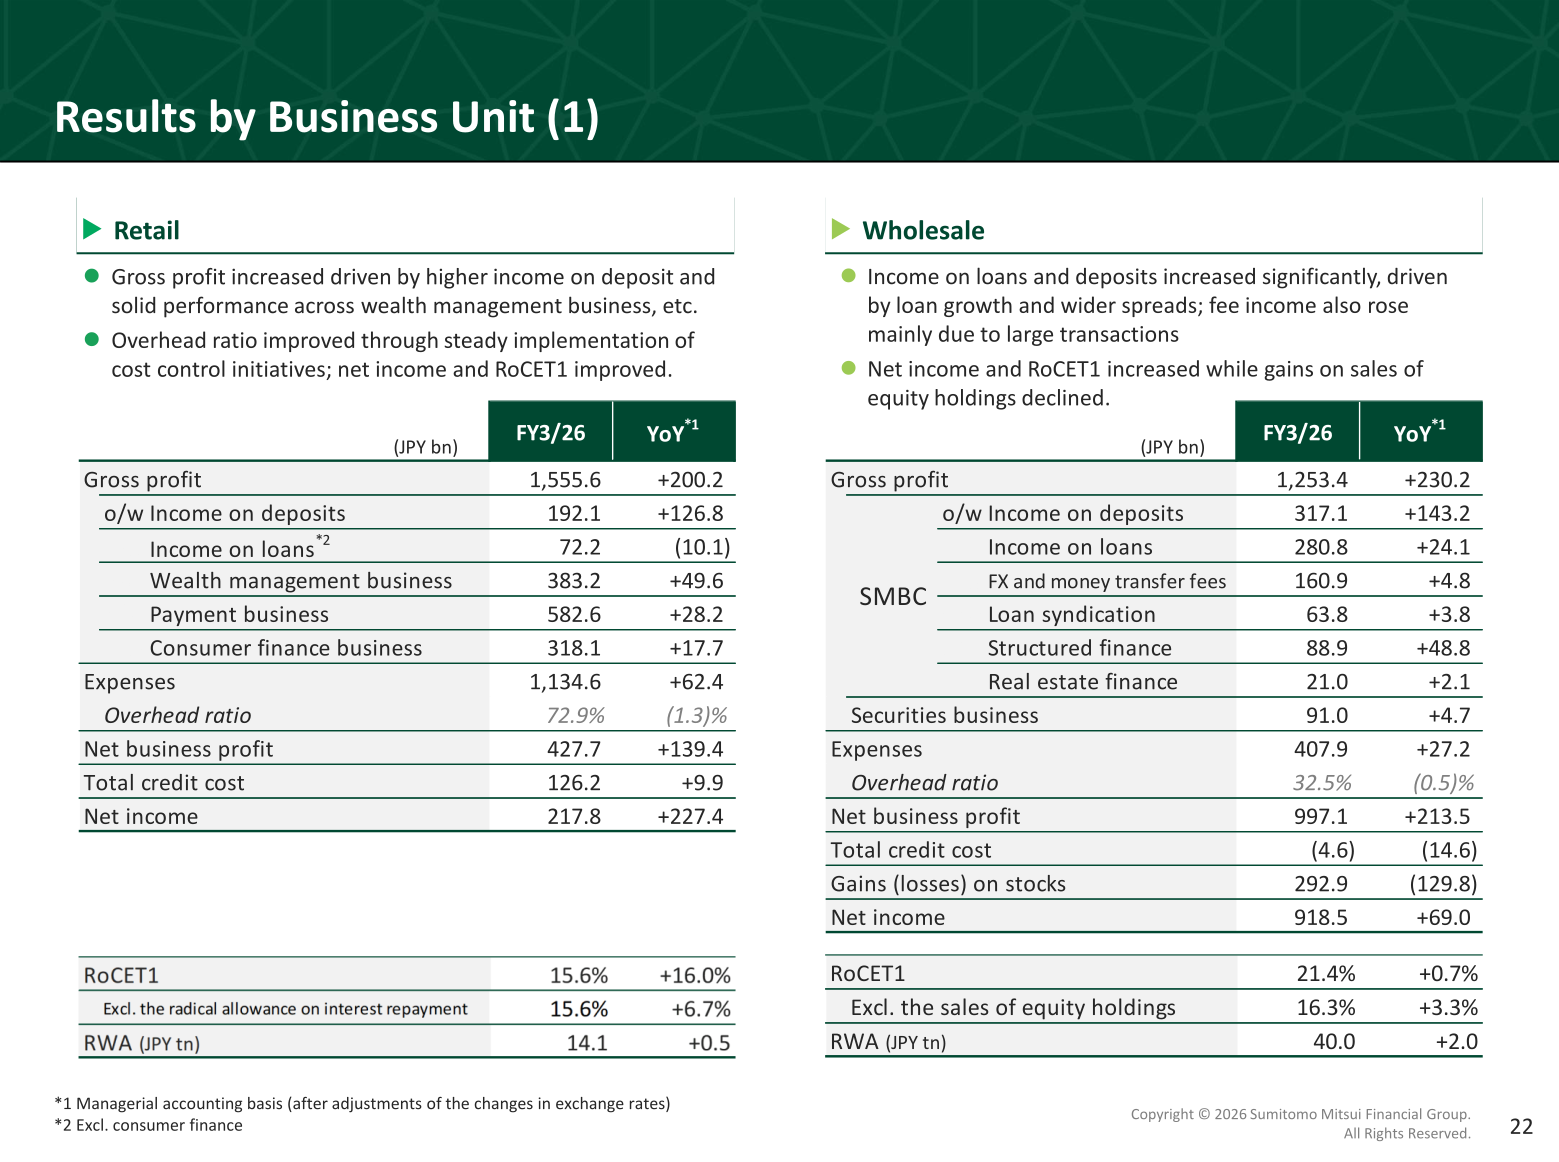
By business unit, net business profit grew across all units versus FY3/25: Retail +JPY 139.4bn, Wholesale +JPY 213.5bn, Global +JPY 16.3bn and Global Markets +JPY 39.0bn. Wholesale delivered the largest net income of JPY 918.5bn (+JPY 69.0bn) on significantly higher income on loans and deposits driven by loan growth and wider spreads, alongside rising fee income from large transactions, although gains on sales of equity holdings declined. Retail net income rose to JPY 217.8bn (+JPY 227.4bn) as gross profit increased on higher income on deposits and solid wealth management performance, with the overhead ratio improving through cost control initiatives. Global net income declined to JPY 321.0bn (-JPY 37.6bn) as credit costs rose due to a few large borrowers, while Global Markets net income increased to JPY 356.2bn (+JPY 28.8bn) as banking profit grew steadily despite volatile market conditions.
| Business Unit | Metric | FY3/26 (JPY bn) | YoY |
|---|---|---|---|
| Retail | Gross profit | 1,555.6 | +200.2 |
| Retail | Net business profit | 427.7 | +139.4 |
| Retail | Total credit cost | 126.2 | +9.9 |
| Retail | Net income | 217.8 | +227.4 |
| Wholesale | Gross profit | 1,253.4 | +230.2 |
| Wholesale | Net business profit | 997.1 | +213.5 |
| Wholesale | Total credit cost | (4.6) | (14.6) |
| Wholesale | Net income | 918.5 | +69.0 |
| Global | Gross profit | 1,550.9 | +110.1 |
| Global | Net business profit | 655.8 | +16.3 |
| Global | Total credit cost | 257.9 | +90.9 |
| Global | Net income | 321.0 | (37.6) |
| Global Markets | Gross profit | 697.8 | +56.7 |
| Global Markets | Net business profit | 508.7 | +39.0 |
| Global Markets | Net income | 356.2 | +28.8 |
FY3/27 Forecast
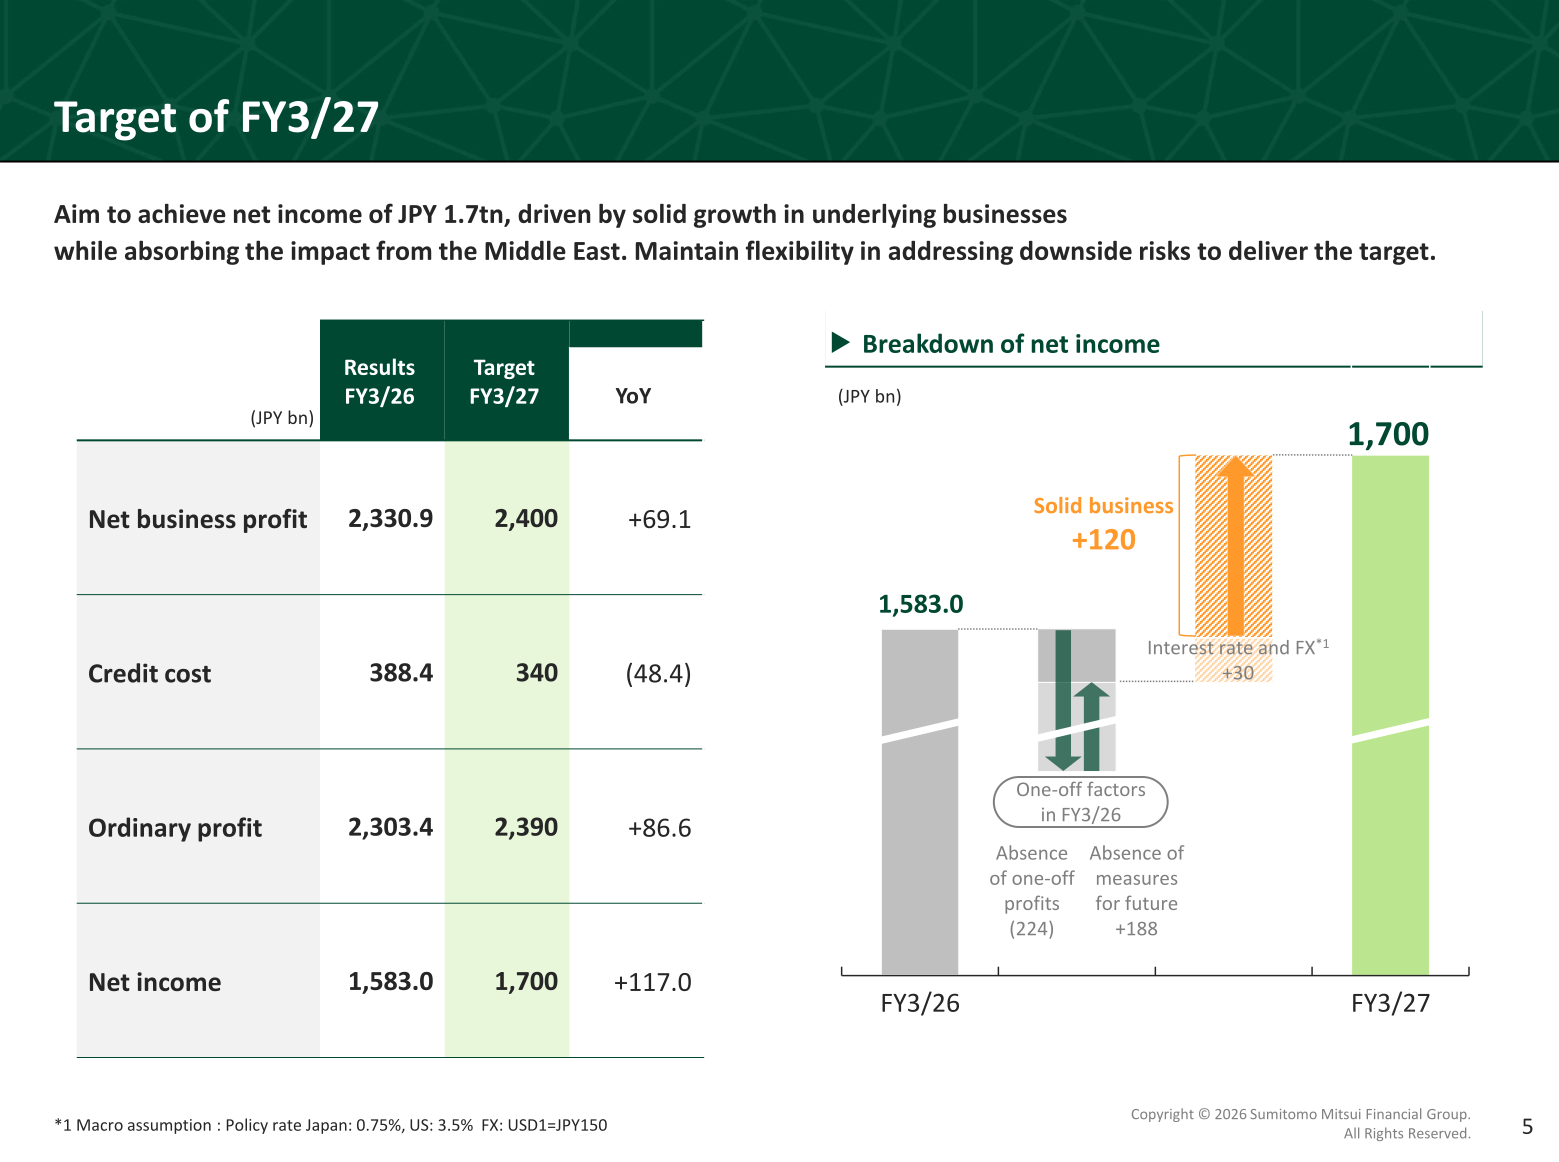
SMFG aims to achieve net income of JPY 1,700.0bn in FY3/27 (+JPY 117.0bn), driven by solid growth in underlying businesses while absorbing the impact from Middle East-related risks. The bridge to the target reflects solid business growth (+JPY 120bn) and a positive interest rate and FX impact (+JPY 30bn), offset by the absence of FY3/26’s one-off profits (JPY (224)bn) and the absence of FY3/26’s one-off measures for future business (+JPY 188bn). The target is based on a macro assumption of a 0.75% policy rate in Japan, 3.5% in the US, and FX of USD1=JPY150.
| Item | FY3/26 Results (JPY bn) | FY3/27 Target (JPY bn) | YoY |
|---|---|---|---|
| Net business profit | 2,330.9 | 2,400 | +69.1 |
| Credit cost | 388.4 | 340 | (48.4) |
| Ordinary profit | 2,303.4 | 2,390 | +86.6 |
| Net income | 1,583.0 | 1,700 | +117.0 |
Shareholder Returns
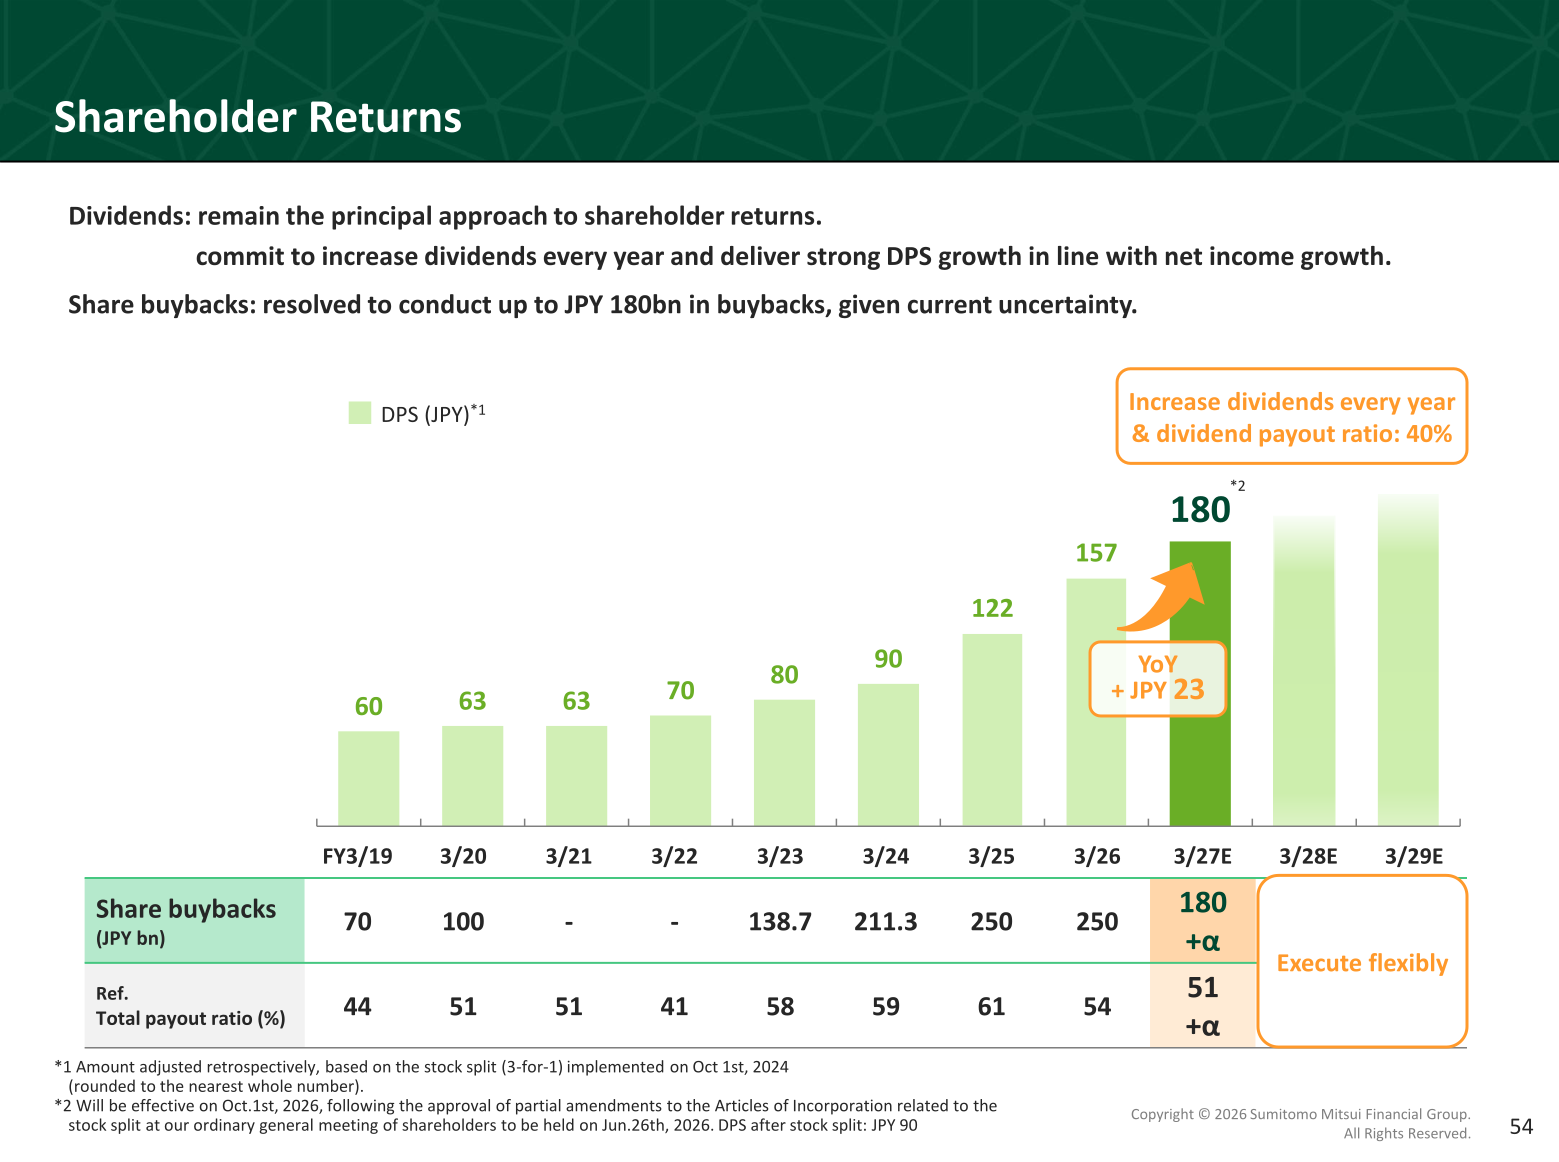
SMFG maintains a 40% dividend payout ratio target and has upgraded its progressive dividend policy to commit to increasing dividends every year, delivering strong DPS growth in line with net income growth. On a stock-split-adjusted basis, DPS rose to JPY 157 in FY3/26 from JPY 122 in FY3/25, with FY3/27E DPS set at JPY 180 (equivalent to JPY 90 after the 2-for-1 stock split scheduled to take effect October 1, 2026, subject to approval of related Articles of Incorporation amendments at the ordinary general meeting of shareholders on June 26, 2026). Share buybacks of JPY 250bn were executed in FY3/26, and SMFG has resolved to conduct up to JPY 180bn of buybacks in FY3/27, to be executed flexibly given current uncertainty. The CET1 ratio (finalized Basel III basis, excl. net unrealized gains on other securities) rose to 10.3% at March 2026 from 10.2% a year earlier, with an outlook of c. 10.5% at March 2027; the FY3/29 CET1 ratio target has been raised by 50bps to c. 10.5% (10.0%-11.0%) to reflect heightened geopolitical risks, business portfolio changes, and lower unrealized gains on equity holdings.
| Item | FY3/25 | FY3/26 | FY3/27E |
|---|---|---|---|
| DPS (JPY, stock-split-adjusted basis) | 122 | 157 | 180 |
| Total payout ratio | 61% | 54% | 51%+α |
| Share buybacks (JPY bn) | 250 | 250 | Up to 180 |
| CET1 ratio (Finalized Basel III basis) | 10.2% | 10.3% | c. 10.5% (outlook) |
Medium-Term Plan (FY3/27-FY3/29)
Under its new medium-term management plan for FY3/27-FY3/29, SMFG has set a three-year milestone of 13% ROTE (vs. 11.4% managerial-accounting-basis result in FY3/26) on the path to a longer-term 15% ROTE goal, targeting consolidated net income of JPY 2tn through cost discipline and improved RORA. The plan targets an overhead ratio in the low-50% range and a CET1 ratio (finalized Basel III basis) of c. 10.5% by March 2029. SMFG plans to reduce operating expenses by JPY 200bn over three years while investing JPY 120bn in key strategic initiatives such as the S&T business, global transaction banking, and asset management, and to invest JPY 1tn in IT over three years, twice the level of the previous medium-term plan (FY3/21-FY3/23).
This article is an analysis based on publicly available information and is not a recommendation to buy or sell any specific securities. Investment decisions are your own responsibility.
![[Obayashi] Investors’ Guide 2026 — The Complete 24-Article Breakdown](https://japan-equity.com/wp-content/uploads/2026/07/hub_cover-1024x1024.png)
![[Obayashi] IR & SR Policy — Feeding Dialogue Back into Management](https://japan-equity.com/wp-content/uploads/2026/07/p32_sq-1024x1024.jpg)
![[Obayashi] Real Estate Development — 18.7% Margin, ¥287.7bn Unrealized Gains](https://japan-equity.com/wp-content/uploads/2026/07/p20_sq-1024x1024.jpg)
![[Obayashi] Domestic Civil Engineering — Resilience Spending Supports 9.6% Margin](https://japan-equity.com/wp-content/uploads/2026/07/p11_sq-1024x1024.jpg)
![[Obayashi] Share Price & External Ratings — vs TOPIX, ESG Index Inclusion](https://japan-equity.com/wp-content/uploads/2026/07/p40_sq-1024x1024.jpg)
![[Construction] ¥75.5tn Investment, Shrinking Workforce — Big-5 Market Share](https://japan-equity.com/wp-content/uploads/2026/07/p12_sq-1024x1024.jpg)



![[Obayashi] Capital Policy & Shareholder Returns — ROE 10%+, DOE ~5%, ¥100bn Buyback](https://japan-equity.com/wp-content/uploads/2026/07/p27_sq-1024x1024.jpg)
![[Obayashi] Reducing Cross-Shareholdings — ¥285.2bn Sold in Five Years](https://japan-equity.com/wp-content/uploads/2026/07/p29_sq-1024x1024.jpg)
![[Obayashi] ¥750bn Investment Plan — ¥300bn to Development, ¥190bn to Tech/DX](https://japan-equity.com/wp-content/uploads/2026/07/p30_sq-1024x1024.jpg)
![[Obayashi] MTP2022 KPIs — Operating Profit ~2x Target, ROE 14.4%](https://japan-equity.com/wp-content/uploads/2026/07/p25_sq-1024x1024.jpg)
![[Obayashi] Cash Allocation — ¥420bn Investment CF Over Five Years](https://japan-equity.com/wp-content/uploads/2026/07/p26_sq-1024x1024.jpg)
![[Obayashi] Green Energy — 44 Plants, 344MW, and the Green Hydrogen Challenge](https://japan-equity.com/wp-content/uploads/2026/07/p21_sq-1024x1024.jpg)
![[Obayashi] Tackling the Labor Shortage — Robotics Construction®](https://japan-equity.com/wp-content/uploads/2026/07/p14_sq-1024x1024.jpg)
