
This article is based on publicly available IR materials and is not a recommendation to buy or sell any specific securities.
Note: Tama Home does not publish an English results presentation; this article is an English translation of the Japanese-language article on our sister site Investalk, which is based on the company’s Japanese-language IR materials, with figures transcribed as reported. Note also that Tama Home’s fiscal year ends in May: the latest completed fiscal year, classified as FY2025 in this site’s title and URL, is the fiscal year ended May 31, 2026, and the body text, tables and segment data retain the source’s own period labels. Yen amounts in the tables are in units of ¥100 million, except for segment operating profit, which is in millions of yen, following the source materials.
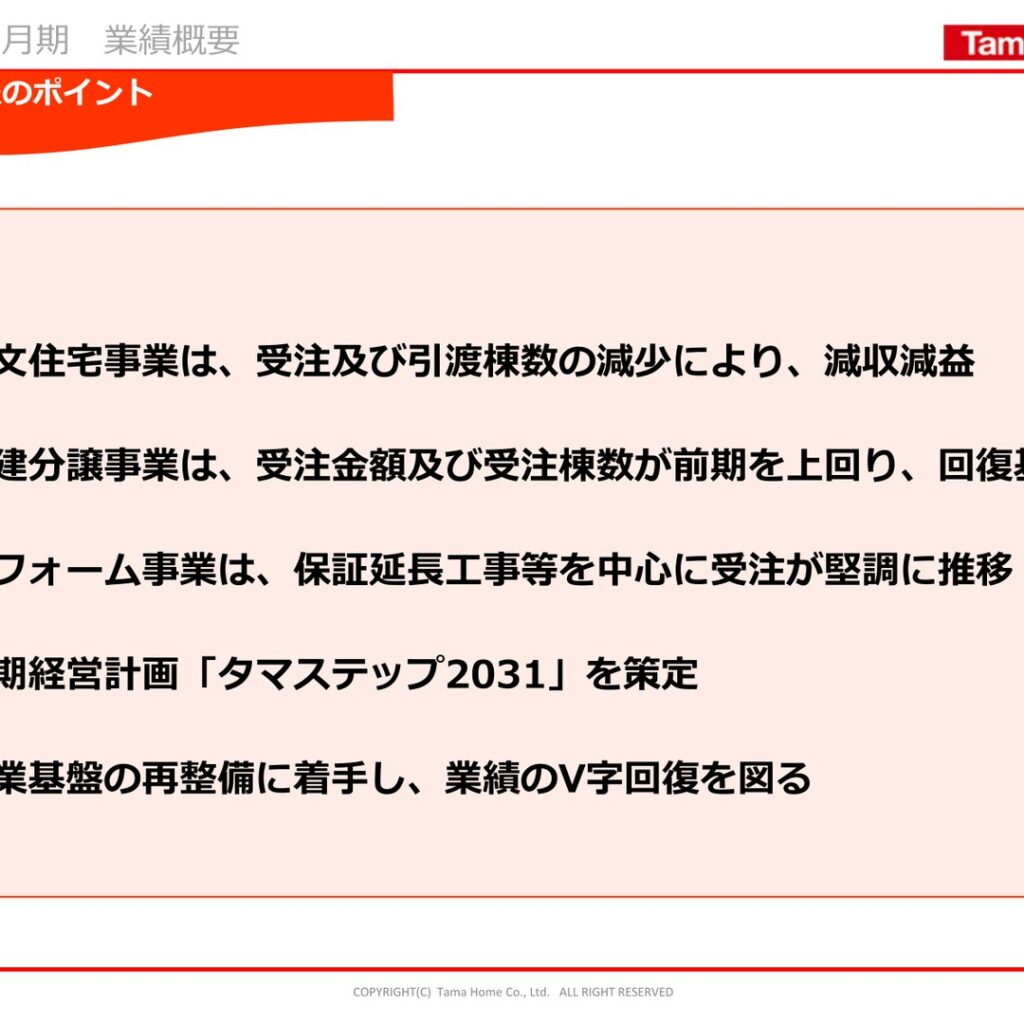
For the fiscal year ended May 31, 2026 (consolidated), Tama Home posted lower sales and lower profit as the custom-built housing business declined on a drop in orders and delivered units, while the detached-house subdivision business is on a recovery trend, with order value and order units both above the previous fiscal year. In the remodeling business, orders were firm, centered on warranty-extension work. The company has formulated the medium-term management plan “Tama Step 2031” and has begun rebuilding its business foundation, aiming for a V-shaped recovery in earnings.
Consolidated Results (Fiscal Year Ended May 31, 2026, Actual)
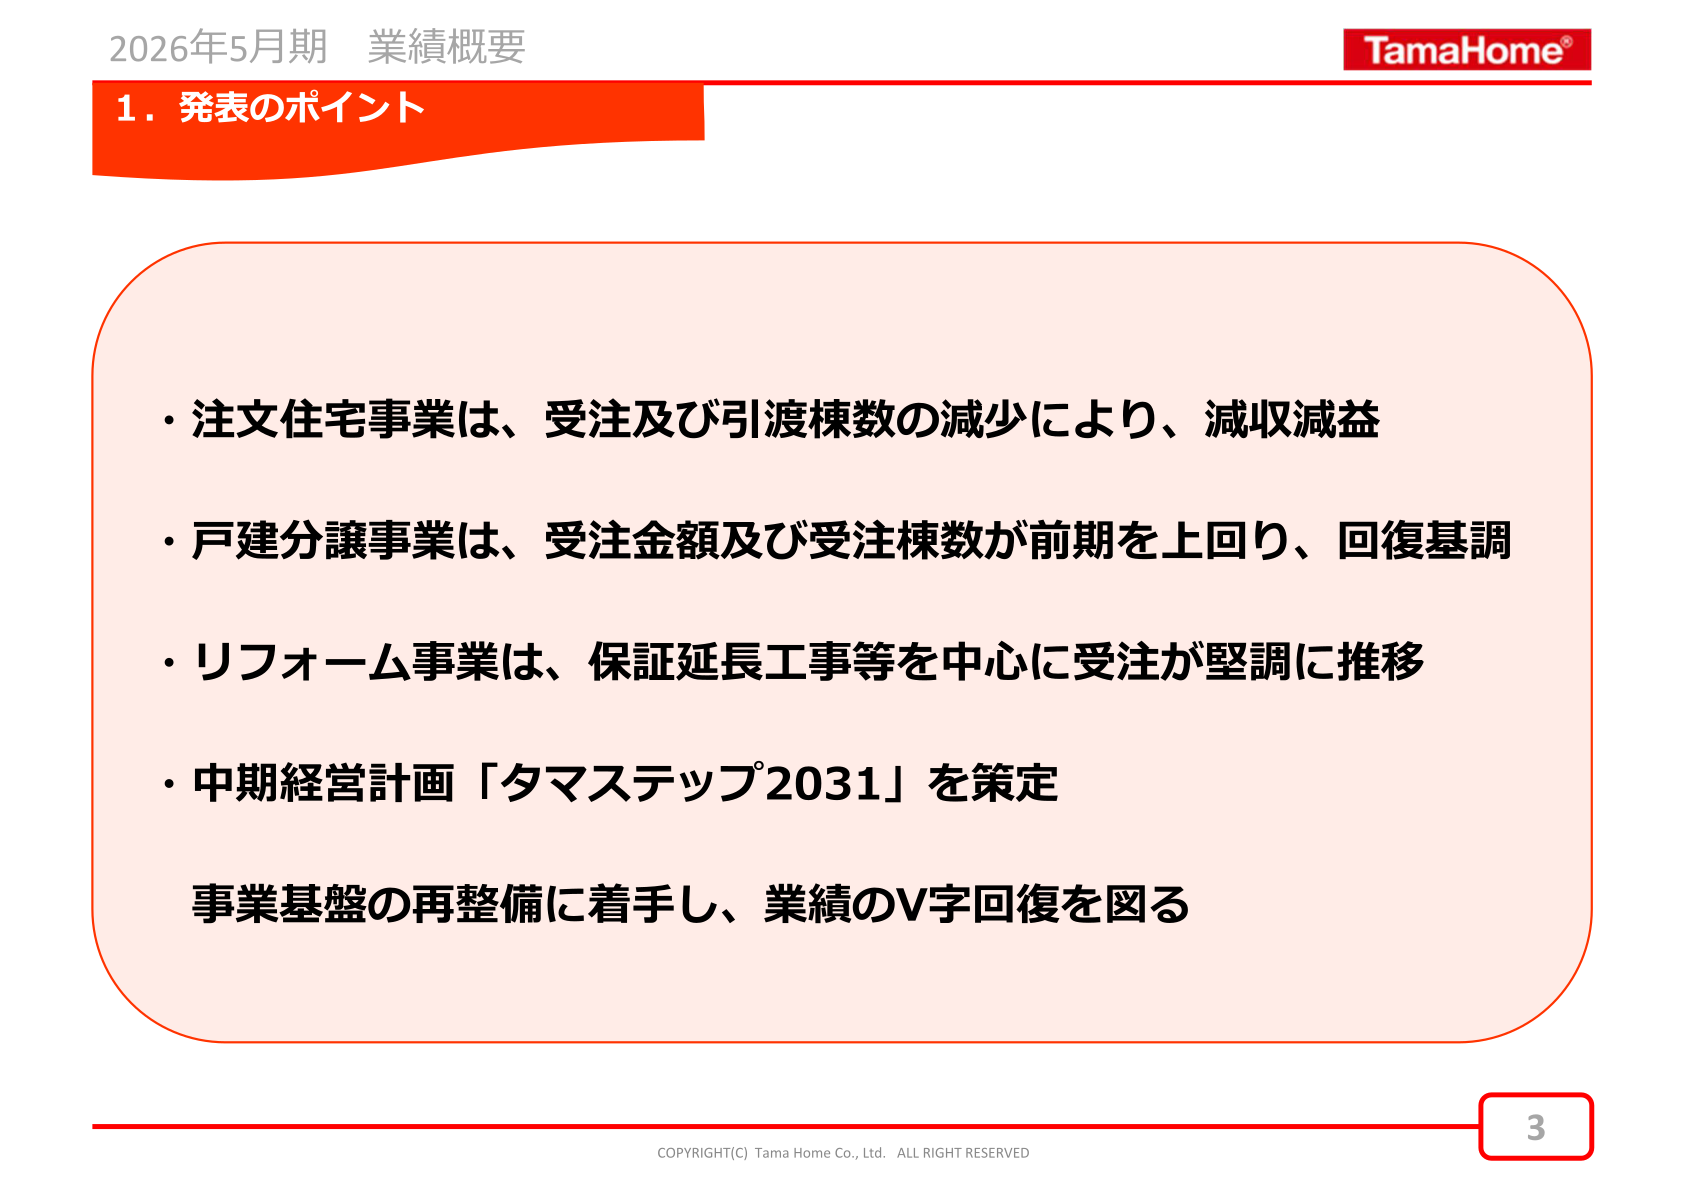
Net sales were ¥197.7 billion (down 1.5% year on year), operating profit ¥3.8 billion (down 6.6%), ordinary profit ¥3.7 billion (down 0.8%), and profit attributable to owners of parent ¥1.2 billion (down 17.9%), for lower sales and lower profit. The gross profit margin was 24.2% (previous fiscal year: 25.4%).
| Item | FY ended May 2026 (¥100 million) | FY ended May 2025 (¥100 million) | Change |
|---|---|---|---|
| Net sales | 1,977 | 2,008 | △1.5% |
| Gross profit | 479 (24.2%) | 511 (25.4%) | △6.3% |
| Operating profit | 38 (1.9%) | 41 (2.0%) | △6.6% |
| Ordinary profit | 37 (1.9%) | 37 (1.9%) | △0.8% |
| Profit before income taxes | 21 (1.1%) | 27 (1.4%) | △21.2% |
| Profit attributable to owners of parent | 12 (0.6%) | 14 (0.7%) | △17.9% |
Segment Results
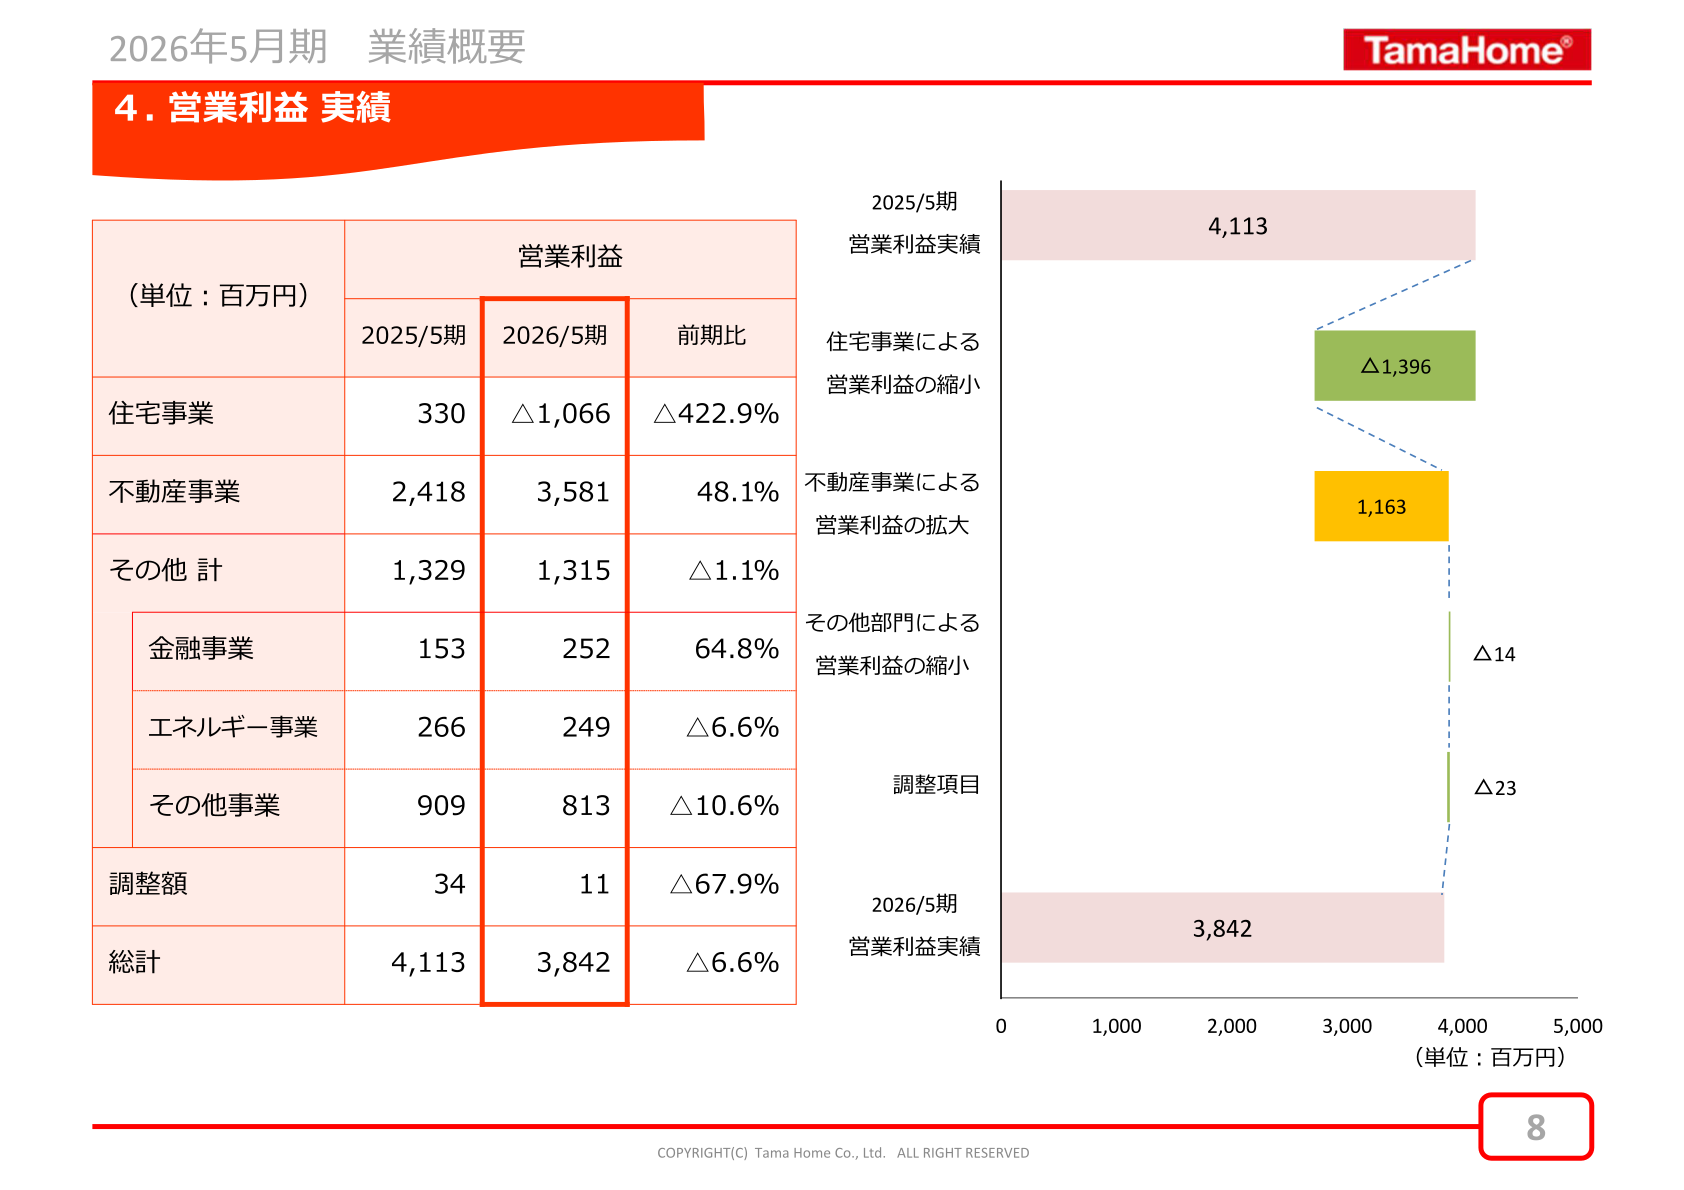
In the custom-built housing business, order value for the fiscal year was ¥167.4 billion (down 3.9% year on year), orders 7,195 units (down 2.4%), delivery value ¥124.4 billion (down 6.8%) and deliveries 5,176 units (down 7.5%), with both orders and deliveries declining. In the detached-house subdivision business, order value was ¥52.8 billion (up 15.5%), orders 1,614 units (up 10.5%), delivery value ¥47.6 billion (up 14.0%) and deliveries 1,444 units (up 7.1%), putting the business on a recovery trend. In the remodeling business, order value was ¥12.0 billion (up 0.2%) and net sales ¥10.0 billion (down 9.5%). In the real estate business (excluding detached-house subdivisions), operating profit expanded on sales recorded for items such as the sale of one building of office condominium ownership at TWG Kagurazaka and TWG Nihonbashi Ningyocho. By segment operating profit, the Housing business swung to an operating loss of △1,066 million yen, while the Real Estate business posted 3,581 million yen (up 48.1%).
| Segment | Net sales, FY ended May 2026 (¥100 million) | Net sales, FY ended May 2025 (¥100 million) | Operating profit, FY ended May 2026 (¥ million) | Operating profit, FY ended May 2025 (¥ million) |
|---|---|---|---|---|
| Housing | 1,359 | 1,461 | △1,066 | 330 |
| Real Estate | 549 | 478 | 3,581 | 2,418 |
| Finance | 9 | 9 | 252 | 153 |
| Energy | 8 | 8 | 249 | 266 |
| Other | 51 | 51 | 813 | 909 |
Full-Year Forecast (Fiscal Year Ending May 31, 2027, Plan)
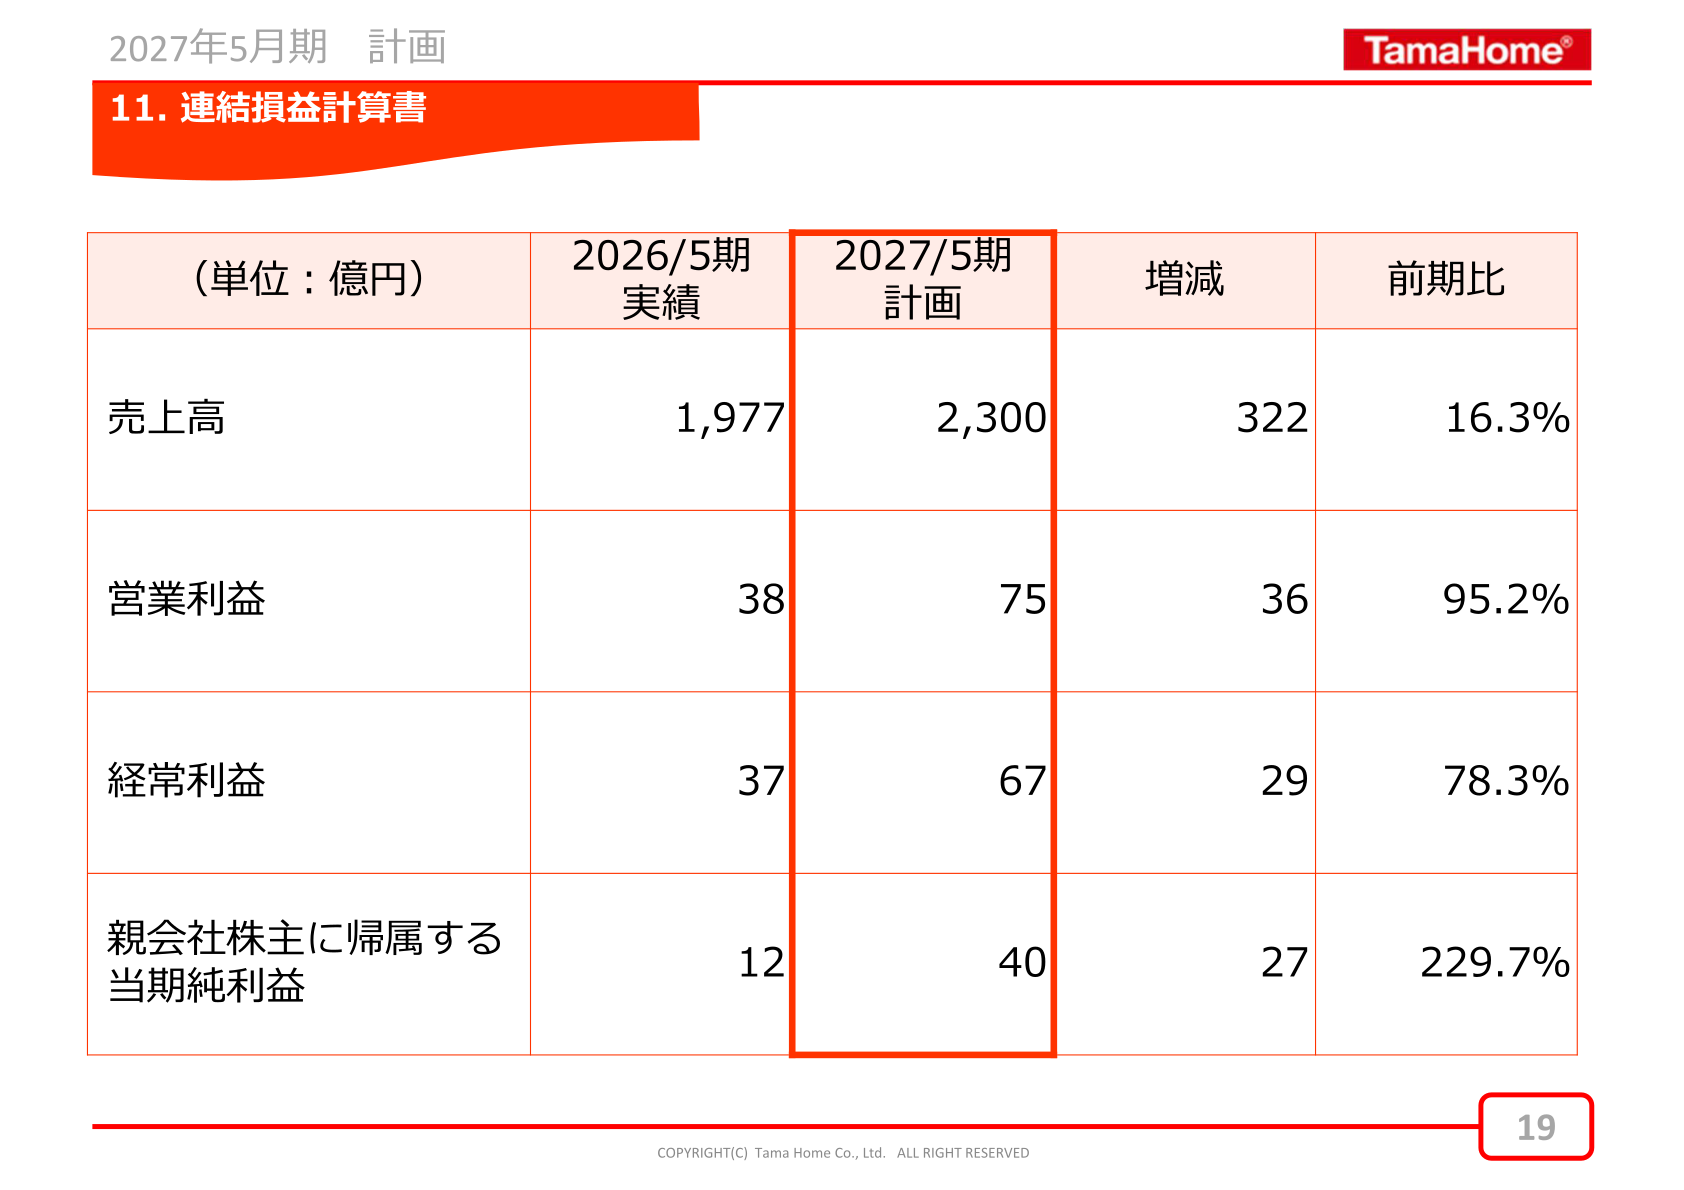
The consolidated forecast for the fiscal year ending May 31, 2027 calls for net sales of ¥230.0 billion (up 16.3% year on year), operating profit of ¥7.5 billion (up 95.2%), ordinary profit of ¥6.7 billion (up 78.3%) and profit attributable to owners of parent of ¥4.0 billion (up 229.7%).
| Item | FY ending May 2027 (Plan, ¥100 million) | FY ended May 2026 (Actual, ¥100 million) | Change |
|---|---|---|---|
| Net sales | 2,300 | 1,977 | 16.3% |
| Operating profit | 75 | 38 | 95.2% |
| Ordinary profit | 67 | 37 | 78.3% |
| Profit attributable to owners of parent | 40 | 12 | 229.7% |
Shareholder Returns
The annual dividend for the fiscal year ended May 31, 2026 was ¥125 per share (payout ratio 268.4%), below the initial forecast of ¥196. For the fiscal year ending May 31, 2027, the initial plan calls for ¥130 per share (forecast payout ratio 94.2%).
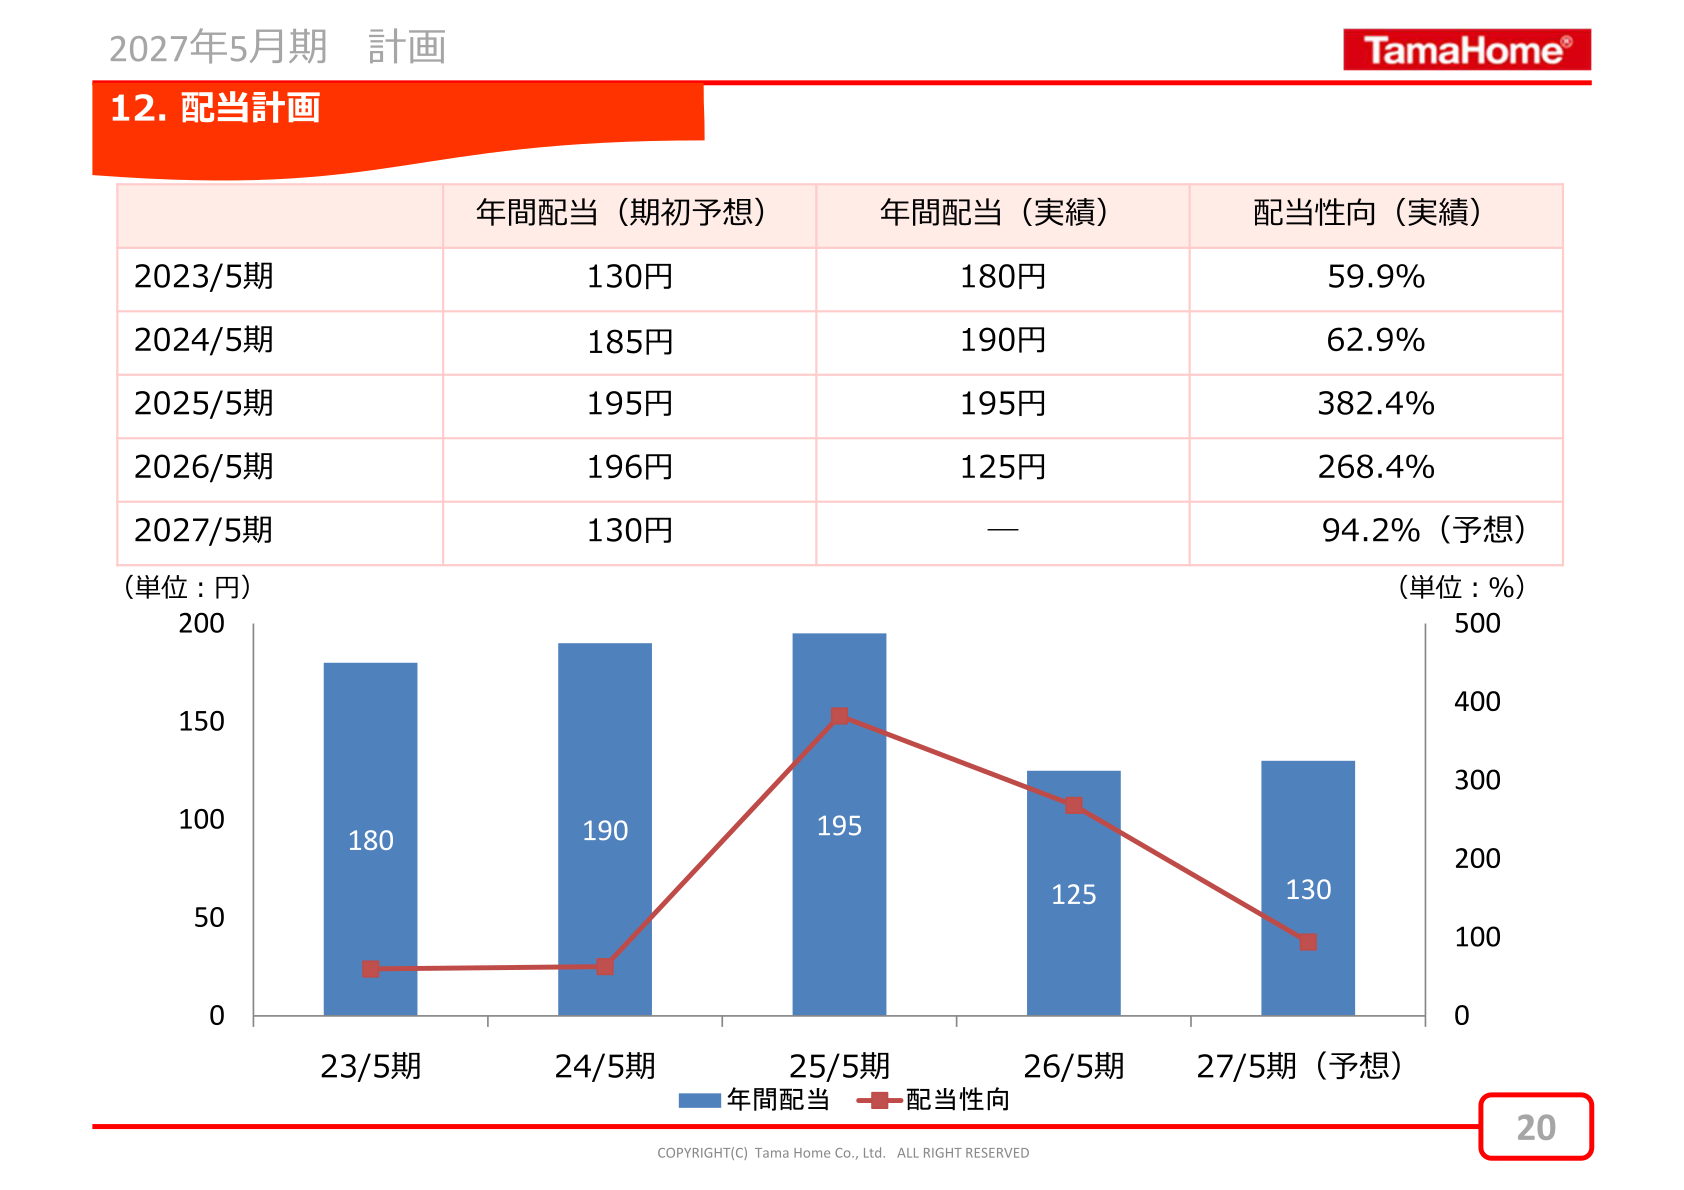
| Fiscal year | Annual dividend (initial forecast) | Annual dividend (actual) | Payout ratio (actual) |
|---|---|---|---|
| FY ended May 2023 | ¥130 | ¥180 | 59.9% |
| FY ended May 2024 | ¥185 | ¥190 | 62.9% |
| FY ended May 2025 | ¥195 | ¥195 | 382.4% |
| FY ended May 2026 | ¥196 | ¥125 | 268.4% |
| FY ending May 2027 | ¥130 | — | 94.2% (forecast) |
Medium-Term Management Plan “Tama Step 2031”
During the fiscal year the company formulated a new medium-term management plan, “Tama Step 2031.” It has begun rebuilding its business foundation and aims to achieve a V-shaped recovery in earnings.
This article is an analysis based on publicly available information and is not a recommendation to buy or sell any specific securities. Investment decisions are your own responsibility.
![[Obayashi] Investors’ Guide 2026 — The Complete 24-Article Breakdown](https://japan-equity.com/wp-content/uploads/2026/07/hub_cover-1024x1024.png)
![[Obayashi] IR & SR Policy — Feeding Dialogue Back into Management](https://japan-equity.com/wp-content/uploads/2026/07/p32_sq-1024x1024.jpg)
![[Obayashi] Real Estate Development — 18.7% Margin, ¥287.7bn Unrealized Gains](https://japan-equity.com/wp-content/uploads/2026/07/p20_sq-1024x1024.jpg)
![[Obayashi] Domestic Civil Engineering — Resilience Spending Supports 9.6% Margin](https://japan-equity.com/wp-content/uploads/2026/07/p11_sq-1024x1024.jpg)
![[Obayashi] Share Price & External Ratings — vs TOPIX, ESG Index Inclusion](https://japan-equity.com/wp-content/uploads/2026/07/p40_sq-1024x1024.jpg)
![[Construction] ¥75.5tn Investment, Shrinking Workforce — Big-5 Market Share](https://japan-equity.com/wp-content/uploads/2026/07/p12_sq-1024x1024.jpg)



![[Obayashi] Capital Policy & Shareholder Returns — ROE 10%+, DOE ~5%, ¥100bn Buyback](https://japan-equity.com/wp-content/uploads/2026/07/p27_sq-1024x1024.jpg)
![[Obayashi] Reducing Cross-Shareholdings — ¥285.2bn Sold in Five Years](https://japan-equity.com/wp-content/uploads/2026/07/p29_sq-1024x1024.jpg)
![[Obayashi] ¥750bn Investment Plan — ¥300bn to Development, ¥190bn to Tech/DX](https://japan-equity.com/wp-content/uploads/2026/07/p30_sq-1024x1024.jpg)
![[Obayashi] MTP2022 KPIs — Operating Profit ~2x Target, ROE 14.4%](https://japan-equity.com/wp-content/uploads/2026/07/p25_sq-1024x1024.jpg)
![[Obayashi] Cash Allocation — ¥420bn Investment CF Over Five Years](https://japan-equity.com/wp-content/uploads/2026/07/p26_sq-1024x1024.jpg)
![[Obayashi] Green Energy — 44 Plants, 344MW, and the Green Hydrogen Challenge](https://japan-equity.com/wp-content/uploads/2026/07/p21_sq-1024x1024.jpg)
![[Obayashi] Tackling the Labor Shortage — Robotics Construction®](https://japan-equity.com/wp-content/uploads/2026/07/p14_sq-1024x1024.jpg)
