
This article is based on publicly available IR materials and is not a recommendation to buy or sell any specific securities.
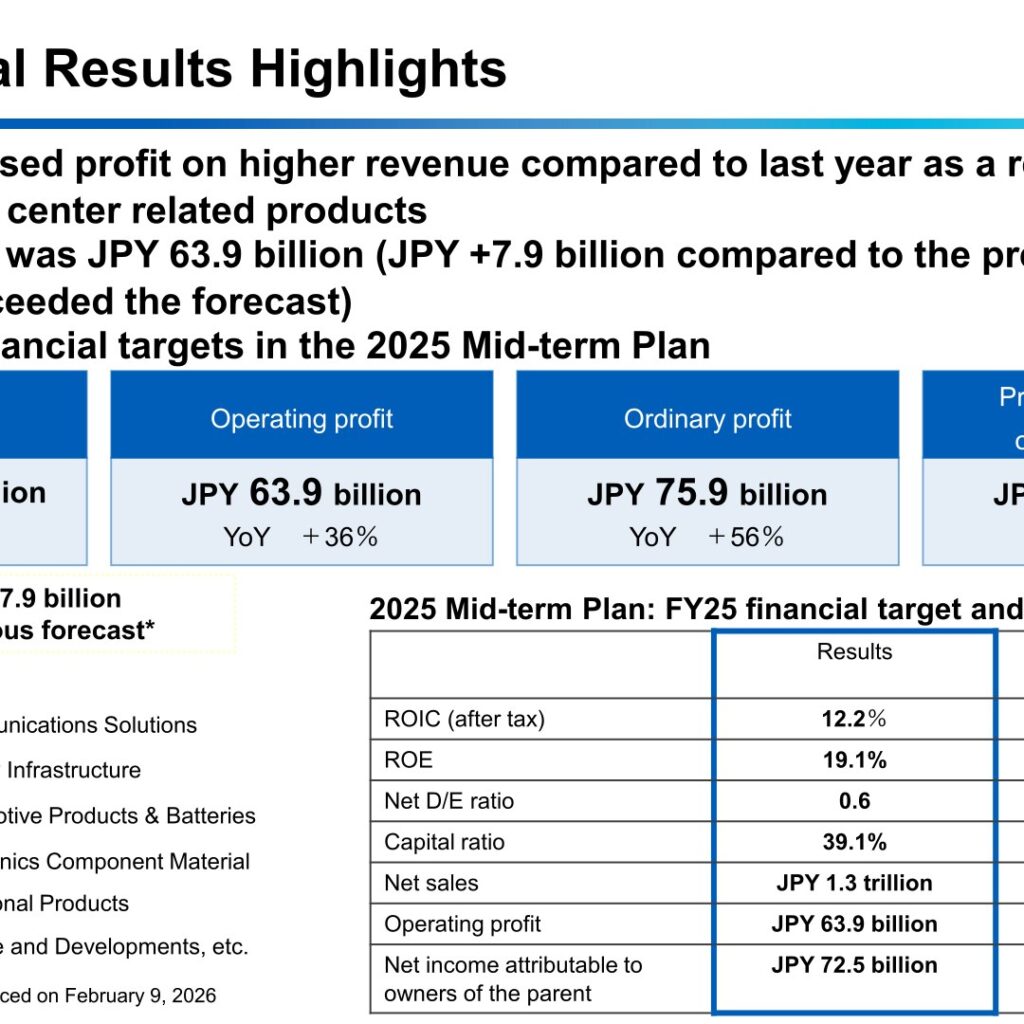
Furukawa Electric Co., Ltd. reported FY2025 (fiscal year ended March 31, 2026) net sales of JPY 1,307.6 billion, up 9% year on year, with operating profit of JPY 63.9 billion (up 36%), ordinary profit of JPY 75.9 billion (up 56%) and profit attributable to owners of parent of JPY 72.5 billion (up 117%). The company attributed the increase in profit on higher revenue to increased demand for data center related products, and operating profit came in JPY 7.9 billion above the previous forecast announced on February 9, 2026, with all segments exceeding that forecast. The company also stated that it achieved the financial targets in the 2025 Mid-term Plan. For FY2026 it forecasts net sales of JPY 1,460.0 billion and operating profit of JPY 95.0 billion.
Consolidated Results (Full-Year Actual)
Net sales rose JPY 105.8 billion year on year to JPY 1,307.6 billion, which the materials attribute to increased profit on higher revenue in all segments and the impact of soaring copper prices. The operating margin improved to 4.9% from 3.9%. Ordinary profit of JPY 75.9 billion reflected strong results at entities accounted for using the equity method (share of profit of JPY 16.5 billion). Extraordinary income (losses) of JPY 29.1 billion included a gain on the revision to the retirement benefit plan and decreased recording of provision for product warranties. The average copper price was JPY 1,695/kg and the average exchange rate was JPY 151/USD.
| Item (JPY billion) | FY24 Results | FY25 Previous Forecasts | FY25 Results | YoY change | Change from previous forecasts |
|---|---|---|---|---|---|
| Net sales | 1,201.8 | 1,300.0 | 1,307.6 | +105.8 | +7.6 |
| Operating profit | 47.0 | 56.0 | 63.9 | +16.8 | +7.9 |
| (Margin) | 3.9% | 4.3% | 4.9% | +1.0 | +0.6 |
| Share of profit (loss) of entities accounted for using equity method | 10.6 | - | 16.5 | +5.9 | - |
| Ordinary profit | 48.5 | 65.0 | 75.9 | +27.4 | +10.9 |
| (Margin) | 4.0% | 5.0% | 5.8% | +1.8 | +0.8 |
| Extraordinary income (losses) | 5.5 | 16.5 | 29.1 | +23.6 | +12.6 |
| Profit attributable to owners of parent | 33.4 | 54.0 | 72.5 | +39.2 | +18.5 |
| (Margin) | 2.8% | 4.2% | 5.5% | +2.8 | +1.4 |
| Average copper price (JPY/kg) | 1,478 | 1,694 | 1,695 | +217 | +1 |
| Average exchange rate (JPY/USD) | 153 | 149 | 151 | (2) | +2 |
On the balance sheet, total assets increased by JPY 78.3 billion to JPY 1,066.4 billion at the end of FY25Q4. The equity capital ratio improved to 39.1% from 34.6%, the net D/E ratio fell to 0.59 from 0.72, and ROE rose to 19.1% from 10.0%. Net interest-bearing debt was JPY 247.5 billion. Free cash flow was JPY (19.0) billion in FY25 versus JPY +52.6 billion in FY24, with operating cash flow of JPY +28.1 billion and investing cash flow of JPY (47.1) billion.
Segment Results
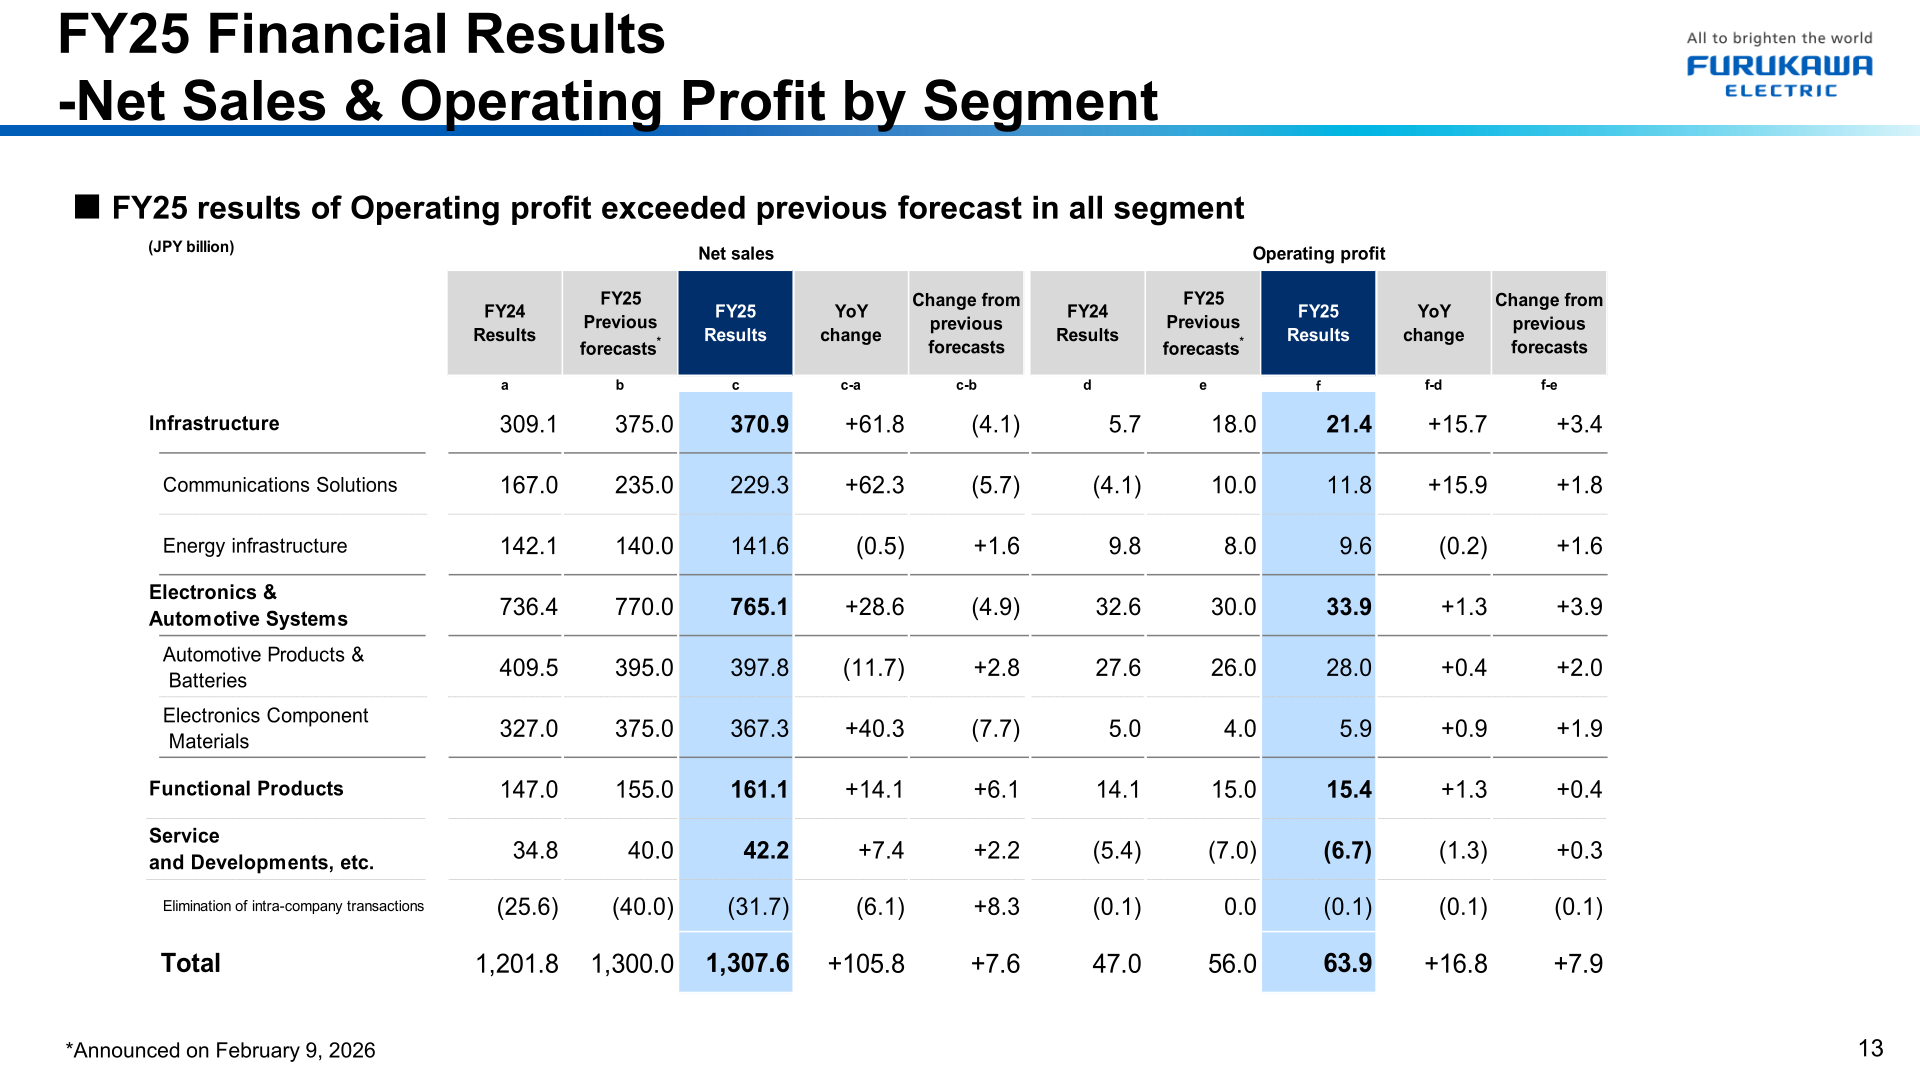
FY25 operating profit exceeded the previous forecast in all segments. Communications Solutions swung to an operating profit of JPY 11.8 billion from a loss of JPY (4.1) billion, on increased sales of data center related products and the impact from new consolidations. Electronics Component Materials posted increased profit on higher revenue on a gradual recovery in demand and improvement in the product mix. Automotive Products & Batteries recorded increased profit on lower revenue, reflecting slightly increased sales for Japan and price optimization against decreased sales of batteries and the deconsolidation of the battery business from Q4 onward; the materials put the impact of that deconsolidation at approximately JPY (21.0) billion of net sales and approximately JPY (2.0) billion of operating profit. Functional Products delivered increased profit on higher revenue on increased sales of data center related products, while Service and Developments, etc. saw decreased profit on higher revenue due to increased expenses incurred for launching new businesses.
| Segment (JPY billion) | Net sales FY24 | Net sales FY25 | Net sales YoY | Operating profit FY24 | Operating profit FY25 | Operating profit YoY |
|---|---|---|---|---|---|---|
| Infrastructure | 309.1 | 370.9 | +61.8 | 5.7 | 21.4 | +15.7 |
| Communications Solutions | 167.0 | 229.3 | +62.3 | (4.1) | 11.8 | +15.9 |
| Energy Infrastructure | 142.1 | 141.6 | (0.5) | 9.8 | 9.6 | (0.2) |
| Electronics & Automotive Systems | 736.4 | 765.1 | +28.6 | 32.6 | 33.9 | +1.3 |
| Automotive Products & Batteries | 409.5 | 397.8 | (11.7) | 27.6 | 28.0 | +0.4 |
| Electronics Component Materials | 327.0 | 367.3 | +40.3 | 5.0 | 5.9 | +0.9 |
| Functional Products | 147.0 | 161.1 | +14.1 | 14.1 | 15.4 | +1.3 |
| Service and Developments, etc. | 34.8 | 42.2 | +7.4 | (5.4) | (6.7) | (1.3) |
| Elimination of intra-company transactions | (25.6) | (31.7) | (6.1) | (0.1) | (0.1) | (0.1) |
| Total | 1,201.8 | 1,307.6 | +105.8 | 47.0 | 63.9 | +16.8 |
FY2026 Forecast
For FY26 the company forecasts net sales of JPY 1,460.0 billion (up 12%), operating profit of JPY 95.0 billion (up 49%), ordinary profit of JPY 100.0 billion (up 32%) and profit attributable to owners of parent of JPY 82.0 billion (up 13%), assuming an average copper price of JPY 2,000/kg and an average exchange rate of JPY 150/USD. Growth of data center related products is cited as the driver, including plans to start mass production of water-cooled module products (scheduled in June 2026), net sales growth of rollable ribbon cable, MT ferrules and optical semiconductor products (DFB laser chips, etc.), and a shift in the product mix of copper foil products. The company notes that the impact of the tense situation in the Middle East — increases in raw material and transportation costs, primarily synthetic resins, and changes in customer demand — has not been reflected in the FY2026 forecast because it is currently not possible to reasonably estimate it.
| Item (JPY billion) | FY25 Results | FY26 Forecasts | YoY change |
|---|---|---|---|
| Net sales | 1,307.6 | 1,460.0 | +152.4 |
| Operating profit | 63.9 | 95.0 | +31.1 |
| (Margin) | 4.9% | 6.5% | +1.6 |
| Ordinary profit | 75.9 | 100.0 | +24.1 |
| (Margin) | 5.8% | 6.8% | +1.0 |
| Extraordinary income (losses) | 29.1 | 21.0 | (8.0) |
| Profit attributable to owners of parent | 72.5 | 82.0 | +9.5 |
| (Margin) | 5.5% | 5.6% | +0.1 |
| Average copper price (JPY/kg) | 1,695 | 2,000 | +305 |
| Average exchange rate (JPY/USD) | 151 | 150 | (1) |
| CAPEX | 56.7 | 150.0 | +93.3 |
| Depreciation and amortization | 43.2 | 46.0 | +2.8 |
| R&D expenses | 28.4 | 30.0 | +1.6 |
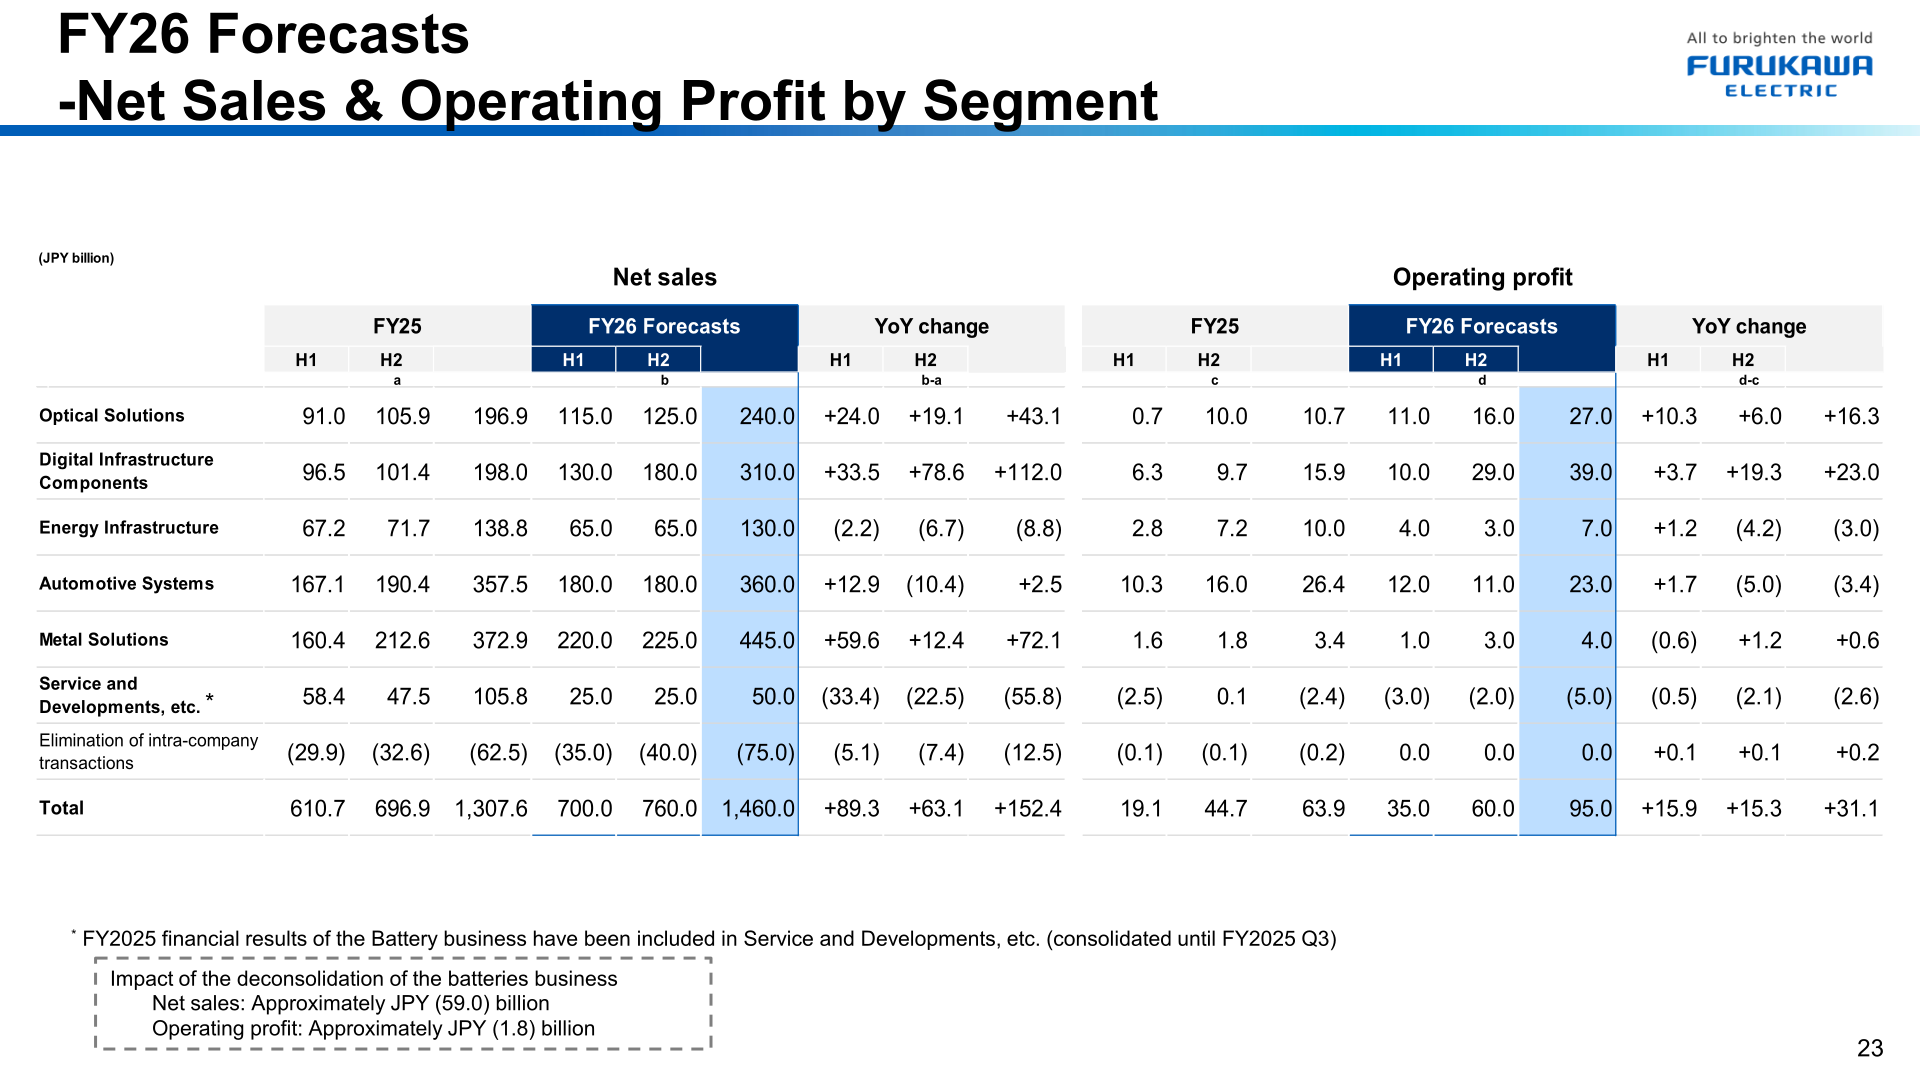
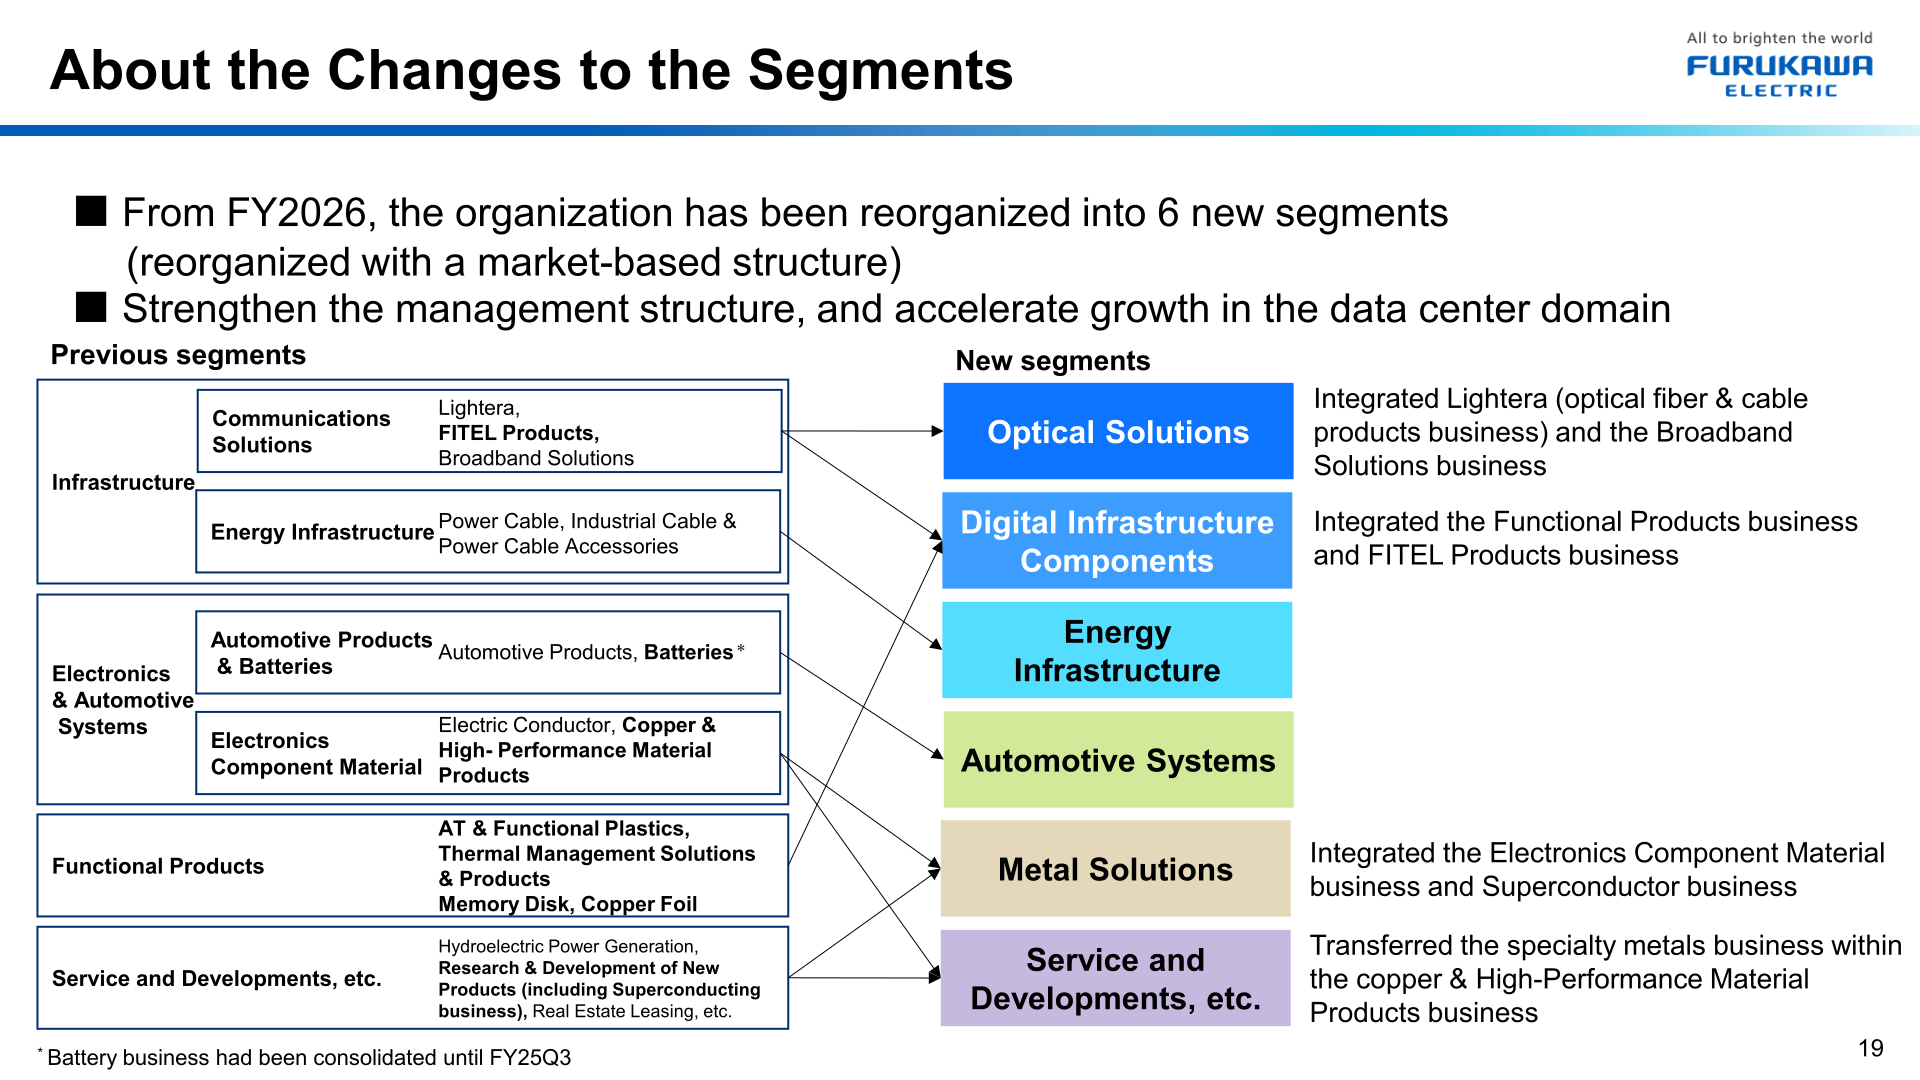
From FY2026 the organization has been reorganized into 6 new segments with a market-based structure, in order to strengthen the management structure and accelerate growth in the data center domain. The FY26 forecast is presented on this new basis, with FY25 figures restated accordingly. FY2025 results of the Battery business (consolidated until FY2025 Q3) have been included in Service and Developments, etc.; the impact of the deconsolidation of the batteries business is given as approximately JPY (59.0) billion of net sales and approximately JPY (1.8) billion of operating profit.
| New segment (JPY billion) | Net sales FY25 | Net sales FY26 Forecast | Net sales YoY | Operating profit FY25 | Operating profit FY26 Forecast | Operating profit YoY |
|---|---|---|---|---|---|---|
| Optical Solutions | 196.9 | 240.0 | +43.1 | 10.7 | 27.0 | +16.3 |
| Digital Infrastructure Components | 198.0 | 310.0 | +112.0 | 15.9 | 39.0 | +23.1 |
| Energy Infrastructure | 138.8 | 130.0 | (8.8) | 10.0 | 7.0 | (3.0) |
| Automotive Systems | 357.5 | 360.0 | +2.5 | 26.4 | 23.0 | (3.4) |
| Metal Solutions | 372.9 | 445.0 | +72.1 | 3.4 | 4.0 | +0.6 |
| Service and Developments, etc. | 105.8 | 50.0 | (55.8) | (2.4) | (5.0) | (2.6) |
| Elimination of intra-company transactions | (62.5) | (75.0) | (12.5) | (0.2) | 0.0 | +0.2 |
| Total | 1,307.6 | 1,460.0 | +152.4 | 63.9 | 95.0 | +31.1 |
Shareholder Returns
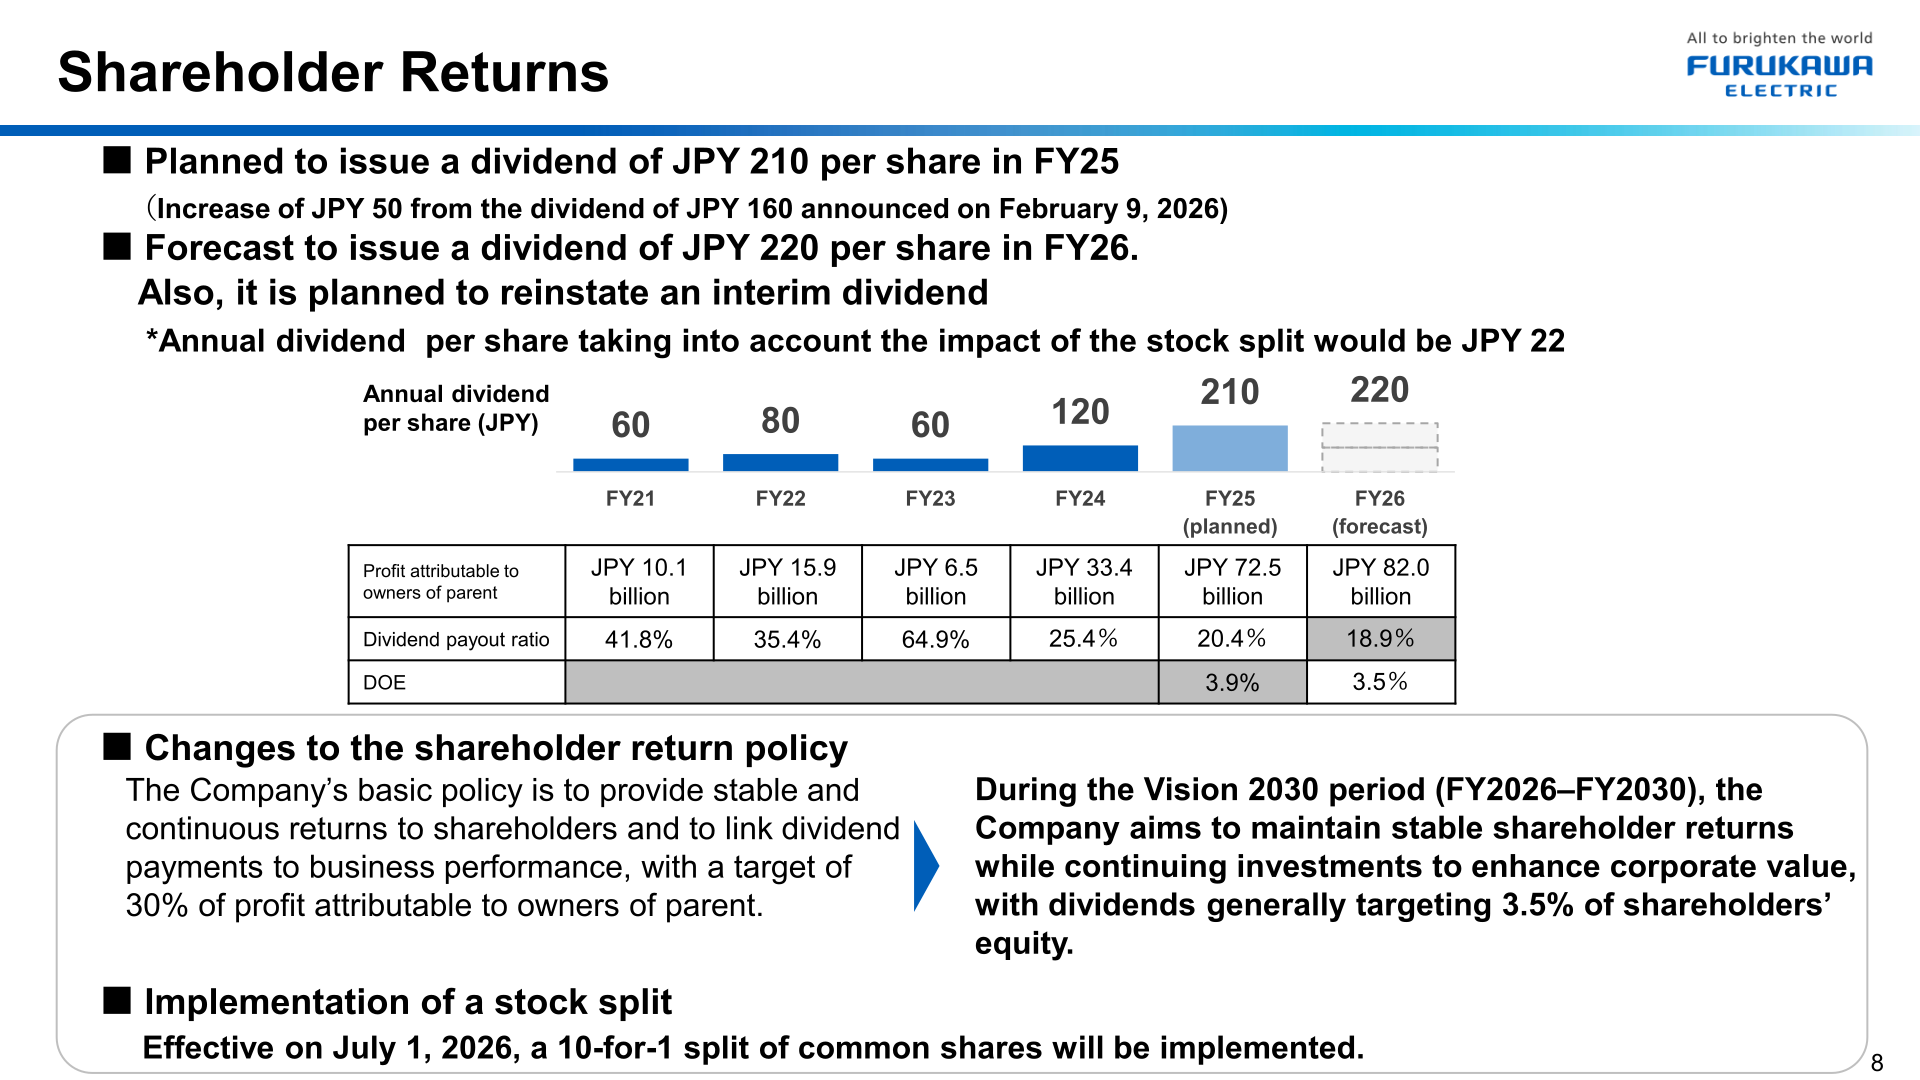
The company plans to issue a dividend of JPY 210 per share in FY25, an increase of JPY 50 from the dividend of JPY 160 announced on February 9, 2026, and forecasts a dividend of JPY 220 per share in FY26, when it also plans to reinstate an interim dividend. A 10-for-1 split of common shares will be implemented effective July 1, 2026; the materials note that the annual dividend per share taking into account the impact of the stock split would be JPY 22. The shareholder return policy has also been changed: whereas the basic policy had been to provide stable and continuous returns and link dividend payments to business performance with a target of 30% of profit attributable to owners of parent, during the Vision 2030 period (FY2026–FY2030) the company aims to maintain stable shareholder returns while continuing investments to enhance corporate value, with dividends generally targeting 3.5% of shareholders’ equity.
| Item | FY21 | FY22 | FY23 | FY24 | FY25 (planned) | FY26 (forecast) |
|---|---|---|---|---|---|---|
| Annual dividend per share (JPY) | 60 | 80 | 60 | 120 | 210 | 220 |
| Dividend payout ratio | 41.8% | 35.4% | 64.9% | 25.4% | 20.4% | 18.9% |
| DOE | - | - | - | - | 3.9% | 3.5% |
| Profit attributable to owners of parent (JPY billion) | 10.1 | 15.9 | 6.5 | 33.4 | 72.5 | 82.0 |
Medium-Term Plan
The company states that it achieved the financial targets in the 2025 Mid-term Plan, whose targets were announced on May 26, 2022. FY25 results exceeded every target, with ROIC (after tax) of 12.2% against a target of more than 6%, ROE of 19.1% against more than 11%, and net income attributable to owners of the parent of JPY 72.5 billion against more than JPY 37.0 billion.
| Metric | FY25 Results | Target (announced May 26, 2022) |
|---|---|---|
| ROIC (after tax) | 12.2% | More than 6% |
| ROE | 19.1% | More than 11% |
| Net D/E ratio | 0.6 | 0.8 or below |
| Capital ratio | 39.1% | More than 35% |
| Net sales | JPY 1.3 trillion | More than JPY 1.1 trillion |
| Operating profit | JPY 63.9 billion | More than JPY 58.0 billion |
| Net income attributable to owners of the parent | JPY 72.5 billion | More than JPY 37.0 billion |
FY26 CAPEX is forecast at JPY 150.0 billion, up JPY 93.3 billion from JPY 56.7 billion in FY25, with heat dissipation and cooling products at about JPY 45.0 billion, HVDC related at about JPY 16.0 billion and DFB laser related at about JPY 7.0 billion. R&D expenses are forecast at JPY 30.0 billion.
This article is an analysis based on publicly available information and is not a recommendation to buy or sell any specific securities. Investment decisions are your own responsibility.
![[Obayashi] Investors’ Guide 2026 — The Complete 24-Article Breakdown](https://japan-equity.com/wp-content/uploads/2026/07/hub_cover-1024x1024.png)
![[Obayashi] IR & SR Policy — Feeding Dialogue Back into Management](https://japan-equity.com/wp-content/uploads/2026/07/p32_sq-1024x1024.jpg)
![[Obayashi] Real Estate Development — 18.7% Margin, ¥287.7bn Unrealized Gains](https://japan-equity.com/wp-content/uploads/2026/07/p20_sq-1024x1024.jpg)
![[Obayashi] Domestic Civil Engineering — Resilience Spending Supports 9.6% Margin](https://japan-equity.com/wp-content/uploads/2026/07/p11_sq-1024x1024.jpg)
![[Obayashi] Share Price & External Ratings — vs TOPIX, ESG Index Inclusion](https://japan-equity.com/wp-content/uploads/2026/07/p40_sq-1024x1024.jpg)
![[Construction] ¥75.5tn Investment, Shrinking Workforce — Big-5 Market Share](https://japan-equity.com/wp-content/uploads/2026/07/p12_sq-1024x1024.jpg)



![[Obayashi] Capital Policy & Shareholder Returns — ROE 10%+, DOE ~5%, ¥100bn Buyback](https://japan-equity.com/wp-content/uploads/2026/07/p27_sq-1024x1024.jpg)
![[Obayashi] Reducing Cross-Shareholdings — ¥285.2bn Sold in Five Years](https://japan-equity.com/wp-content/uploads/2026/07/p29_sq-1024x1024.jpg)
![[Obayashi] ¥750bn Investment Plan — ¥300bn to Development, ¥190bn to Tech/DX](https://japan-equity.com/wp-content/uploads/2026/07/p30_sq-1024x1024.jpg)
![[Obayashi] MTP2022 KPIs — Operating Profit ~2x Target, ROE 14.4%](https://japan-equity.com/wp-content/uploads/2026/07/p25_sq-1024x1024.jpg)
![[Obayashi] Cash Allocation — ¥420bn Investment CF Over Five Years](https://japan-equity.com/wp-content/uploads/2026/07/p26_sq-1024x1024.jpg)
![[Obayashi] Green Energy — 44 Plants, 344MW, and the Green Hydrogen Challenge](https://japan-equity.com/wp-content/uploads/2026/07/p21_sq-1024x1024.jpg)
![[Obayashi] Tackling the Labor Shortage — Robotics Construction®](https://japan-equity.com/wp-content/uploads/2026/07/p14_sq-1024x1024.jpg)
