
This article is based on publicly available IR materials and is not a recommendation to buy or sell any specific securities.
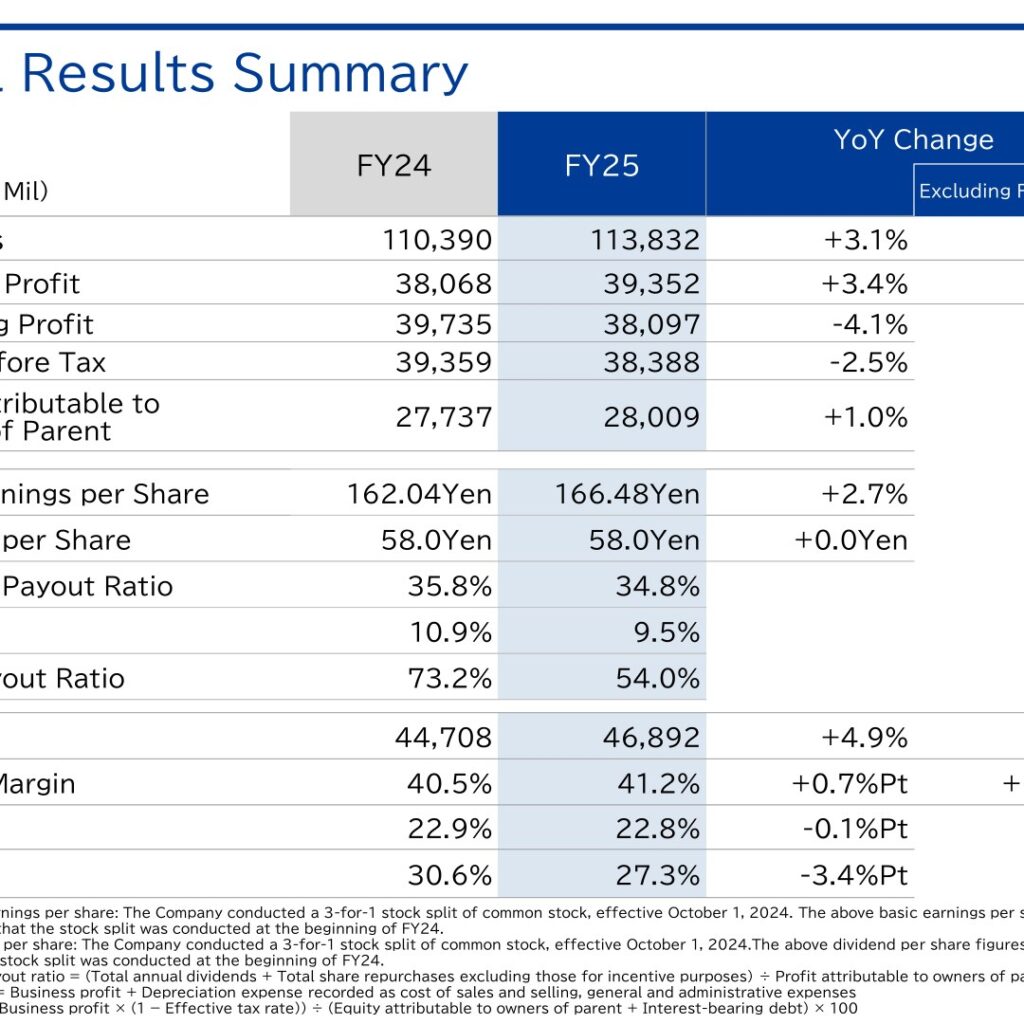
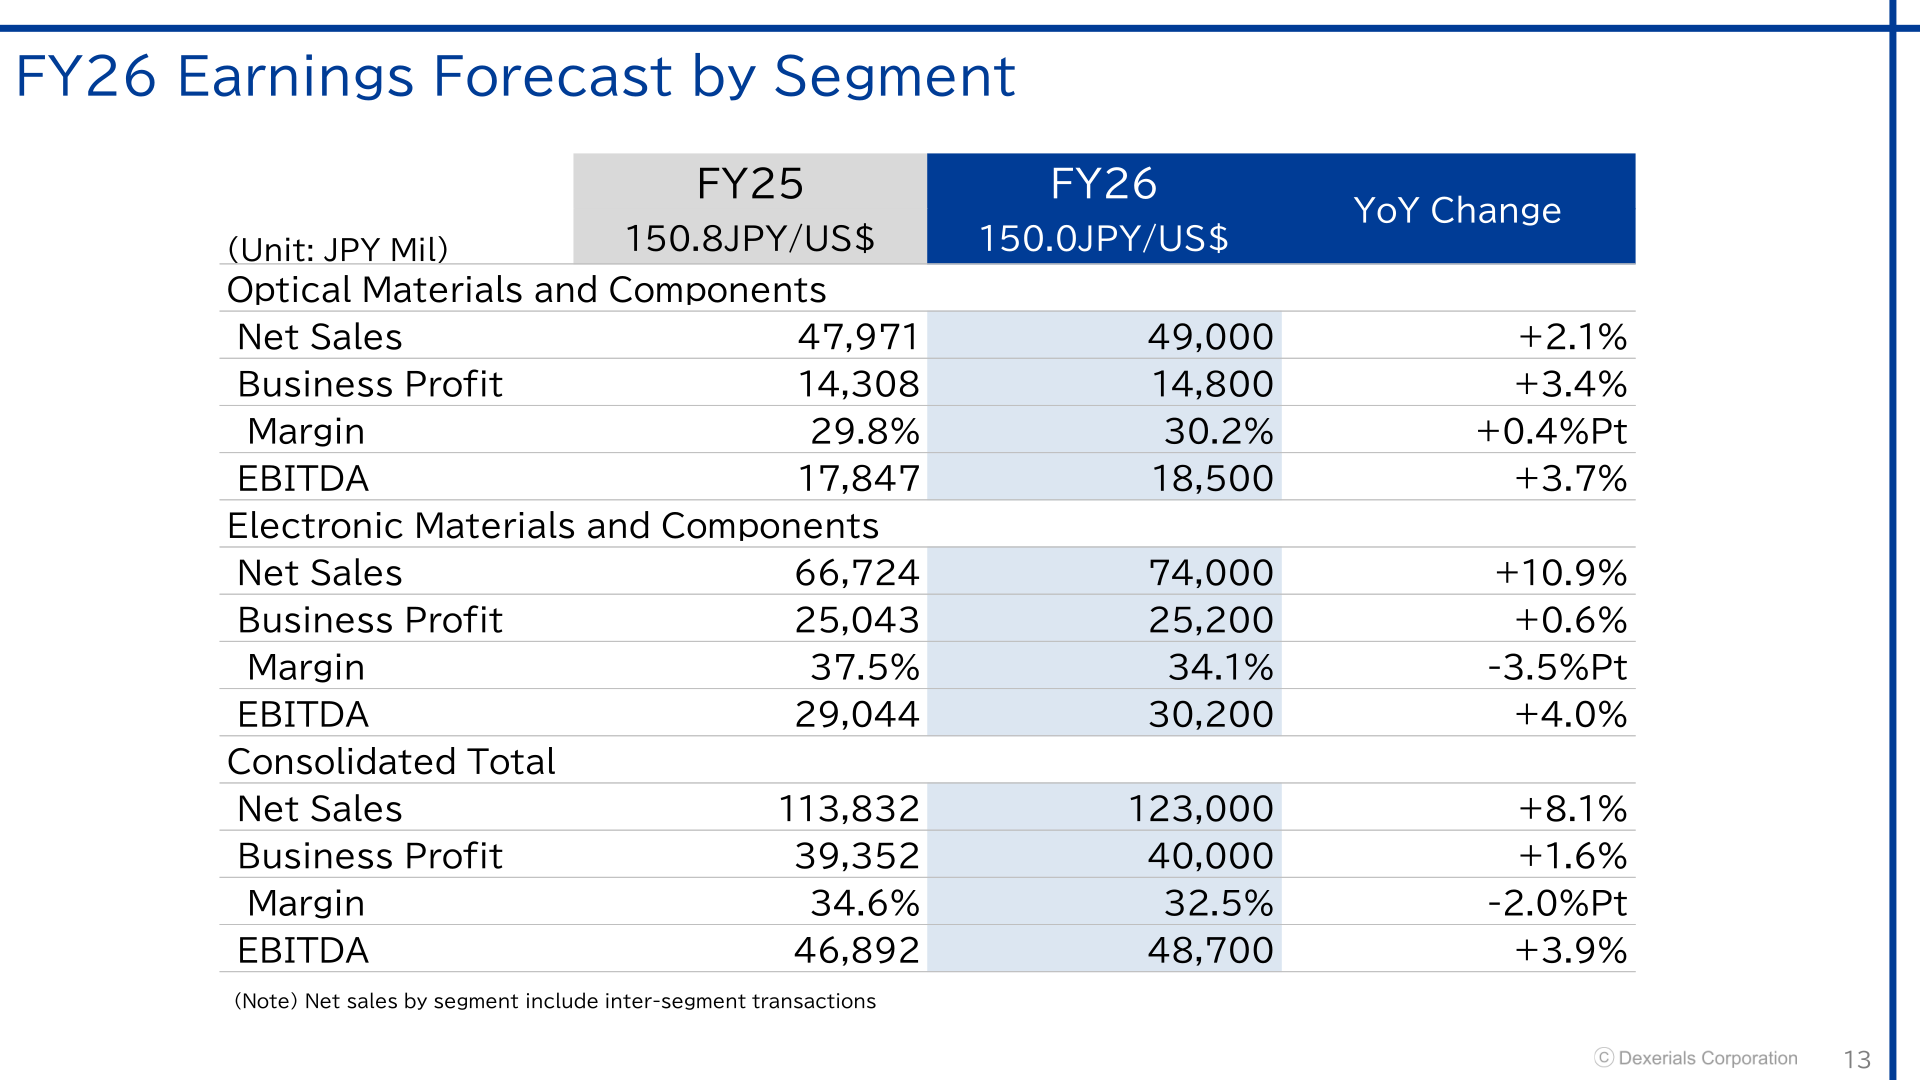
Dexerials Corporation released its FY25 financial results on May 13, 2026, covering the fiscal year from April 1, 2025 to March 31, 2026 (the company labels this year “FY25”). Net sales rose 3.1% year on year to 113,832 million yen and business profit rose 3.4% to 39,352 million yen, both increasing despite the loss of Phosphor film sales, which were terminated by the end of the first half of the previous fiscal year. Growth was driven by high-value-added products related to camera modules for high-end smartphones, such as Pre-cut Anisotropic Conductive Films (ACF), as well as optical semiconductors. Profit attributable to owners of parent increased 1.0% to 28,009 million yen, while operating profit declined 4.1% to 38,097 million yen. The FX rate for the year was 150.8 JPY/US$, against 152.6 JPY/US$ in FY24.
Consolidated Results (Full-Year Actual)
Excluding FX effects, net sales rose 4.3% and business profit rose 6.6%. EBITDA increased 4.9% to 46,892 million yen and the EBITDA margin improved 0.7 percentage points to 41.2%. ROIC was 22.8% and ROE was 27.3%. The annual dividend per share was unchanged at 58.0 yen, with a dividend payout ratio of 34.8%, DOE of 9.5% and a total payout ratio of 54.0%.
| Item | FY25 | FY24 | YoY Change |
|---|---|---|---|
| Net Sales (JPY Mil) | 113,832 | 110,390 | +3.1% |
| Business Profit (JPY Mil) | 39,352 | 38,068 | +3.4% |
| Operating Profit (JPY Mil) | 38,097 | 39,735 | -4.1% |
| Profit before Tax (JPY Mil) | 38,388 | 39,359 | -2.5% |
| Profit Attributable to Owners of Parent (JPY Mil) | 28,009 | 27,737 | +1.0% |
| Basic Earnings per Share | 166.48Yen | 162.04Yen | +2.7% |
| EBITDA (JPY Mil) | 46,892 | 44,708 | +4.9% |
| EBITDA Margin | 41.2% | 40.5% | +0.7%Pt |
| ROIC | 22.8% | 22.9% | -0.1%Pt |
| ROE | 27.3% | 30.6% | -3.4%Pt |
| Dividend per Share | 58.0Yen | 58.0Yen | +0.0Yen |
| Dividend Payout Ratio | 34.8% | 35.8% | |
| DOE | 9.5% | 10.9% | |
| Total Payout Ratio | 54.0% | 73.2% |
Segment Results
In Optical Materials and Components, net sales fell 5.3% to 47,971 million yen and business profit fell 1.7% to 14,308 million yen; excluding FX effects, net sales were down 4.4% while business profit rose 1.2%. By category, optical films declined 15% (-14% excluding FX effects) on the impact from the termination of Phosphor film sales by the end of the first half of FY24; Anti-reflection films (ARF) were down 0% (+0% excluding FX effects), as a decline in shipment volume of certain laptop PC models adopting the products was offset by an increase in the number of automotive models adopting them and the expansion of display sizes; and optical resin materials rose 3% (+4% excluding FX effects) on higher shipment volumes for models adopting Smart precision Adhesives.
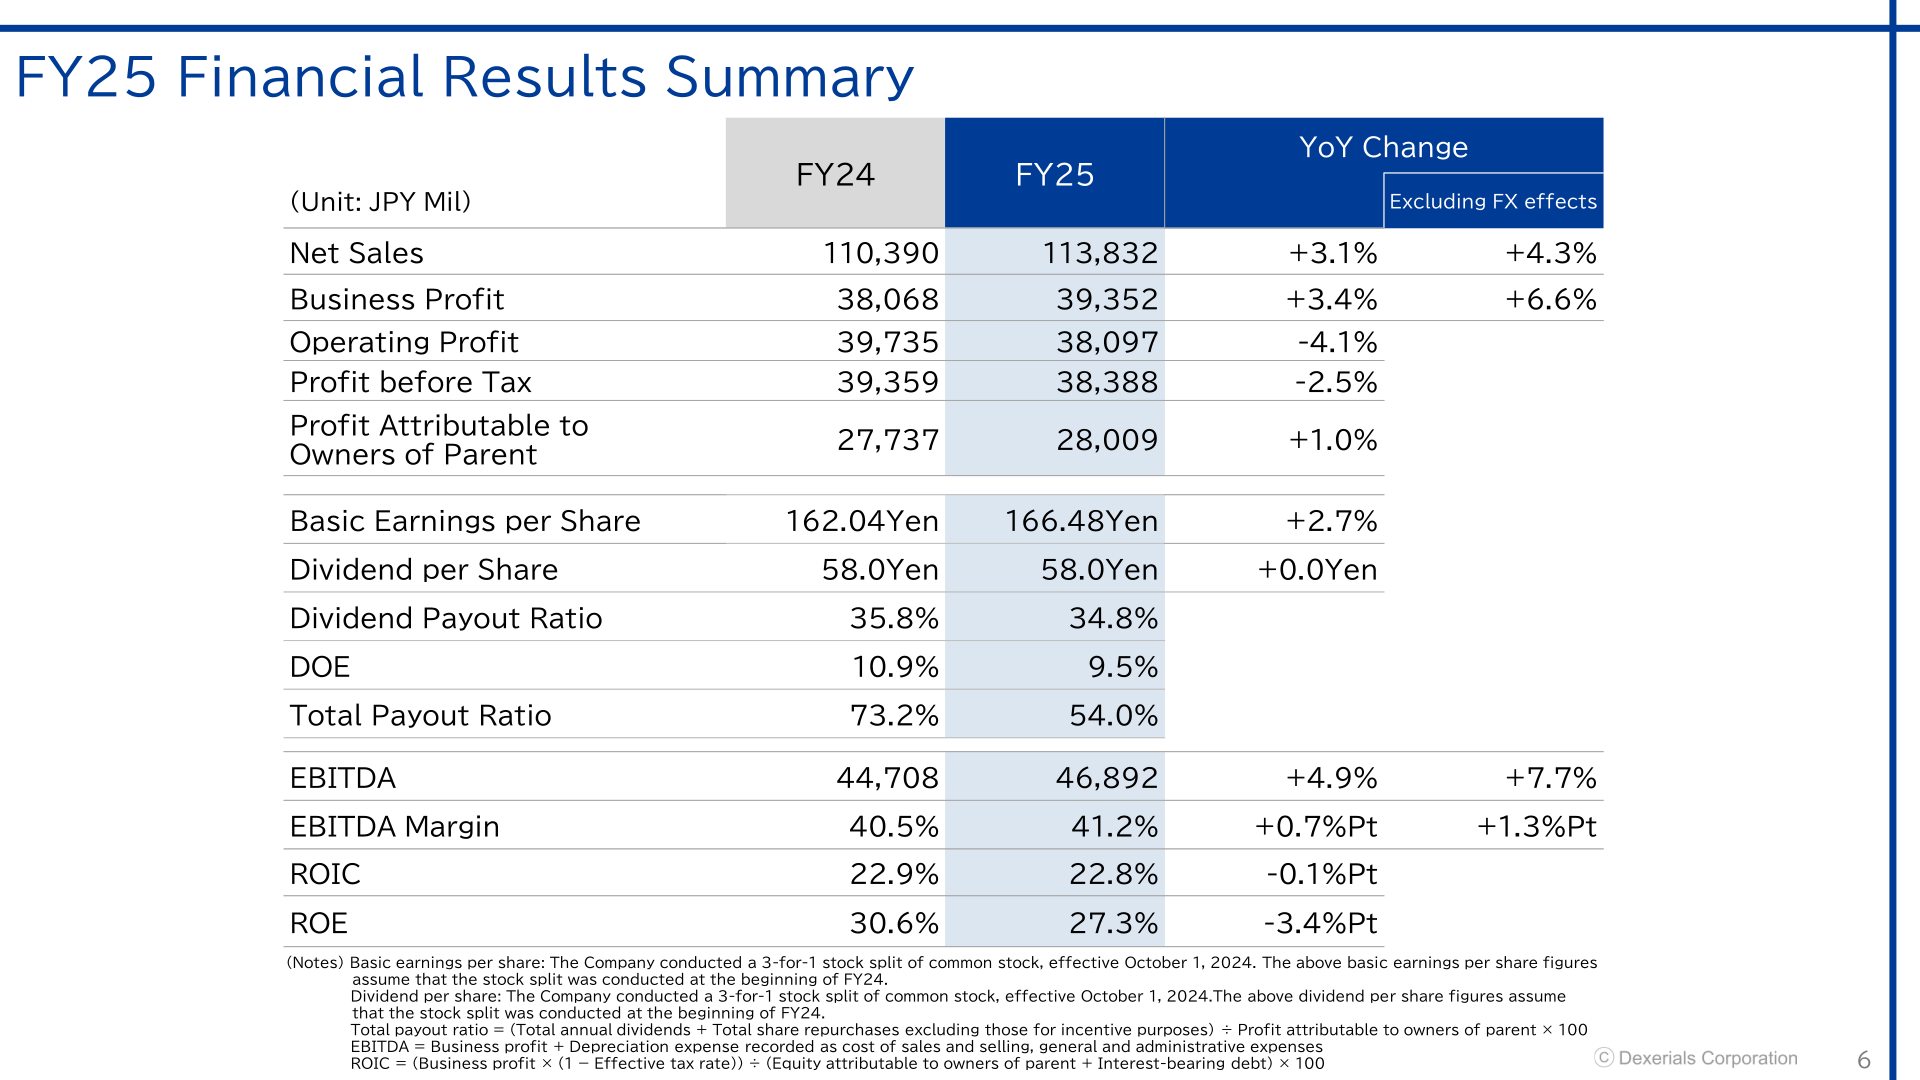
In Electronic Materials and Components, net sales grew 10.4% to 66,724 million yen and business profit grew 6.5% to 25,043 million yen (+11.8% and +10.0% respectively excluding FX effects). By category, secondary protection fuse sales rose 37% (+39% excluding FX effects) on a recovery in production following the completion of inventory adjustments by a major customer for power tool products, in addition to continued sales for battery backup units (BBU) used in data centers; Photonics rose 33% (+34% excluding FX effects) on higher shipping volumes for optical transceivers for data centers and for telecommunications equipment; adhesive materials rose 14% (+16% excluding FX effects); and Anisotropic Conductive Films (ACF) rose 3% (+4% excluding FX effects), driven by strong performance of Pre-cut ACF for camera modules. Net sales by segment include inter-segment transactions.
| Segment | Metric | FY25 | FY24 | YoY Change | Excluding FX effects |
|---|---|---|---|---|---|
| Optical Materials and Components | Net Sales (JPY Mil) | 47,971 | 50,647 | -5.3% | -4.4% |
| Optical Materials and Components | Business Profit (JPY Mil) | 14,308 | 14,556 | -1.7% | +1.2% |
| Optical Materials and Components | EBITDA (JPY Mil) | 17,847 | 18,006 | -0.9% | +1.5% |
| Electronic Materials and Components | Net Sales (JPY Mil) | 66,724 | 60,434 | +10.4% | +11.8% |
| Electronic Materials and Components | Business Profit (JPY Mil) | 25,043 | 23,511 | +6.5% | +10.0% |
| Electronic Materials and Components | EBITDA (JPY Mil) | 29,044 | 26,701 | +8.8% | +11.8% |
FY26 Earnings Forecast
For FY26 (April 1, 2026 to March 31, 2027), Dexerials forecasts net sales of 123,000 million yen (+8.1%) and business profit of 40,000 million yen (+1.6%), on an assumed FX rate of 150.0 JPY/US$. The company assumes a decline in smartphone unit volumes due to rising memory prices while high-end models are expected to expand, and states that the impact of cost increases resulting from the situation in the Middle East through the first half is expected to be limited. Although an increase in fixed costs is expected due to growth investments mainly for optical semiconductors, net sales and profit are expected to increase, driven by the expansion of high-value-added products and the significant growth in optical semiconductors. Profit attributable to owners of parent is forecast to decline 1.8% to 27,500 million yen.
| Item | FY26 Forecast | FY25 (Actual) | YoY Change |
|---|---|---|---|
| Net Sales (JPY Mil) | 123,000 | 113,832 | +8.1% |
| Business Profit (JPY Mil) | 40,000 | 39,352 | +1.6% |
| Operating Profit (JPY Mil) | 38,500 | 38,097 | +1.1% |
| Profit Before Tax (JPY Mil) | 38,500 | 38,388 | +0.3% |
| Profit Attributable to Owners of Parent (JPY Mil) | 27,500 | 28,009 | -1.8% |
| Basic Earnings Per Share | 163.45Yen | 166.48Yen | -1.8% |
| EBITDA (JPY Mil) | 48,700 | 46,892 | +3.9% |
| EBITDA Margin | 39.6% | 41.2% | -1.6%Pt |
| ROIC | 17.8% | 22.8% | -5.0%Pt |
| ROE | 23.7% | 27.3% | -3.6%Pt |
| Dividend Per Share | 64.0Yen | 58.0Yen | +6.0 Yen |
| Dividend Payout Ratio | 39.2% | 34.8% | |
| DOE | 9.2% | 9.5% | |
| FX Rate Assumption | 150.0JPY/US$ | 150.8JPY/US$ |
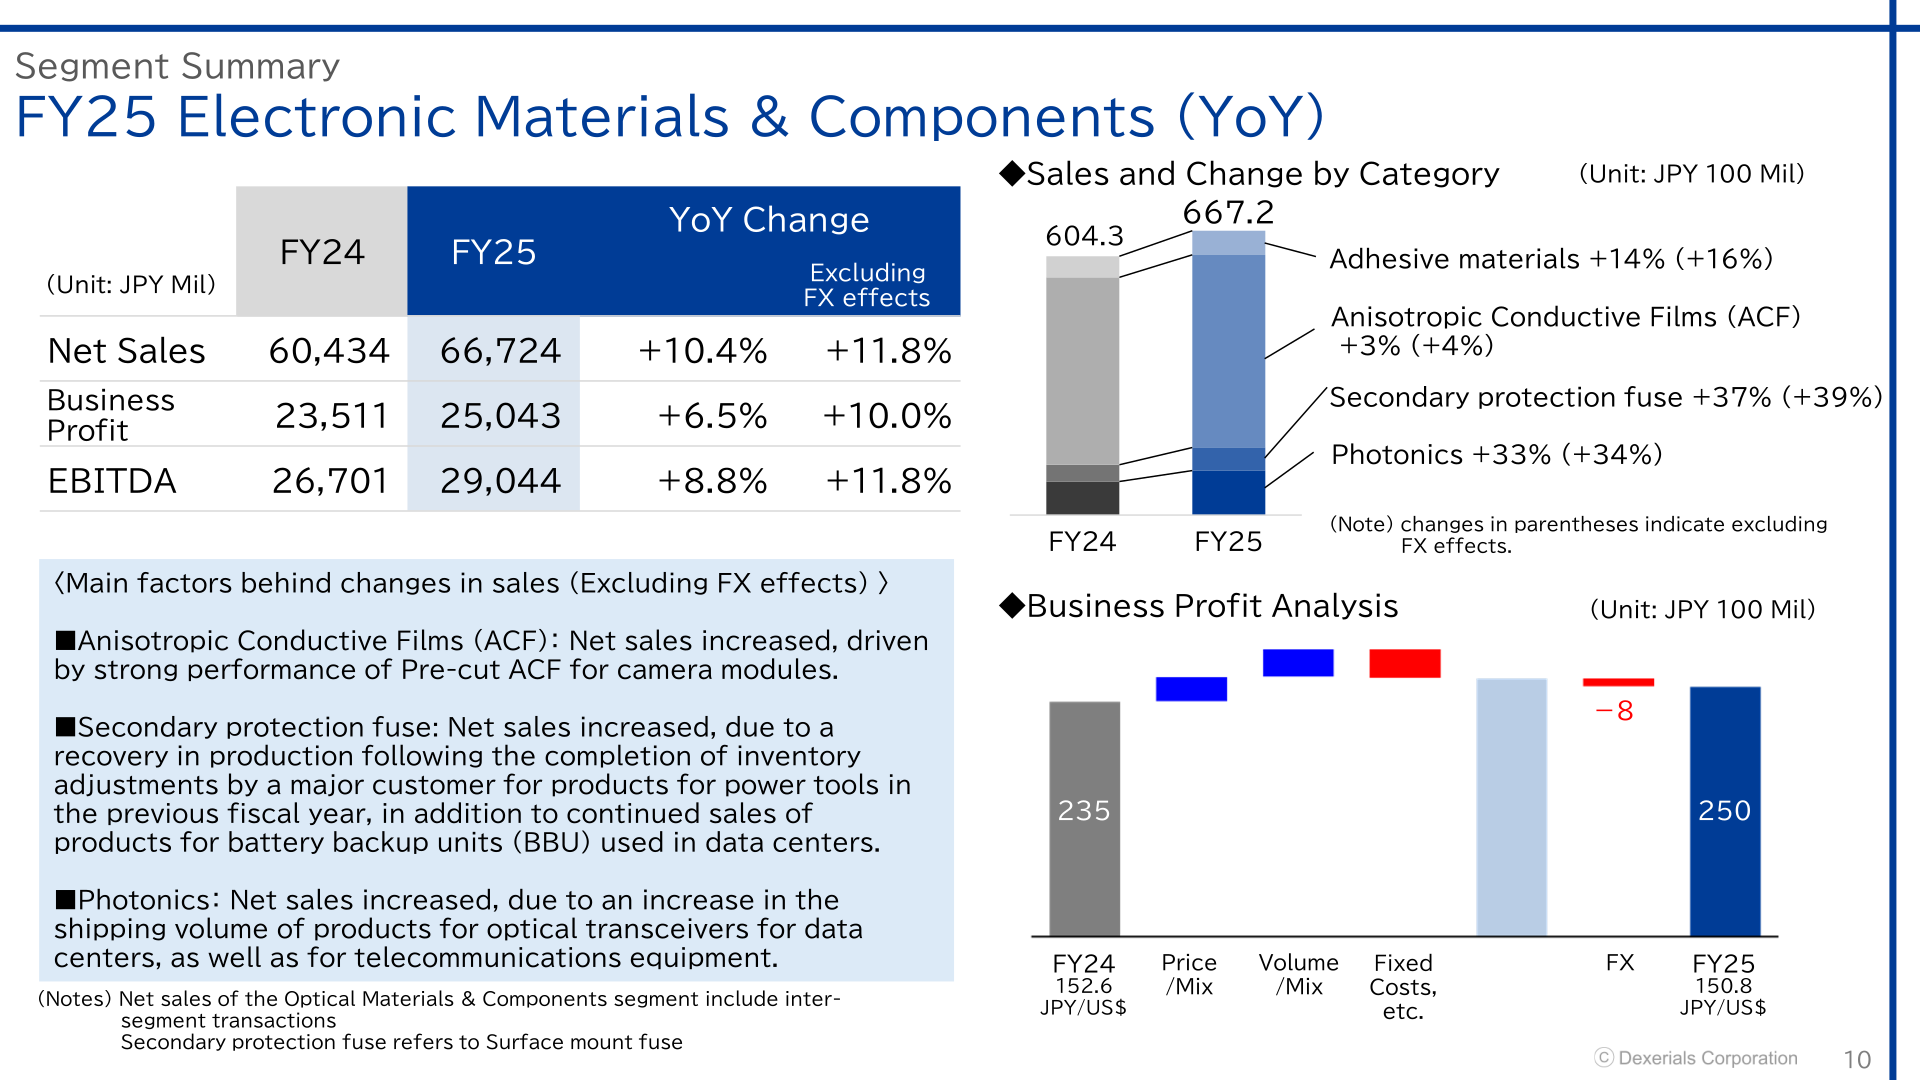
By segment, Optical Materials and Components is forecast at net sales of 49,000 million yen (+2.1%) and business profit of 14,800 million yen (+3.4%), for a margin of 30.2%. Electronic Materials and Components is forecast at net sales of 74,000 million yen (+10.9%) and business profit of 25,200 million yen (+0.6%), for a margin of 34.1%.
| Segment | Metric | FY26 Forecast | FY25 | YoY Change |
|---|---|---|---|---|
| Optical Materials and Components | Net Sales (JPY Mil) | 49,000 | 47,971 | +2.1% |
| Optical Materials and Components | Business Profit (JPY Mil) | 14,800 | 14,308 | +3.4% |
| Optical Materials and Components | Margin | 30.2% | 29.8% | +0.4%Pt |
| Optical Materials and Components | EBITDA (JPY Mil) | 18,500 | 17,847 | +3.7% |
| Electronic Materials and Components | Net Sales (JPY Mil) | 74,000 | 66,724 | +10.9% |
| Electronic Materials and Components | Business Profit (JPY Mil) | 25,200 | 25,043 | +0.6% |
| Electronic Materials and Components | Margin | 34.1% | 37.5% | -3.5%Pt |
| Electronic Materials and Components | EBITDA (JPY Mil) | 30,200 | 29,044 | +4.0% |
| Consolidated Total | Net Sales (JPY Mil) | 123,000 | 113,832 | +8.1% |
| Consolidated Total | Business Profit (JPY Mil) | 40,000 | 39,352 | +1.6% |
| Consolidated Total | Margin | 32.5% | 34.6% | -2.0%Pt |
| Consolidated Total | EBITDA (JPY Mil) | 48,700 | 46,892 | +3.9% |
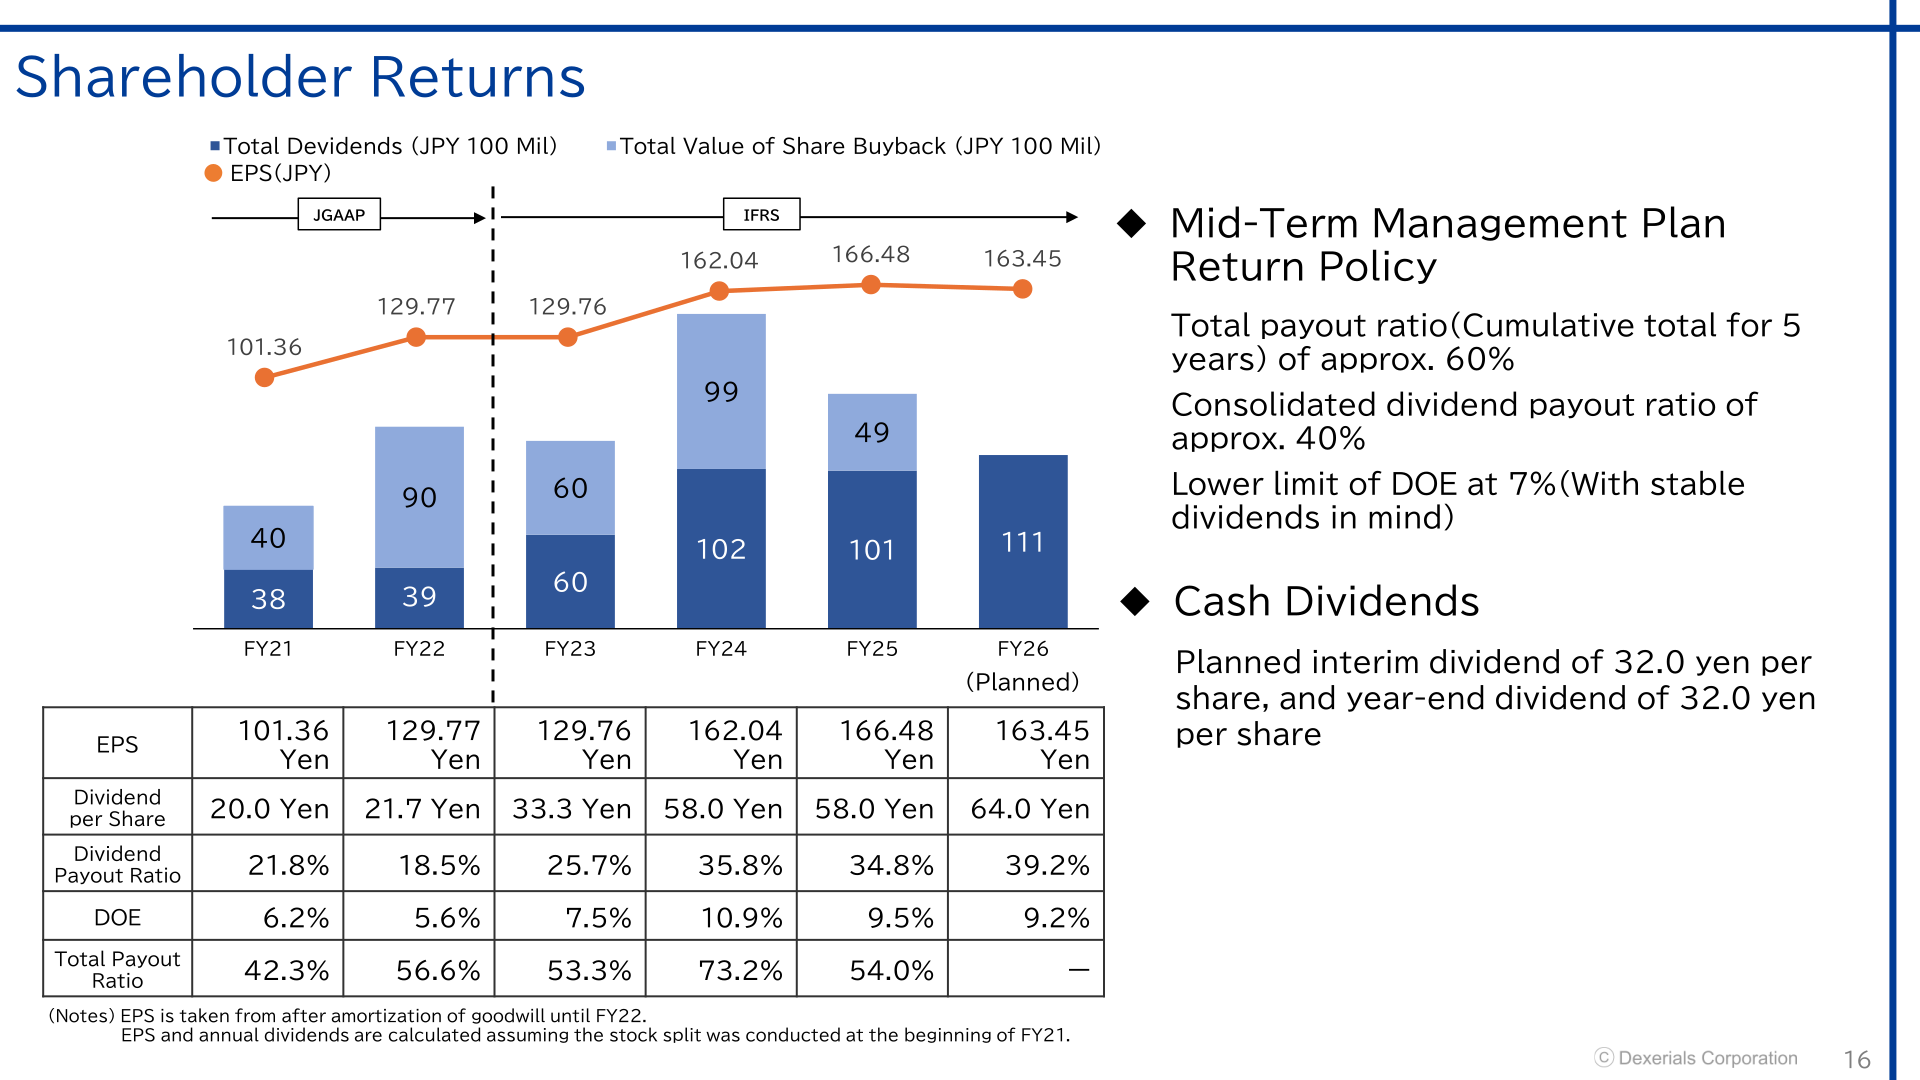
Shareholder Returns
The FY25 annual dividend per share was 58.0 yen, unchanged from FY24, with a dividend payout ratio of 34.8%, DOE of 9.5% and a total payout ratio of 54.0%. The total value of share buyback in FY25 was 4,999 million yen. A FY25 year-end dividend of 29.0 yen per share was included in the proposal for the appropriation of surplus at the 14th Annual General Meeting of Shareholders, to be held on June 23, 2026.
For FY26 the company plans an interim dividend of 32.0 yen per share and a year-end dividend of 32.0 yen per share, for an annual total of 64 yen per share, implying a dividend payout ratio of 39.2% and DOE of 9.2%. The Mid-Term Management Plan return policy calls for a total payout ratio of approximately 60% (cumulative total for 5 years), a consolidated dividend payout ratio of approximately 40%, and a lower limit of DOE at 7% (with stable dividends in mind).
Financial Position and Cash Flows
Total assets grew 13,282 million yen to 165,104 million yen as of March 31, 2026, with property, plant and equipment up 27,154 million yen to 76,858 million yen. Cash and cash equivalents declined 18,324 million yen to 16,655 million yen and interest-bearing debt fell 4,571 million yen to 16,506 million yen. Total equity rose 13,448 million yen to 109,363 million yen, and the ratio of equity attributable to owners of parent to total assets improved to 66.2%. Operating cash flow was 27,544 million yen against investing cash flow of -25,061 million yen, leaving free cash flow of 2,482 million yen; financing cash flow was -21,443 million yen. Capital expenditure was 16,774 million yen in FY25, with an FY26 forecast of 63,600 million yen.
Topics
Dexerials states that its mainstay products hold Global No.1 share in their niche markets: Anisotropic Conductive Films (ACF) at 74.0%, Anti-reflection films (ARF) produced utilizing sputtering technology at 92.8%, and Optical elastic resins (SVR) at 54.7% (2024 shares for value amount according to the “Reality and Future Prospect of Display Related Market 2025” issued by Fuji Chimera Research Institute, inc.). Sales of these three mainstay products accounted for approximately 63.8% of total net sales in FY25. The company is executing Mid-Term Management Plan 2028, “Achieving Evolution”. Its share price was JPY 2,114 as of Mar. 31, 2026, for a market capitalization of JPY 369.4 Bil.
This article is an analysis based on publicly available information and is not a recommendation to buy or sell any specific securities. Investment decisions are your own responsibility.
![[Obayashi] Investors’ Guide 2026 — The Complete 24-Article Breakdown](https://japan-equity.com/wp-content/uploads/2026/07/hub_cover-1024x1024.png)
![[Obayashi] IR & SR Policy — Feeding Dialogue Back into Management](https://japan-equity.com/wp-content/uploads/2026/07/p32_sq-1024x1024.jpg)
![[Obayashi] Domestic Civil Engineering — Resilience Spending Supports 9.6% Margin](https://japan-equity.com/wp-content/uploads/2026/07/p11_sq-1024x1024.jpg)
![[Obayashi] Overseas Construction — Orders Reach ¥1.2tn](https://japan-equity.com/wp-content/uploads/2026/07/p15_sq-1024x1024.jpg)
![[Obayashi] Share Price & External Ratings — vs TOPIX, ESG Index Inclusion](https://japan-equity.com/wp-content/uploads/2026/07/p40_sq-1024x1024.jpg)
![[Construction] ¥75.5tn Investment, Shrinking Workforce — Big-5 Market Share](https://japan-equity.com/wp-content/uploads/2026/07/p12_sq-1024x1024.jpg)



![[Obayashi] Capital Policy & Shareholder Returns — ROE 10%+, DOE ~5%, ¥100bn Buyback](https://japan-equity.com/wp-content/uploads/2026/07/p27_sq-1024x1024.jpg)
![[Obayashi] Reducing Cross-Shareholdings — ¥285.2bn Sold in Five Years](https://japan-equity.com/wp-content/uploads/2026/07/p29_sq-1024x1024.jpg)
![[Obayashi] ¥750bn Investment Plan — ¥300bn to Development, ¥190bn to Tech/DX](https://japan-equity.com/wp-content/uploads/2026/07/p30_sq-1024x1024.jpg)
![[Obayashi] MTP2022 KPIs — Operating Profit ~2x Target, ROE 14.4%](https://japan-equity.com/wp-content/uploads/2026/07/p25_sq-1024x1024.jpg)
![[Obayashi] Cash Allocation — ¥420bn Investment CF Over Five Years](https://japan-equity.com/wp-content/uploads/2026/07/p26_sq-1024x1024.jpg)
![[Obayashi] Green Energy — 44 Plants, 344MW, and the Green Hydrogen Challenge](https://japan-equity.com/wp-content/uploads/2026/07/p21_sq-1024x1024.jpg)
![[Obayashi] Tackling the Labor Shortage — Robotics Construction®](https://japan-equity.com/wp-content/uploads/2026/07/p14_sq-1024x1024.jpg)
