
This article is based on publicly available IR materials and is not a recommendation to buy or sell any specific securities.
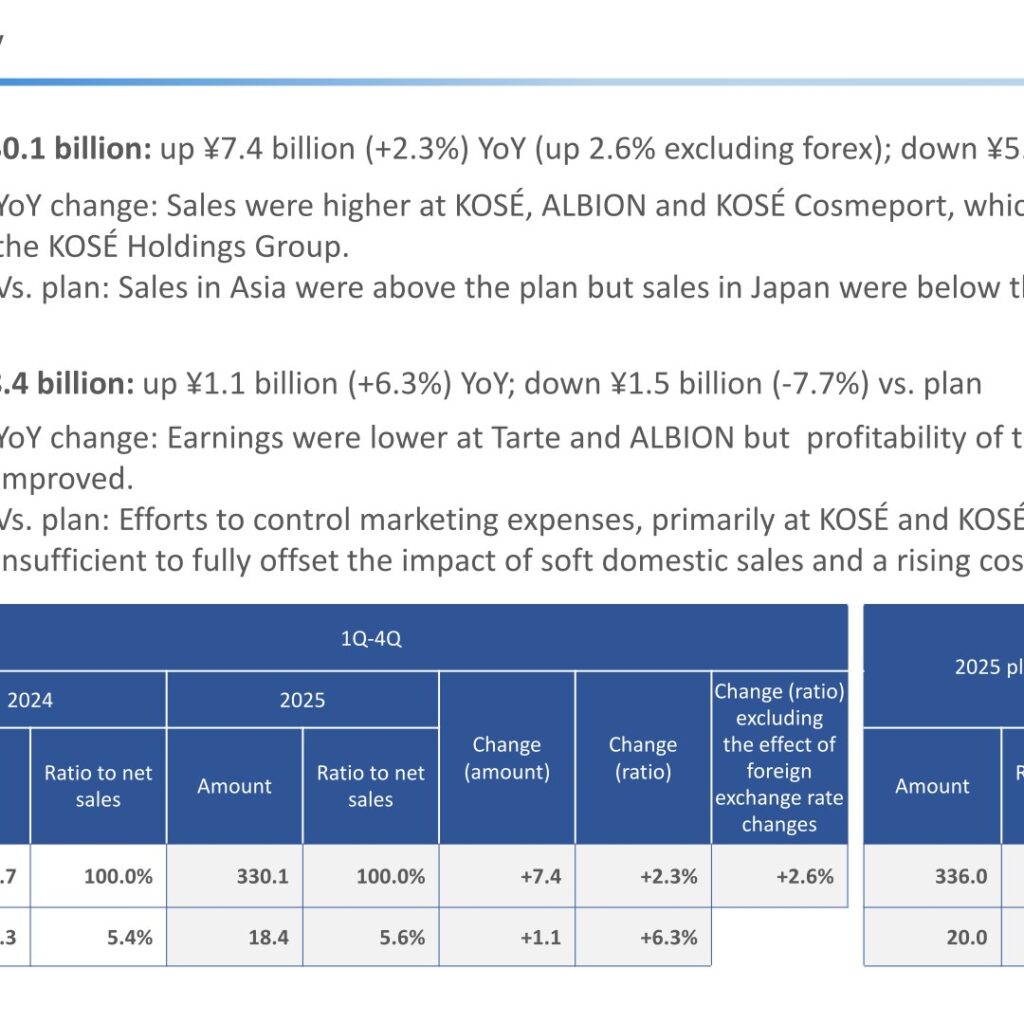
KOSÉ Holdings Corporation closed the fiscal year ended December 31, 2025 with net sales of ¥330.1 billion, up ¥7.4 billion or 2.3% year on year (up 2.6% excluding foreign exchange effects), and operating profit of ¥18.4 billion, up ¥1.1 billion or 6.3%. Both figures came in below the company’s 2025 plan of ¥336.0 billion and ¥20.0 billion. Profit attributable to owners of parent doubled to ¥15.1 billion (+101.2%), which the company attributes to a decline in income taxes and to the impact of the loss related to China structural reforms recorded in 2024. Sales were higher at KOSÉ, ALBION and KOSÉ Cosmeport, the core businesses of the KOSÉ Holdings Group.
Consolidated Results (Full-Year Actual)
Gross profit rose ¥5.4 billion (+2.4%) to ¥227.9 billion, with the gross margin unchanged at 69.0% of net sales. The operating margin improved from 5.4% to 5.6%. Ordinary profit was mostly unchanged year on year at ¥21.4 billion (-0.8%) because a smaller foreign exchange gain offset the higher operating profit. ROE improved from 2.8% to 5.4% and ROIC from 2.6% to 3.7%. Capital expenditures were ¥21.2 billion against ¥21.4 billion a year earlier, while depreciation rose to ¥10.8 billion from ¥9.7 billion.
| Item (billion yen) | 2024 | Ratio to net sales | 2025 | Ratio to net sales | Change (amount) | Change (ratio) |
|---|---|---|---|---|---|---|
| Net sales | 322.7 | 100.0% | 330.1 | 100.0% | +7.4 | +2.3% |
| Gross profit | 222.5 | 69.0% | 227.9 | 69.0% | +5.4 | +2.4% |
| Operating profit | 17.3 | 5.4% | 18.4 | 5.6% | +1.1 | +6.3% |
| Ordinary profit | 21.6 | 6.7% | 21.4 | 6.5% | -0.1 | -0.8% |
| Profit attributable to owners of parent | 7.5 | 2.3% | 15.1 | 4.6% | +7.6 | +101.2% |
| Net income per share | 131.62 yen | – | 264.84 yen | – | +133.22 yen | – |
| ROE | 2.8% | – | 5.4% | – | – | – |
| ROIC | 2.6% | – | 3.7% | – | – | – |
Against the 2025 plan, net sales were ¥5.8 billion (-1.7%) lower and operating profit ¥1.5 billion (-7.7%) lower. Ordinary profit of ¥21.4 billion exceeded the ¥20.7 billion plan by ¥0.7 billion (+3.7%), and profit attributable to owners of parent beat the ¥13.8 billion plan by ¥1.3 billion (+9.5%).
Sales by Region
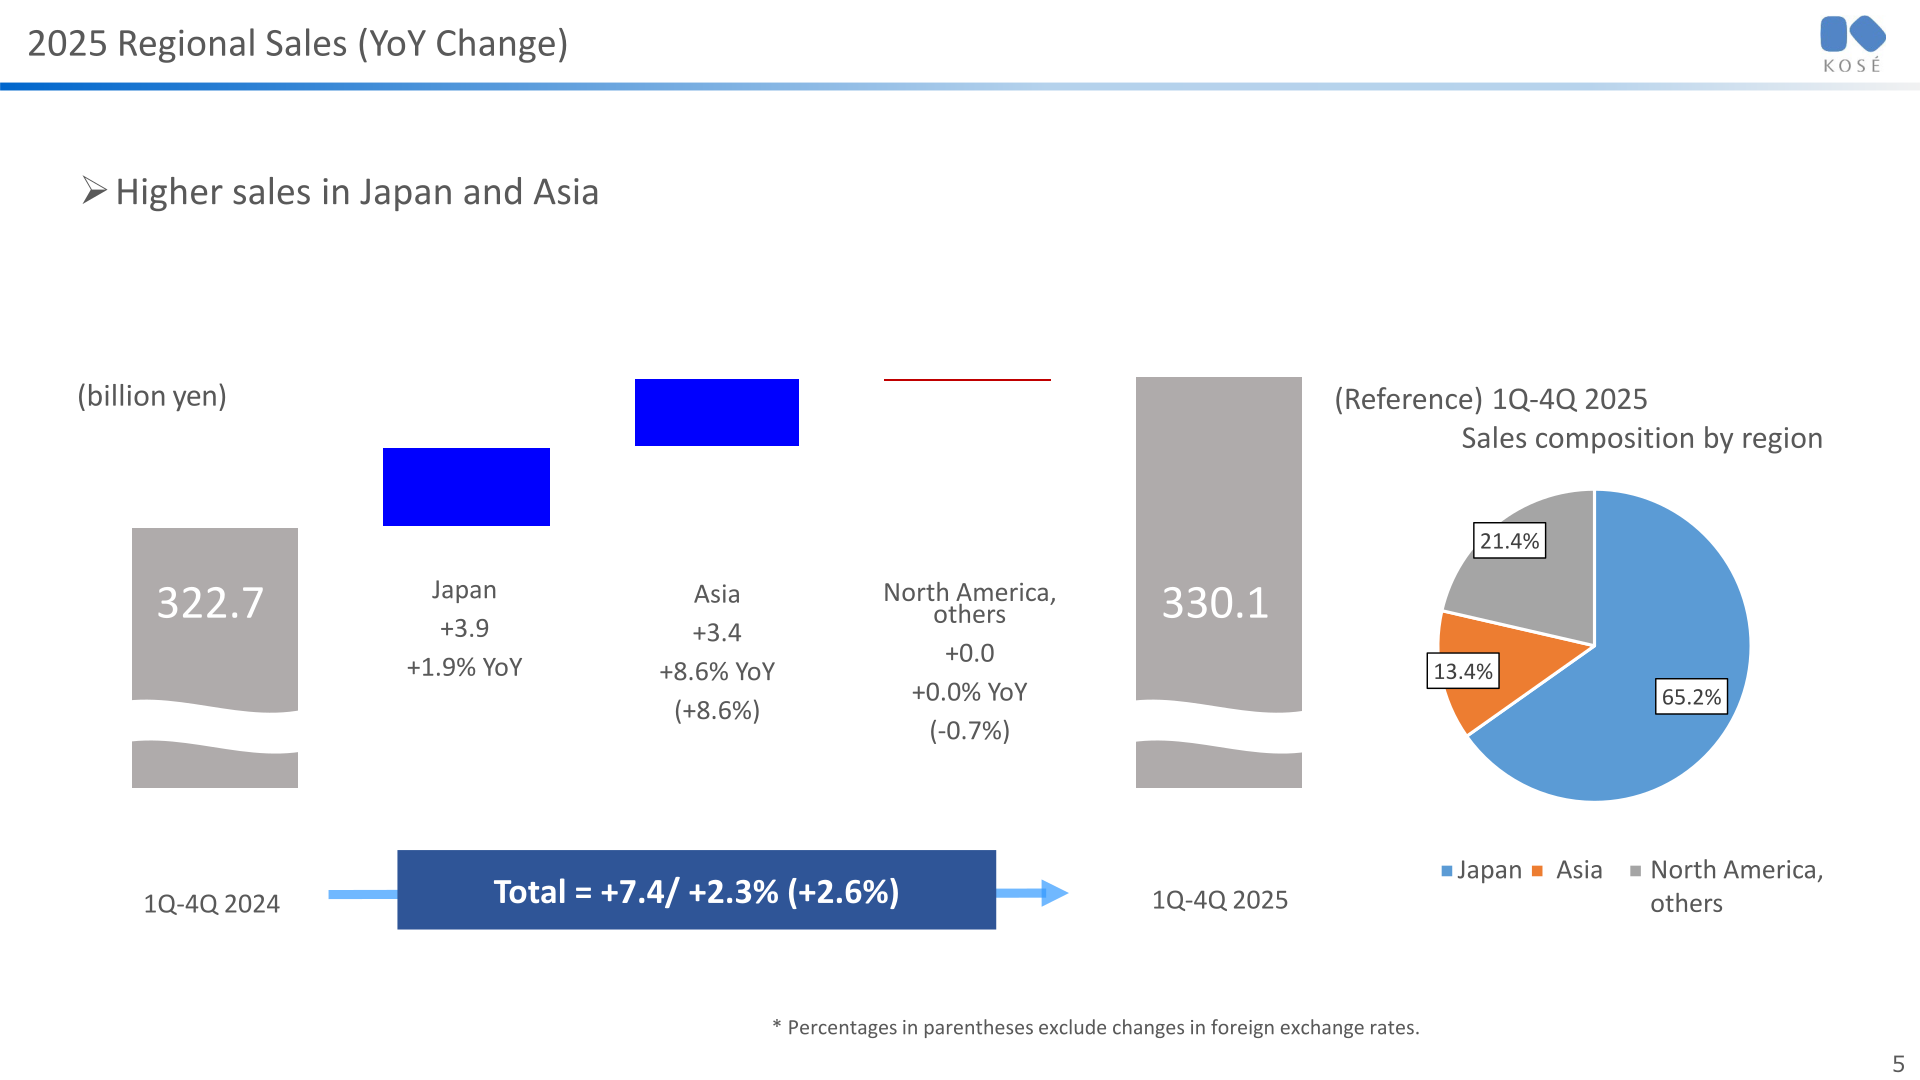
Japan sales rose ¥3.9 billion (+1.9%) to ¥215.3 billion, Asia rose ¥3.4 billion (+8.6%) to ¥44.1 billion, and North America and other regions were flat at ¥70.7 billion (+0.0%, or -0.7% excluding foreign exchange effects). The 2025 sales composition by region was Japan 65.2%, Asia 13.4%, and North America and others 21.4%. Asia growth was supported by mainland China and the contribution of newly consolidated PURI CO., LTD., which more than offset lower duty-free channel sales caused by voluntary shipment controls. Versus the plan, Japan was ¥8.0 billion (-3.6%) short, Asia was ¥3.0 billion (+7.6%) ahead, and North America and others were ¥0.8 billion (-1.2%) short.
Segment Results
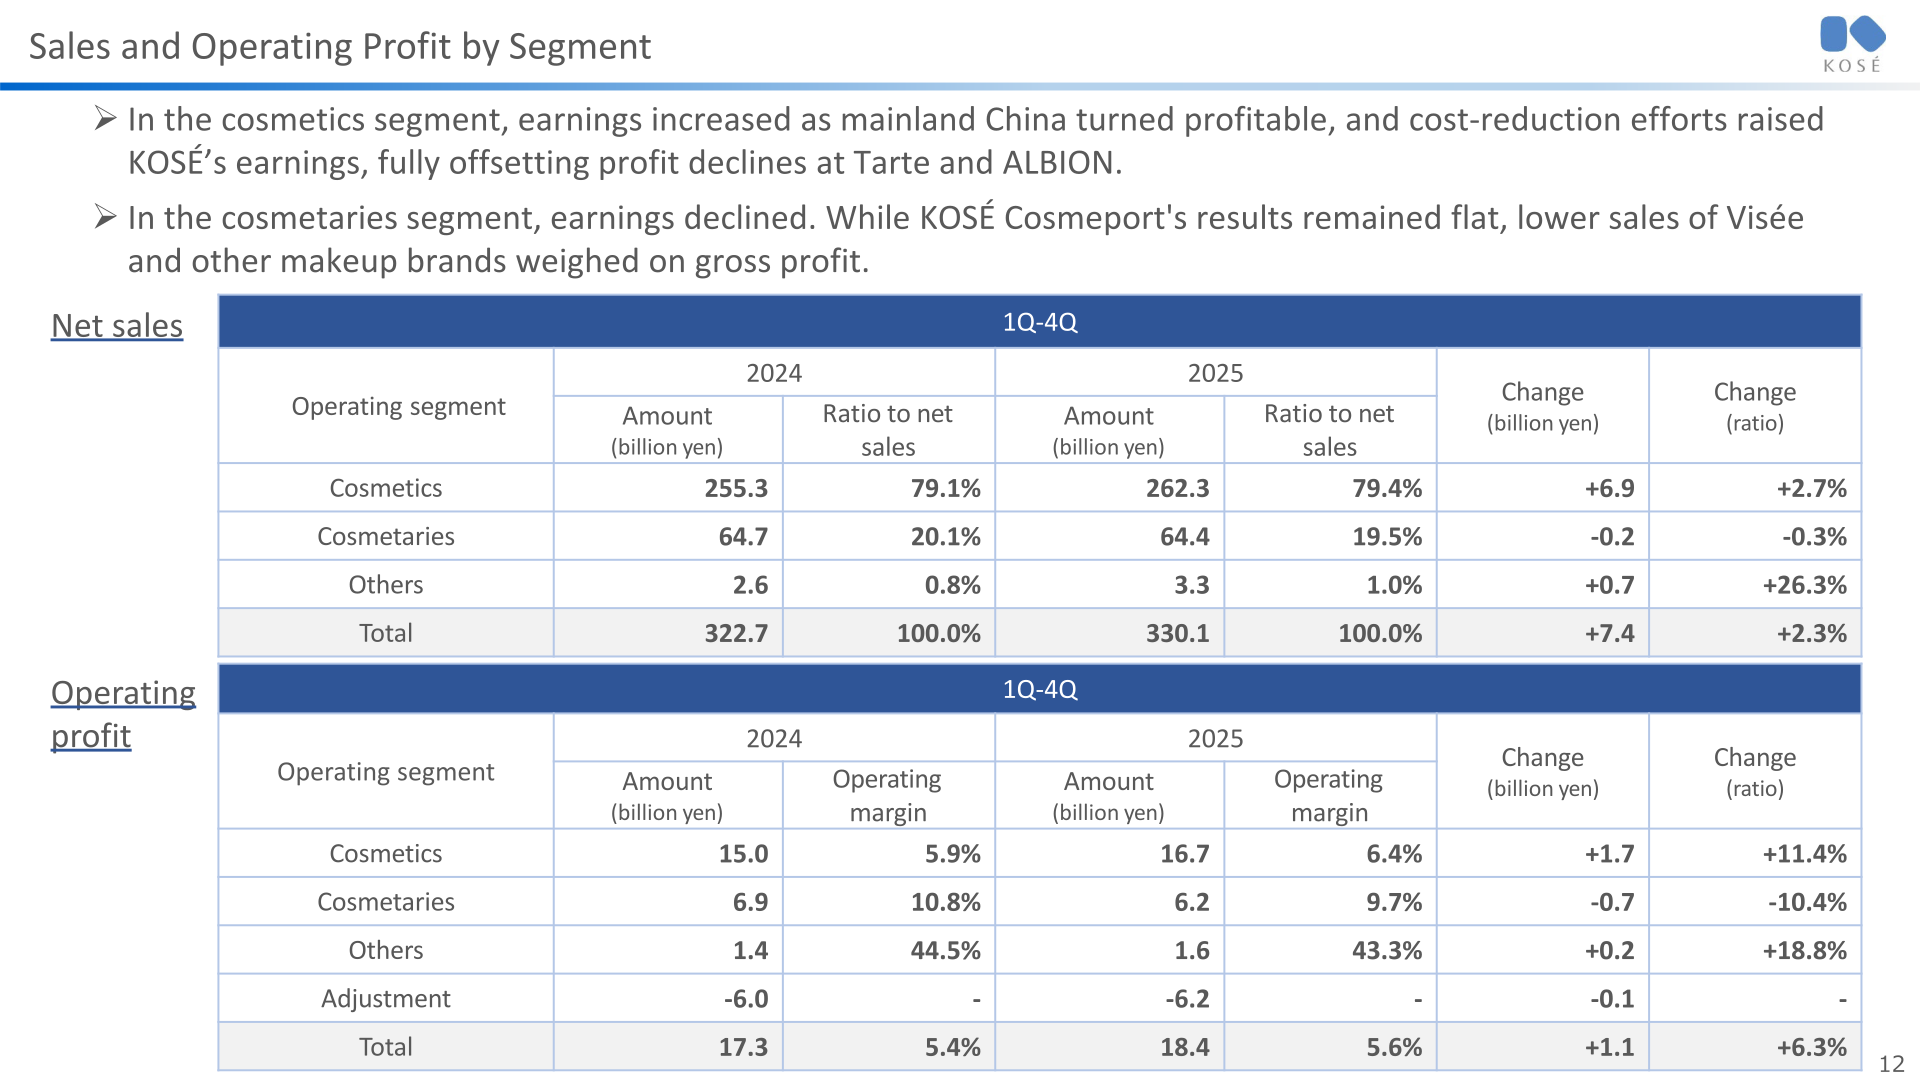
In the cosmetics segment, sales rose 2.7% to ¥262.3 billion and operating profit rose 11.4% to ¥16.7 billion, as mainland China turned profitable and cost-reduction efforts raised KOSÉ’s earnings, fully offsetting profit declines at Tarte and ALBION. In the cosmetaries segment, sales edged down 0.3% to ¥64.4 billion and operating profit fell 10.4% to ¥6.2 billion; KOSÉ Cosmeport’s results remained flat while lower sales of Visée and other makeup brands weighed on gross profit.
| Segment | Metric | 2024 | 2025 | Change (amount) | Change (ratio) |
|---|---|---|---|---|---|
| Cosmetics | Net sales | 255.3 | 262.3 | +6.9 | +2.7% |
| Cosmetaries | Net sales | 64.7 | 64.4 | -0.2 | -0.3% |
| Others | Net sales | 2.6 | 3.3 | +0.7 | +26.3% |
| Total | Net sales | 322.7 | 330.1 | +7.4 | +2.3% |
| Cosmetics | Operating profit (margin) | 15.0 (5.9%) | 16.7 (6.4%) | +1.7 | +11.4% |
| Cosmetaries | Operating profit (margin) | 6.9 (10.8%) | 6.2 (9.7%) | -0.7 | -10.4% |
| Others | Operating profit (margin) | 1.4 (44.5%) | 1.6 (43.3%) | +0.2 | +18.8% |
| Adjustment | Operating profit | -6.0 | -6.2 | -0.1 | – |
| Total | Operating profit (margin) | 17.3 (5.4%) | 18.4 (5.6%) | +1.1 | +6.3% |
Major Group Companies and Brands
ALBION total sales grew 2.1% to ¥61.4 billion but operating profit fell 24.8% to ¥5.4 billion, cutting the operating margin from 12.0% to 8.8%. KOSÉ Cosmeport posted record-high sales of ¥41.0 billion (+3.1%) with operating profit of ¥4.6 billion (+0.9%) and an operating margin of 11.3%. Tarte sales declined 1.5% to ¥69.1 billion, with operating profit down 29.5% to ¥5.4 billion; the company notes Tarte sales were flat year on year on a local currency basis (-0.3%) and that Tarte operating profit is stated before goodwill amortization. Among major brands, DECORTÉ sales in Japan reached a record high of ¥46.3 billion (+7.7%) while Asia and other regions were ¥27.7 billion (-0.6%), and SEKKISEI total sales rose 2.4% to ¥16.9 billion.
| Group company / brand | Metric | 2024 | 2025 | Change (ratio) |
|---|---|---|---|---|
| ALBION | Total sales | 60.1 | 61.4 | +2.1% |
| ALBION | Operating profit (margin) | 7.2 (12.0%) | 5.4 (8.8%) | -24.8% |
| KOSÉ Cosmeport | Total sales | 39.7 | 41.0 | +3.1% |
| KOSÉ Cosmeport | Operating profit (margin) | 4.5 (11.5%) | 4.6 (11.3%) | +0.9% |
| Tarte | Total sales | 70.2 | 69.1 | -1.5% |
| Tarte | Operating profit (margin) | 7.7 (11.0%) | 5.4 (7.9%) | -29.5% |
| DECORTÉ | Sales in Japan | 43.0 | 46.3 | +7.7% |
| DECORTÉ | Sales in Asia/others | 27.9 | 27.7 | -0.6% |
| SEKKISEI | Total sales | 16.5 | 16.9 | +2.4% |
2026 Consolidated Outlook
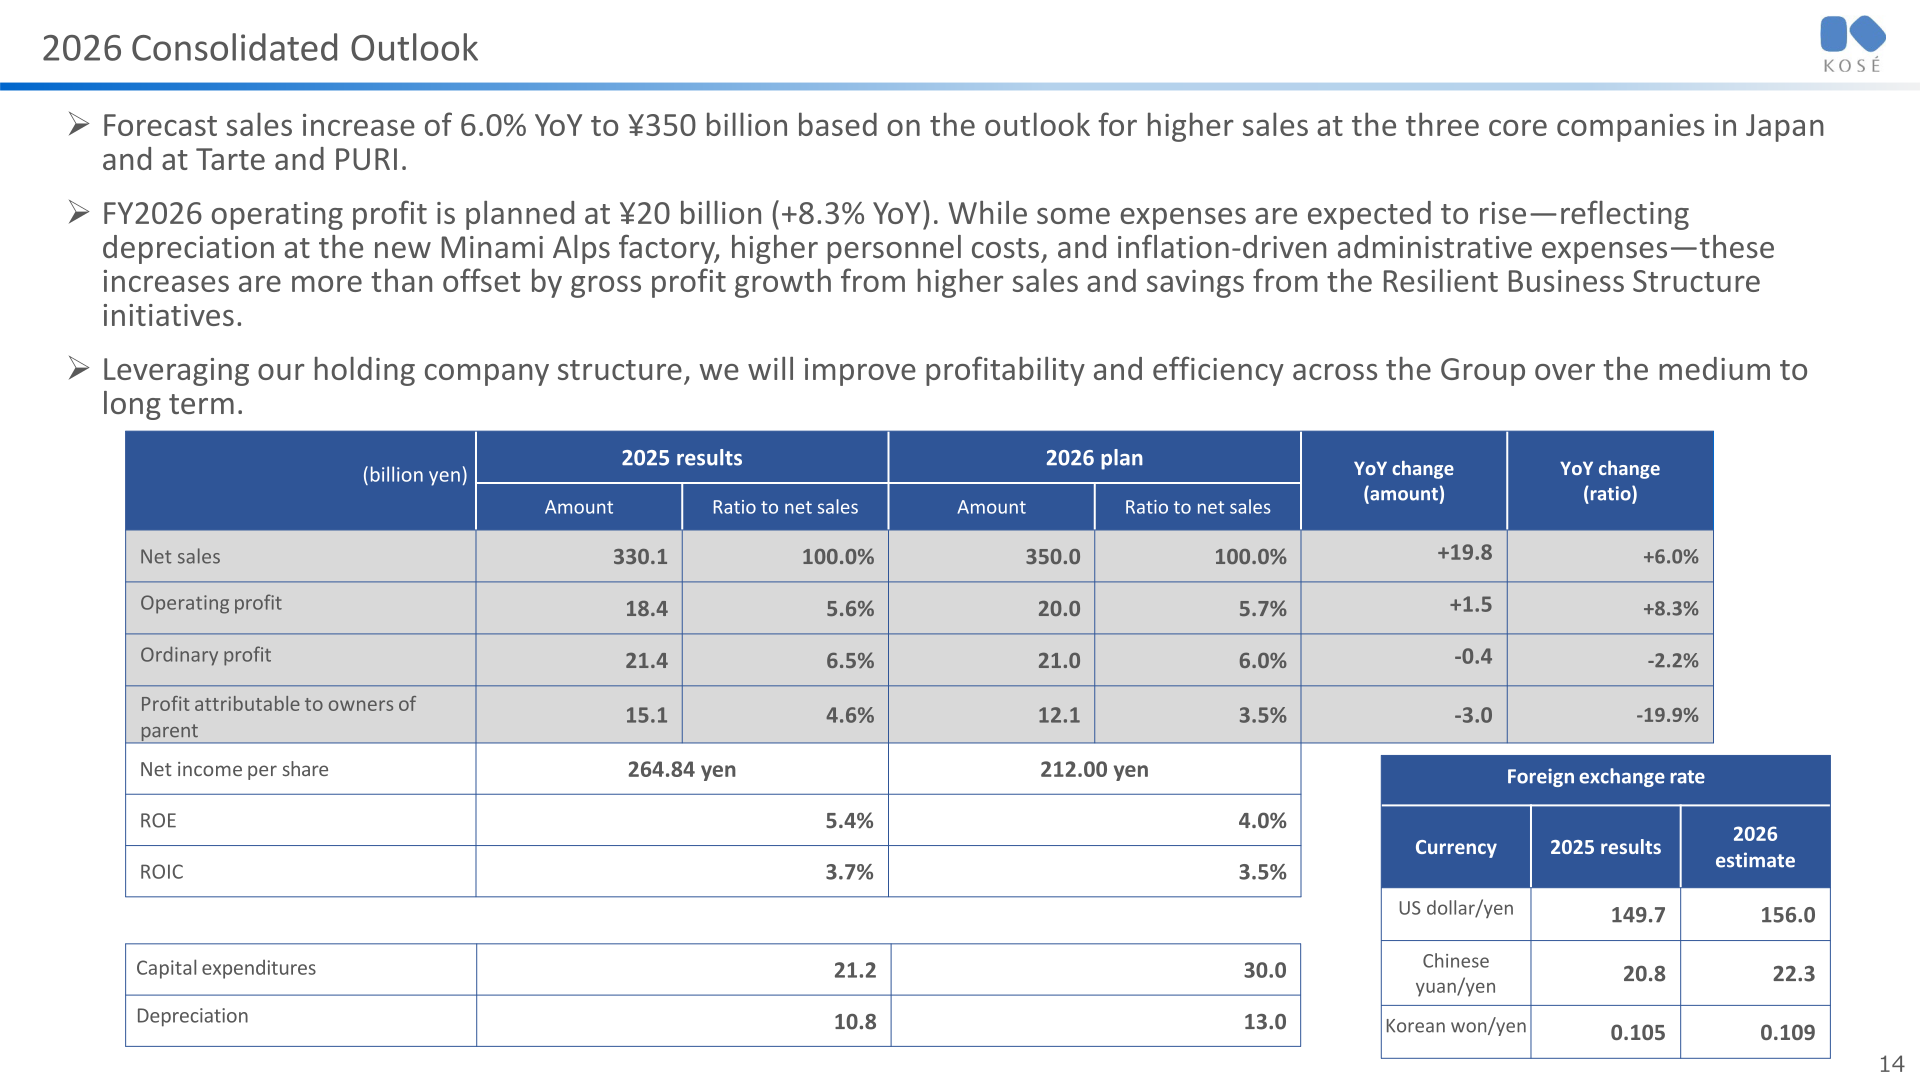
For the fiscal year ending December 31, 2026, KOSÉ Holdings forecasts net sales of ¥350.0 billion, up ¥19.8 billion (+6.0%), based on the outlook for higher sales at the three core companies in Japan and at Tarte and PURI. Operating profit is planned at ¥20.0 billion (+8.3%); the company expects depreciation at the new Minami Alps factory, higher personnel costs and inflation-driven administrative expenses to be more than offset by gross profit growth from higher sales and savings from the Resilient Business Structure initiatives. Ordinary profit is planned at ¥21.0 billion (-2.2%) and profit attributable to owners of parent at ¥12.1 billion (-19.9%). Assumed exchange rates are ¥156.0 to the US dollar, ¥22.3 to the Chinese yuan and ¥0.109 to the Korean won, against 2025 results of ¥149.7, ¥20.8 and ¥0.105.
| Item (billion yen) | 2025 results | 2026 plan | YoY change (amount) | YoY change (ratio) |
|---|---|---|---|---|
| Net sales | 330.1 | 350.0 | +19.8 | +6.0% |
| Operating profit | 18.4 | 20.0 | +1.5 | +8.3% |
| Ordinary profit | 21.4 | 21.0 | -0.4 | -2.2% |
| Profit attributable to owners of parent | 15.1 | 12.1 | -3.0 | -19.9% |
| Net income per share | 264.84 yen | 212.00 yen | – | – |
| ROE | 5.4% | 4.0% | – | – |
| ROIC | 3.7% | 3.5% | – | – |
| Capital expenditures | 21.2 | 30.0 | – | – |
| Depreciation | 10.8 | 13.0 | – | – |
By segment, the 2026 sales plan calls for cosmetics up 6.4% and cosmetaries up 3.9%. Within cosmetics, high prestige and prestige are each planned to grow by a mid single-digit percentage, with SEKKISEI planned at around +15%. By major group company, ALBION is planned up a mid single-digit percentage, KOSÉ Cosmeport up a low single-digit percentage, Tarte up a high single-digit percentage on a yen basis, and PURI up 30% to 35%. By region, Japan and Asia are each planned up a mid single-digit percentage and North America and others up a high single-digit percentage.
Shareholder Returns
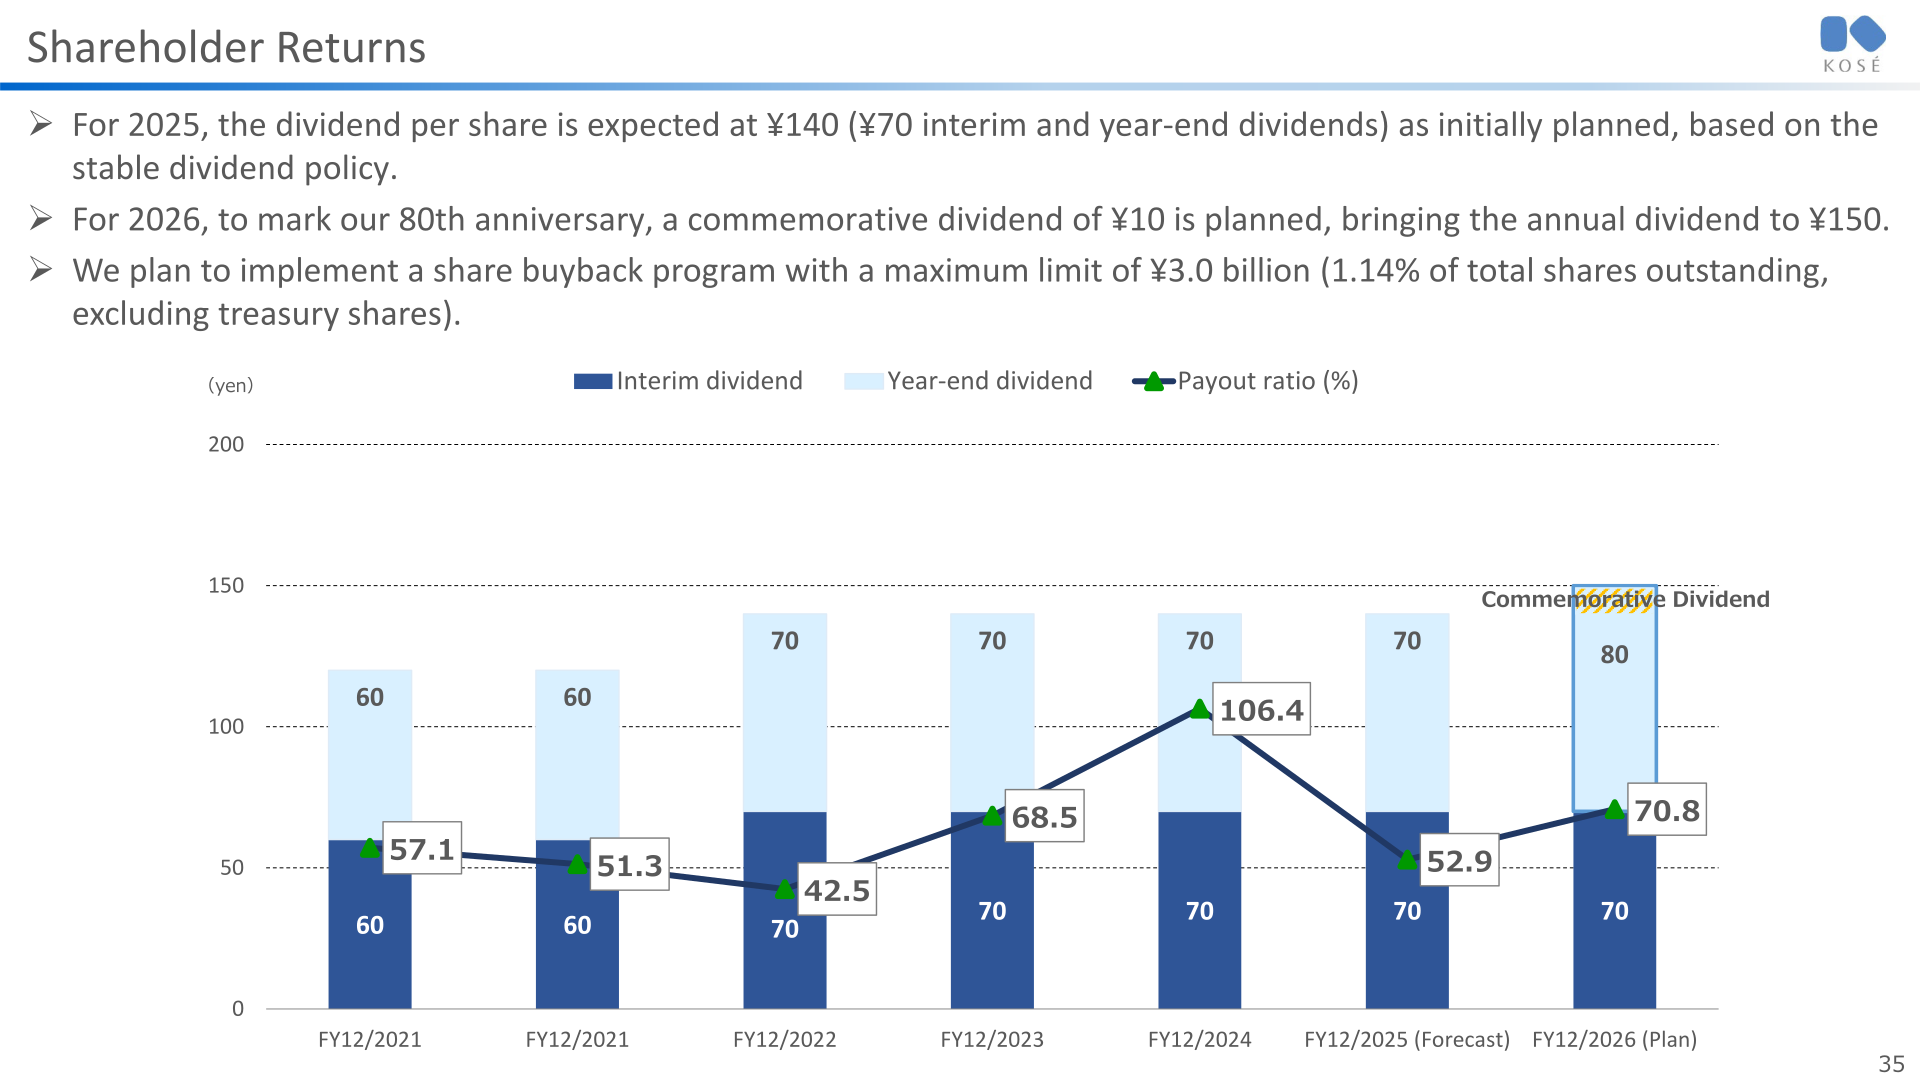
For 2025 the dividend per share is ¥140 (¥70 interim and ¥70 year-end) as initially planned under the stable dividend policy, giving a payout ratio of 52.9% against 106.4% in 2024. For 2026, to mark the company’s 80th anniversary, a commemorative dividend of ¥10 is planned, bringing the annual dividend to ¥150 (¥70 interim and ¥80 year-end) and the payout ratio to 70.8%. The company also plans a share buyback program with a maximum limit of ¥3.0 billion, equivalent to 1.14% of total shares outstanding excluding treasury shares. Under the 2025-2030 cumulative cash allocation plan, shareholder distributions are set at over ¥60 billion, against investments for growth of ¥110 billion and ordinary investments of ¥50 billion.
| Item | FY12/2024 | FY12/2025 | FY12/2026 (Plan) |
|---|---|---|---|
| Interim dividend per share | 70 yen | 70 yen | 70 yen |
| Year-end dividend per share | 70 yen | 70 yen | 80 yen |
| Payout ratio | 106.4% | 52.9% | 70.8% |
Resilient Business Structure and Capital Efficiency
KOSÉ Holdings states that the 2025 ROIC of 3.7% was below its weighted average cost of capital of 5%-6%, and that stronger governance is needed as well as improvements in profitability and asset efficiency. New 2026 measures include using ROIC as a metric for determining officer remuneration, adopting a ROIC tree to evaluate business performance at all business units, and strengthening group governance through the new holding company structure. The company targets a cost of sales ratio of 30.4% in FY2026 (FY2024 31.0%, FY2025 31.0%) and an SG&A expense ratio of 63.9% (FY2024 63.6%, FY2025 63.4%), with ROIC rising to 4.0%. The Resilient Business Structure initiative is expected to add ¥3.0 billion to operating profit in FY2026 compared with FY2025, made up of ¥1.5 billion from higher earnings due to top-line growth (sales up ¥8.0 billion) and ¥2.0 billion from a reexamination of the profit structure.
The Minami Alps factory is scheduled to start operations in July 2026, raising output capacity to 40% above the current level. Lease payments and depreciation are expected to be about ¥1.2 billion in the first year (six months) and about ¥2.4 billion annually starting in 2027. Capital expenditures at the factory were ¥12.0 billion in 2024 and ¥10.0 billion in 2025, with ¥16.0 billion planned for 2026.
Milestone2030 Progress
Against the Milestone2030 numerical targets, the 2025 overseas sales ratio was 34.8% (2024: 34.5%) versus a 2030 milestone of more than 50%; the operating margin was 5.6% (2024: 5.4%) versus more than 12%; the EBITDA margin was 9.4% (2024: 8.8%) versus more than 18%; and ROIC was 3.7% (2024: 2.6%) versus more than 10%. On the balance sheet, total assets stood at ¥393.4 billion as of December 31, 2025 (up ¥6.6 billion), with total net assets of ¥304.7 billion, or 77.5% of total assets, and cash and deposits of ¥92.4 billion.
This article is an analysis based on publicly available information and is not a recommendation to buy or sell any specific securities. Investment decisions are your own responsibility.
![[Obayashi] Investors’ Guide 2026 — The Complete 24-Article Breakdown](https://japan-equity.com/wp-content/uploads/2026/07/hub_cover-1024x1024.png)
![[Obayashi] IR & SR Policy — Feeding Dialogue Back into Management](https://japan-equity.com/wp-content/uploads/2026/07/p32_sq-1024x1024.jpg)
![[Obayashi] Real Estate Development — 18.7% Margin, ¥287.7bn Unrealized Gains](https://japan-equity.com/wp-content/uploads/2026/07/p20_sq-1024x1024.jpg)
![[Obayashi] Domestic Civil Engineering — Resilience Spending Supports 9.6% Margin](https://japan-equity.com/wp-content/uploads/2026/07/p11_sq-1024x1024.jpg)
![[Obayashi] Share Price & External Ratings — vs TOPIX, ESG Index Inclusion](https://japan-equity.com/wp-content/uploads/2026/07/p40_sq-1024x1024.jpg)
![[Construction] ¥75.5tn Investment, Shrinking Workforce — Big-5 Market Share](https://japan-equity.com/wp-content/uploads/2026/07/p12_sq-1024x1024.jpg)



![[Obayashi] Capital Policy & Shareholder Returns — ROE 10%+, DOE ~5%, ¥100bn Buyback](https://japan-equity.com/wp-content/uploads/2026/07/p27_sq-1024x1024.jpg)
![[Obayashi] Reducing Cross-Shareholdings — ¥285.2bn Sold in Five Years](https://japan-equity.com/wp-content/uploads/2026/07/p29_sq-1024x1024.jpg)
![[Obayashi] ¥750bn Investment Plan — ¥300bn to Development, ¥190bn to Tech/DX](https://japan-equity.com/wp-content/uploads/2026/07/p30_sq-1024x1024.jpg)
![[Obayashi] MTP2022 KPIs — Operating Profit ~2x Target, ROE 14.4%](https://japan-equity.com/wp-content/uploads/2026/07/p25_sq-1024x1024.jpg)
![[Obayashi] Cash Allocation — ¥420bn Investment CF Over Five Years](https://japan-equity.com/wp-content/uploads/2026/07/p26_sq-1024x1024.jpg)
![[Obayashi] Green Energy — 44 Plants, 344MW, and the Green Hydrogen Challenge](https://japan-equity.com/wp-content/uploads/2026/07/p21_sq-1024x1024.jpg)
![[Obayashi] Tackling the Labor Shortage — Robotics Construction®](https://japan-equity.com/wp-content/uploads/2026/07/p14_sq-1024x1024.jpg)
