
This article is based on publicly available IR materials and is not a recommendation to buy or sell any specific securities.
Tokai Rika Co., Ltd. (6995), a manufacturer of automotive parts including HMI products, smart systems, seat belts, shift levers, and key locks, reported consolidated net sales of ¥644.7 billion for the fiscal year ended March 31, 2026, up 4.4% year on year and the highest on record, driven by increased production volume at major customers and cost recoveries. Operating profit rose slightly to ¥35.6 billion despite higher fixed costs from human capital investment and future-oriented investments, and the company achieved record highs at operating income and all profit levels. For the fiscal year ending March 2027, the company forecasts net sales of ¥650.0 billion and operating income of ¥30.0 billion.
Note: The company’s presentation labels the fiscal year ended March 31, 2026 (April 2025–March 2026) as “FY2026.” This site classifies the most recently completed fiscal year as FY2025; labels in the tables below follow the company’s materials.
Restatement of Prior-Year Financial Statements
In early April 2026, during the closing process for the fiscal year ended March 2026, the company discovered an error in the accounting treatment for tax effects related to retirement benefit (a recurring error carried forward from prior years). Deferred tax assets had been overstated on the balance sheet, and income tax adjustments had been understated on the income statement (i.e., profits were overstated). Accordingly, the financial statements for each fiscal year from the year ended March 2021 to the year ended March 2025 have been restated. For the year ended March 2025, profit attributable to owners of parent was corrected from ¥27.8 billion to ¥26.0 billion (△6.3%) and equity from ¥337.8 billion to ¥329.6 billion (△2.4%), while net sales were unchanged at ¥617.6 billion.
Consolidated Results (Full Year)
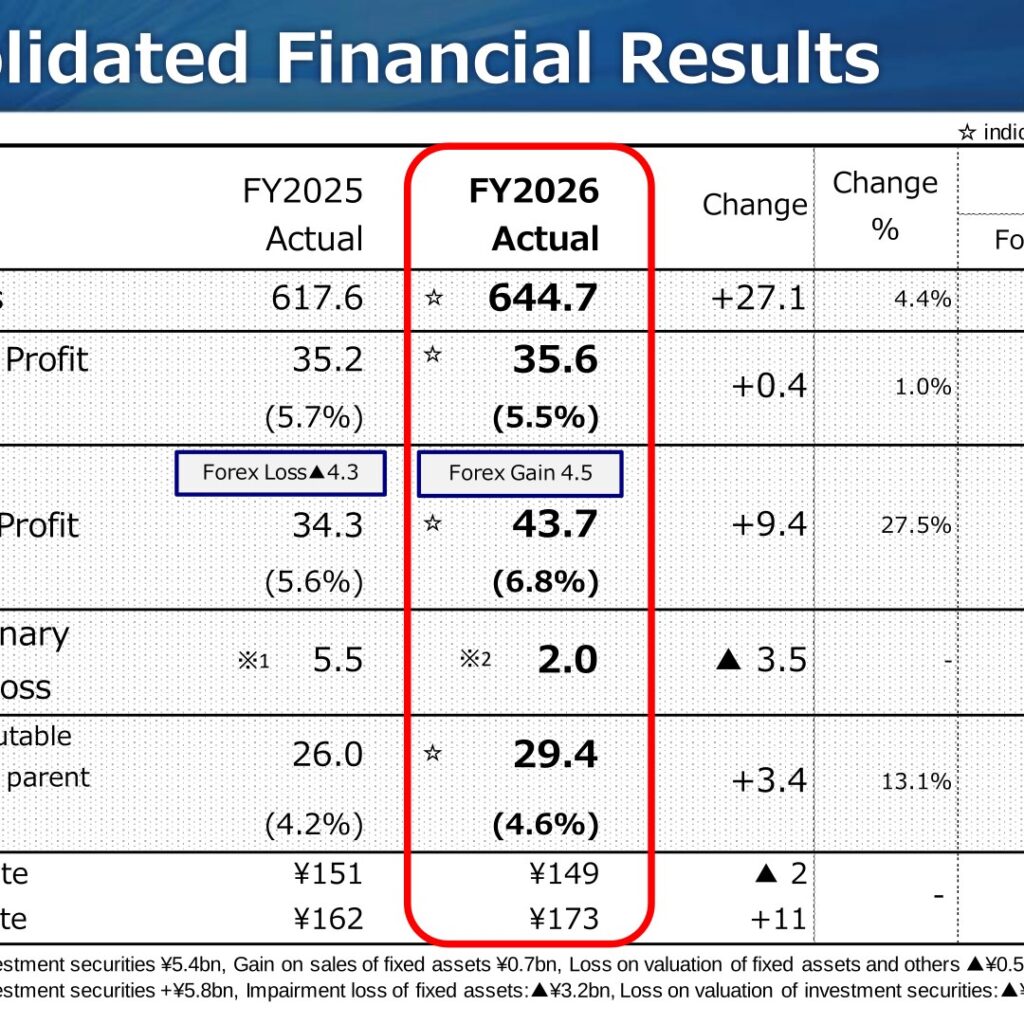
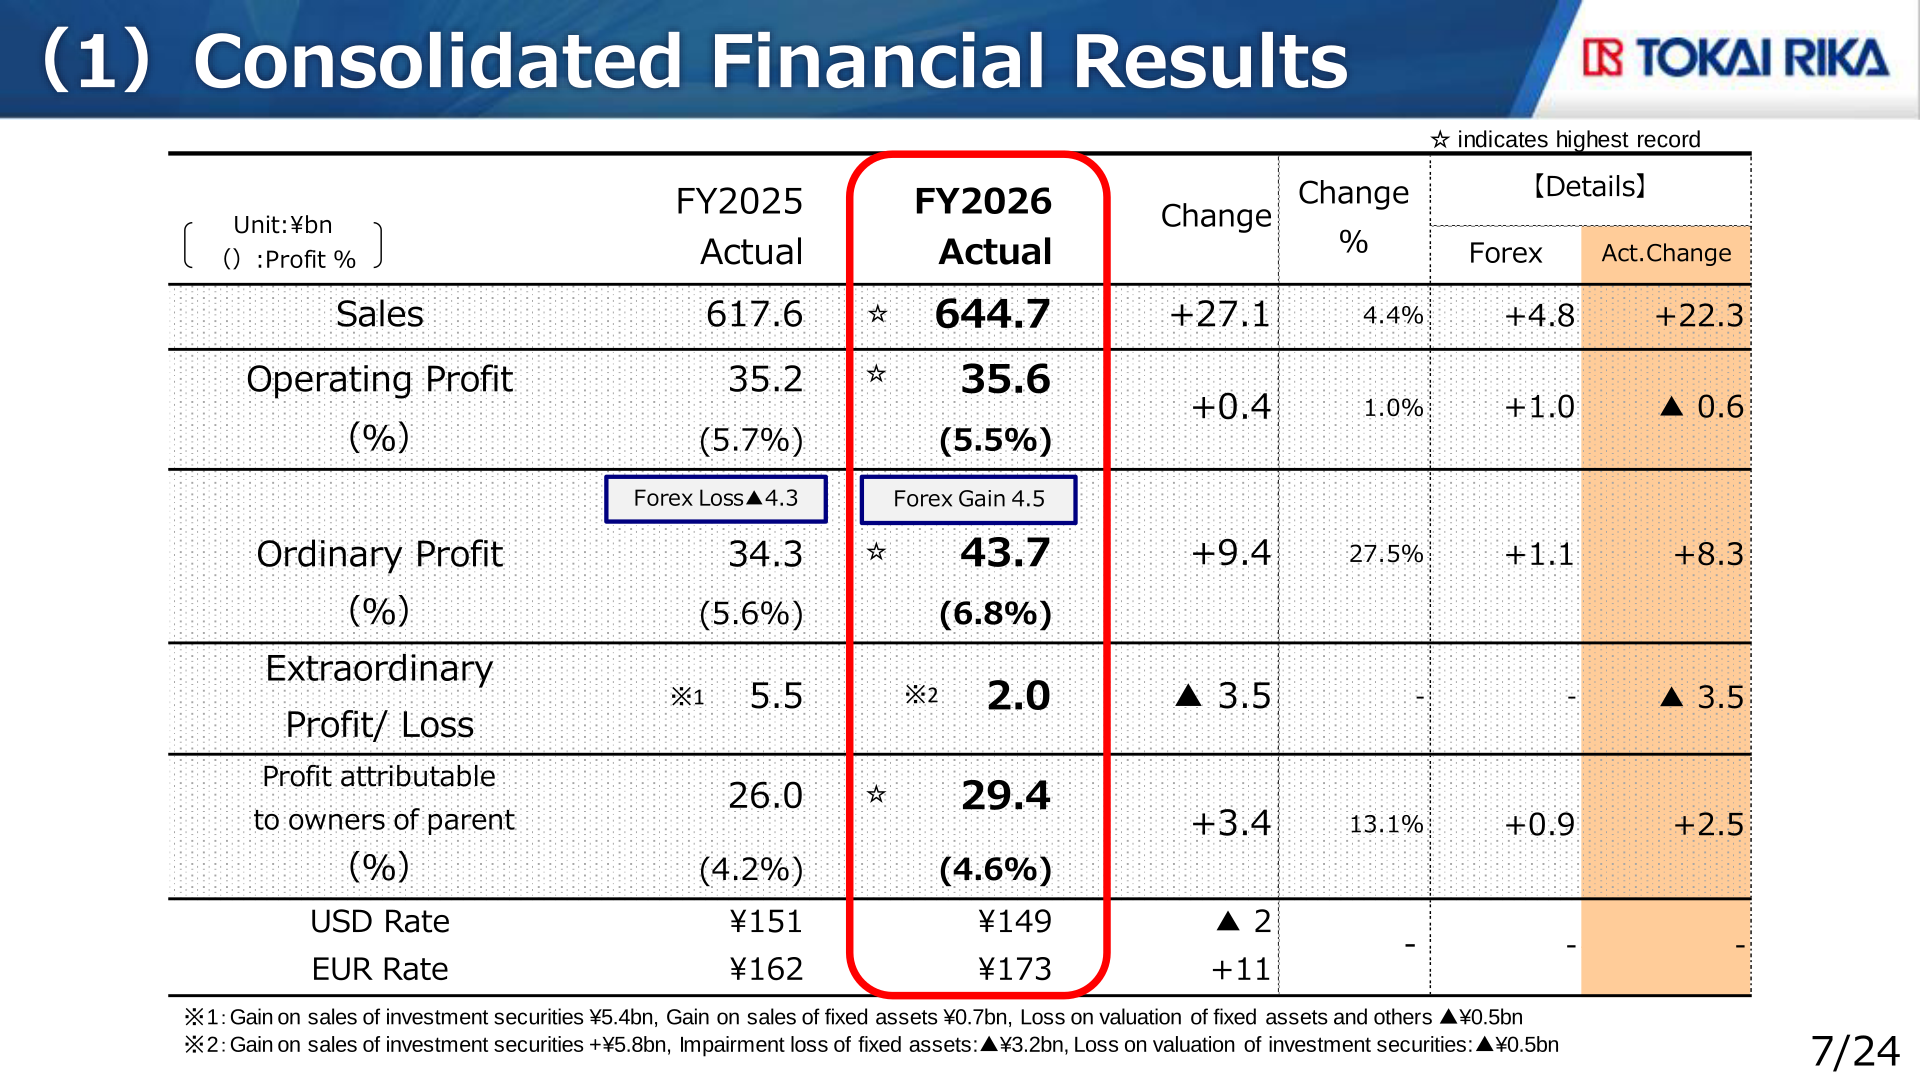
Sales of ¥644.7 billion (+¥27.1 billion, +4.4%), operating profit of ¥35.6 billion (+¥0.4 billion, +1.0%), ordinary profit of ¥43.7 billion (+¥9.4 billion, +27.5%), and profit attributable to owners of parent of ¥29.4 billion (+¥3.4 billion, +13.1%) were all record highs. Extraordinary profit/loss declined from ¥5.5 billion to ¥2.0 billion, with the current year including a gain on sales of investment securities of +¥5.8 billion, impairment loss of fixed assets of ▲¥3.2 billion, and loss on valuation of investment securities of ▲¥0.5 billion. Ordinary profit reflected a swing from a forex loss of ▲4.3 in FY2025 to a forex gain of 4.5 in FY2026.
| Item (Unit: ¥bn) | FY2025 Actual | FY2026 Actual | Change | Change % |
|---|---|---|---|---|
| Sales | 617.6 | 644.7 | +27.1 | 4.4% |
| Operating Profit (margin) | 35.2 (5.7%) | 35.6 (5.5%) | +0.4 | 1.0% |
| Ordinary Profit (margin) | 34.3 (5.6%) | 43.7 (6.8%) | +9.4 | 27.5% |
| Extraordinary Profit/Loss | 5.5 | 2.0 | ▲ 3.5 | – |
| Profit attributable to owners of parent (margin) | 26.0 (4.2%) | 29.4 (4.6%) | +3.4 | 13.1% |
| USD Rate | ¥151 | ¥149 | ▲ 2 | – |
| EUR Rate | ¥162 | ¥173 | +11 | – |
The ¥0.4 billion year-on-year increase in operating profit breaks down as: production volume +2.6, forex +1.0, selling prices ▲0.7, material prices ▲1.8 (price up ▲12.4, price recovery +10.6, including U.S. tariff ▲0.8), cost reduction +6.2, fixed cost ▲7.8 (labor cost ▲4.4, expenses ▲1.1, depreciations ▲2.3), and others +0.9 (Unit: ¥bn).
Sales by Customer, Product, and Region
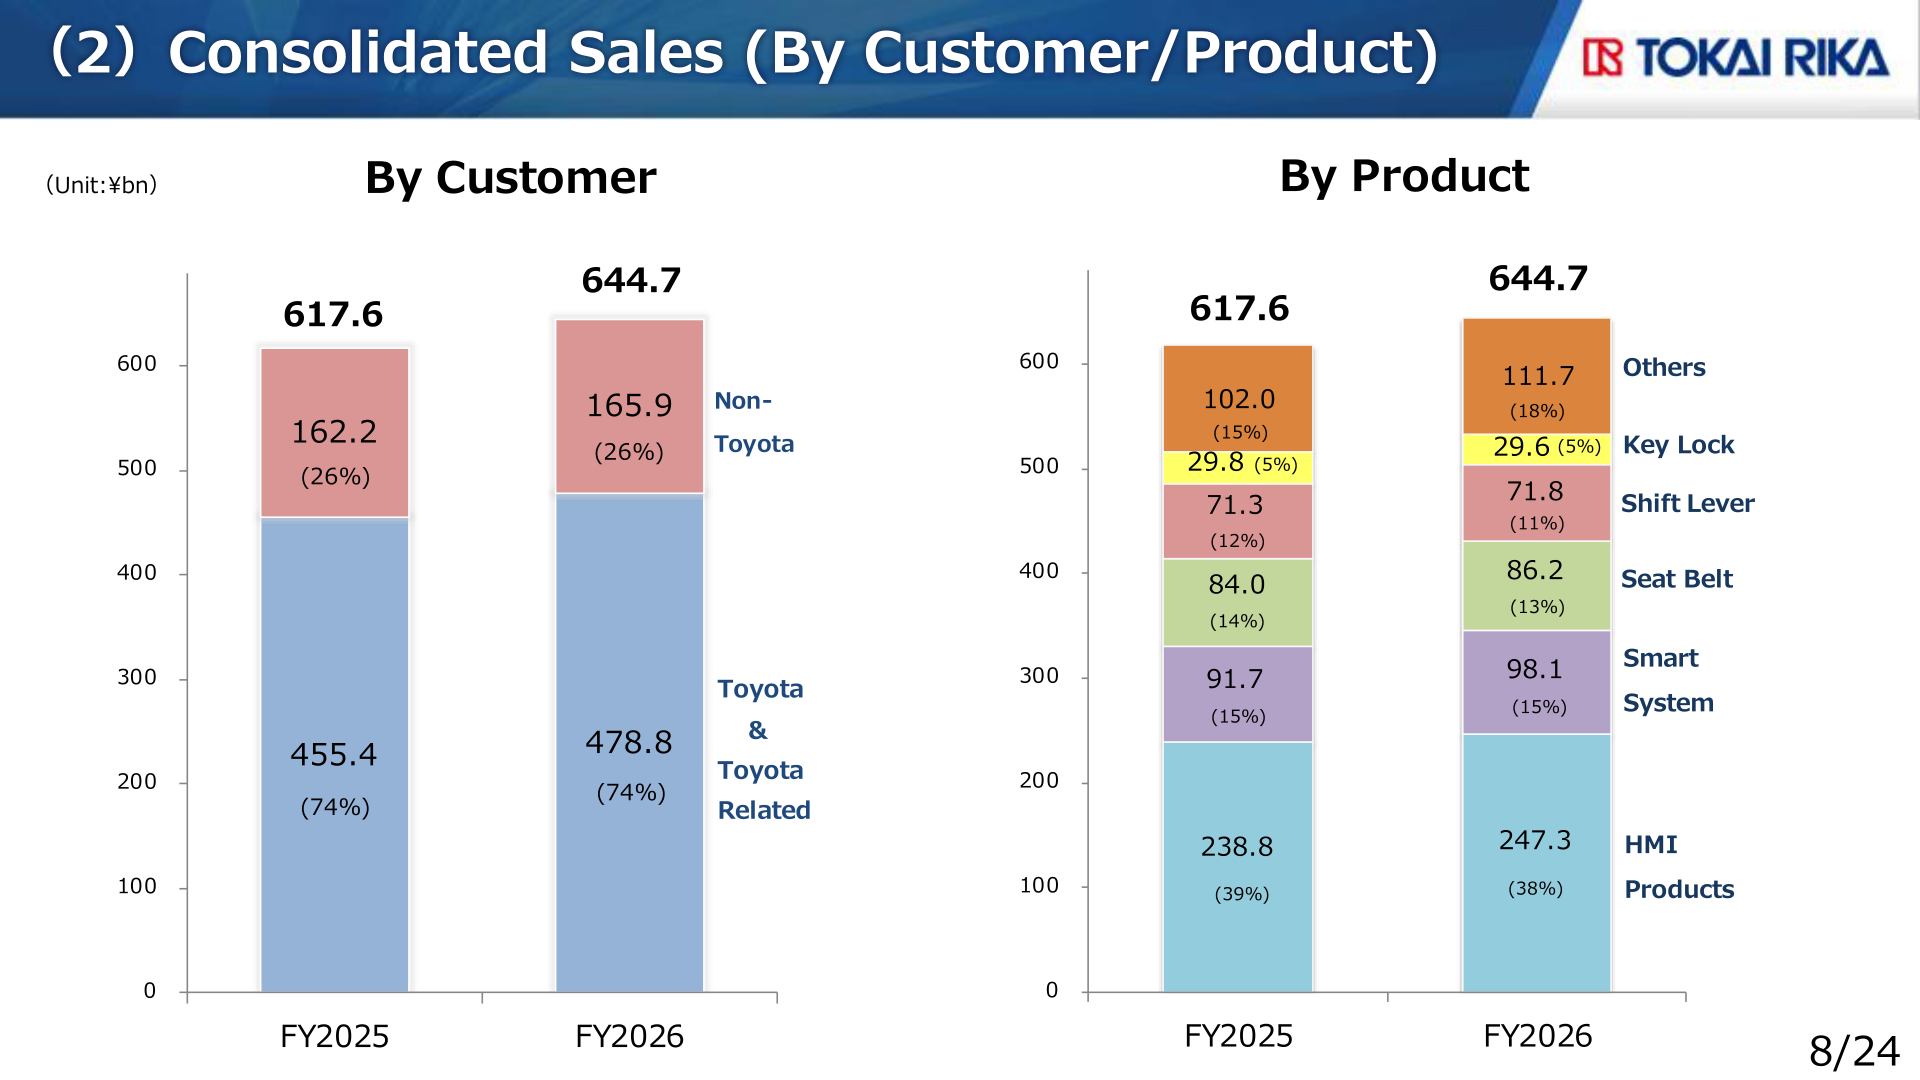
By customer, sales to Toyota & Toyota Related were ¥478.8 billion (74% of total, vs ¥455.4 billion in FY2025), and Non-Toyota sales were ¥165.9 billion (26%, vs ¥162.2 billion). By product, HMI Products posted ¥247.3 billion (38%), Smart System ¥98.1 billion (15%), Seat Belt ¥86.2 billion (13%), Shift Lever ¥71.8 billion (11%), Key Lock ¥29.6 billion (5%), and Others ¥111.7 billion (18%).
By region, Japan sales rose to ¥325.7 billion with an operating loss of ▲¥1.4 billion, the Americas posted sales of ¥173.4 billion with operating profit of ¥8.2 billion, Asia recorded sales of ¥195.2 billion with operating profit of ¥24.8 billion (12.7% margin), and Europe/Brazil posted sales of ¥50.6 billion with operating profit of ¥4.2 billion.
| Region | Metric (Unit: ¥bn) | FY2025 Actual | FY2026 Actual | Change |
|---|---|---|---|---|
| Japan | Sales | 307.6 | 325.7 | +18.1 |
| Japan | Operating Profit | ▲ 0.9 | ▲ 1.4 | ▲ 0.5 |
| Americas | Sales | 164.7 | 173.4 | +8.7 |
| Americas | Operating Profit | 8.0 | 8.2 | +0.2 |
| Asia | Sales | 192.7 | 195.2 | +2.5 |
| Asia | Operating Profit | 23.9 | 24.8 | +0.9 |
| Europe/Brazil | Sales | 49.3 | 50.6 | +1.3 |
| Europe/Brazil | Operating Profit | 3.4 | 4.2 | +0.8 |
| Consolidation Adjustment | Sales | ▲ 96.8 | ▲ 100.3 | ▲ 3.5 |
| Consolidation Adjustment | Operating Profit | 0.7 | ▲ 0.3 | ▲ 1.0 |
| Total | Sales | 617.6 | 644.7 | +27.1 |
| Total | Operating Profit | 35.2 | 35.6 | +0.4 |
FY2027 Forecast
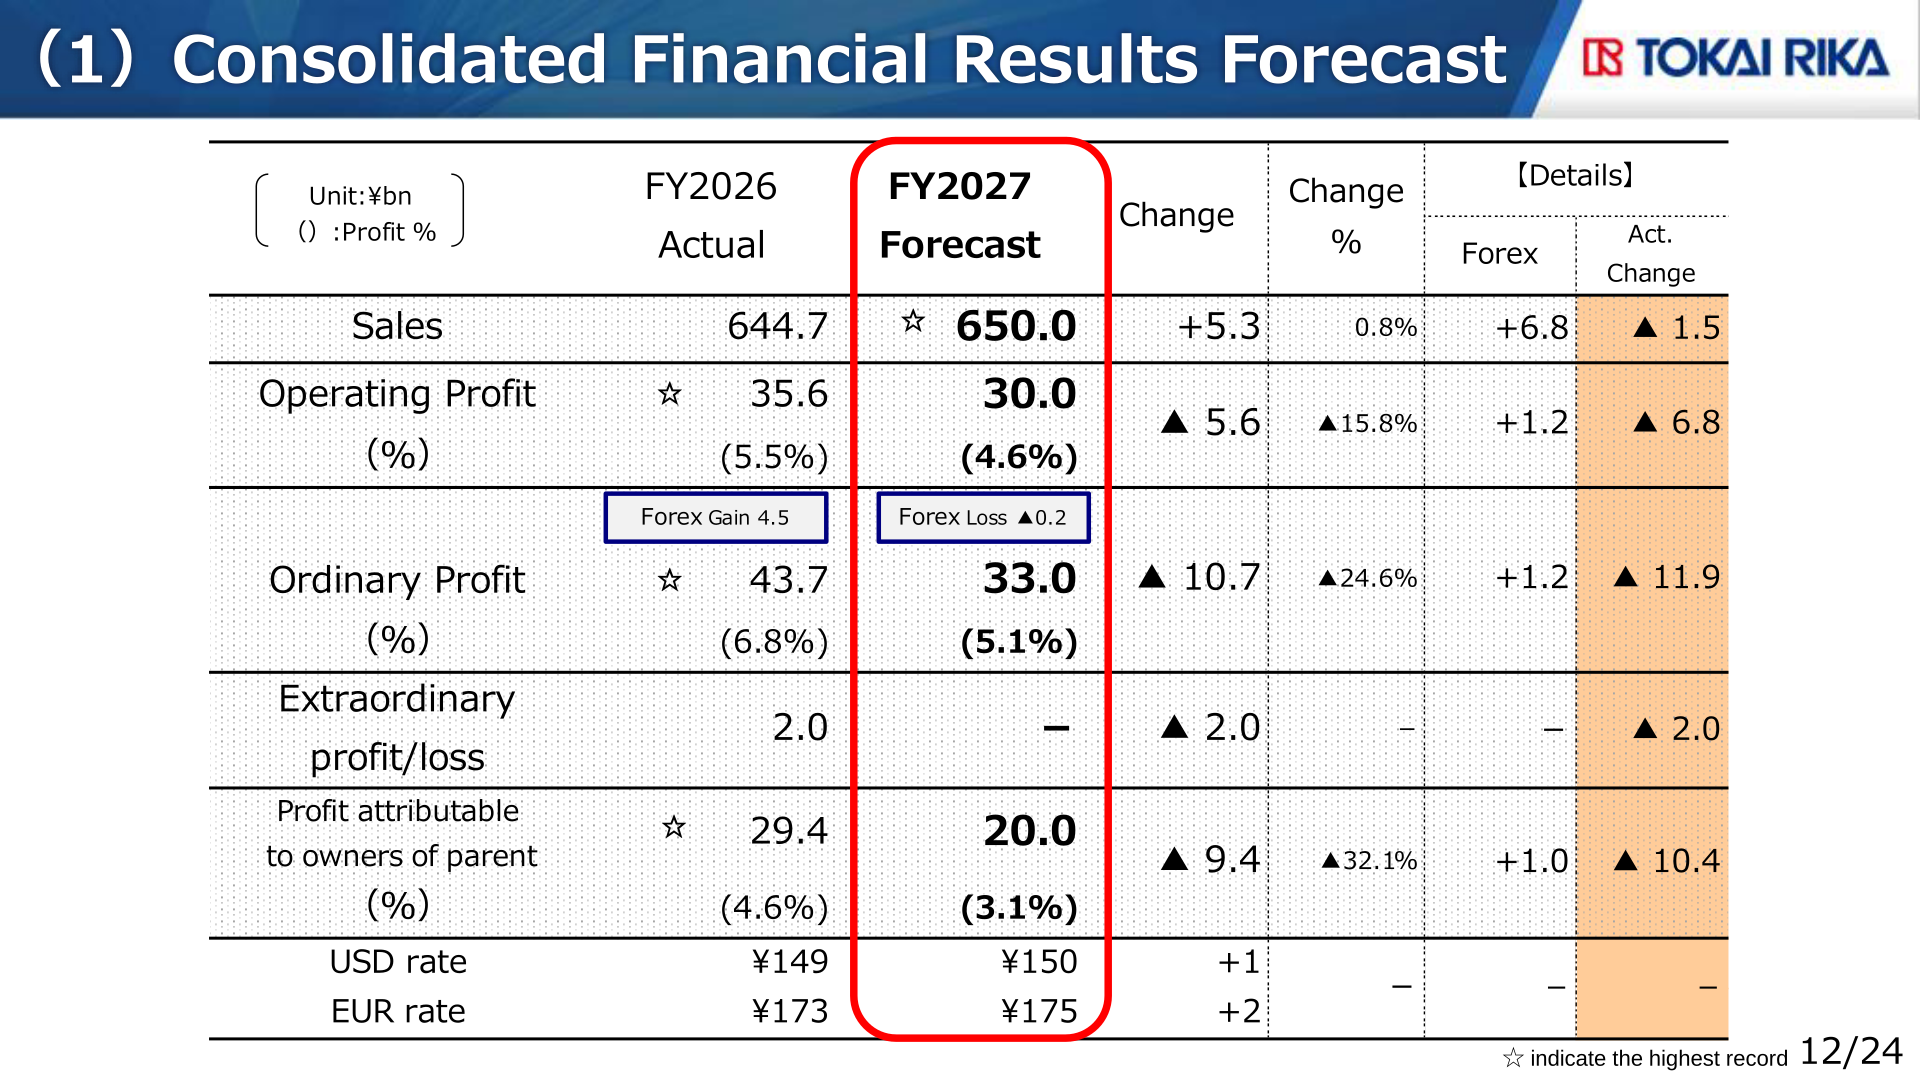
For FY2027 (fiscal year ending March 2027), the company forecasts sales of ¥650.0 billion (+¥5.3 billion, +0.8%), operating profit of ¥30.0 billion (▲¥5.6 billion, ▲15.8%), ordinary profit of ¥33.0 billion (▲¥10.7 billion, ▲24.6%), and profit attributable to owners of parent of ¥20.0 billion (▲¥9.4 billion, ▲32.1%). Although a slight increase in revenue is expected, profits are projected to decline due to uncertainties in the external environment, including geopolitical risks in the Middle East and the impact of rapid inflation. Assumed exchange rates are ¥150 per USD and ¥175 per EUR.
| Item (Unit: ¥bn) | FY2026 Actual | FY2027 Forecast | Change | Change % |
|---|---|---|---|---|
| Sales | 644.7 | 650.0 | +5.3 | 0.8% |
| Operating Profit (margin) | 35.6 (5.5%) | 30.0 (4.6%) | ▲ 5.6 | ▲15.8% |
| Ordinary Profit (margin) | 43.7 (6.8%) | 33.0 (5.1%) | ▲ 10.7 | ▲24.6% |
| Extraordinary profit/loss | 2.0 | - | ▲ 2.0 | – |
| Profit attributable to owners of parent (margin) | 29.4 (4.6%) | 20.0 (3.1%) | ▲ 9.4 | ▲32.1% |
| USD rate | ¥149 | ¥150 | +1 | – |
| EUR rate | ¥173 | ¥175 | +2 | – |
The forecast ¥5.6 billion decrease in operating profit versus FY2026 breaks down as: production volume +1.5, forex +1.2, selling prices ▲5.8, material prices ▲4.9 (price up ▲10.0, price recovery +5.1), cost reduction +9.3, fixed cost ▲4.9 (labor cost ▲3.4, expenses +0.1, depreciations ▲1.6), and others ▲2.0 (Unit: ¥bn). By region, the company projects Japan sales of ¥334.5 billion with an operating loss of ▲¥1.0 billion, Americas sales of ¥168.3 billion with operating profit of ¥5.6 billion, Asia sales of ¥192.9 billion with operating profit of ¥22.9 billion, and Europe/Brazil sales of ¥47.1 billion with operating profit of ¥3.3 billion.
Shareholder Returns
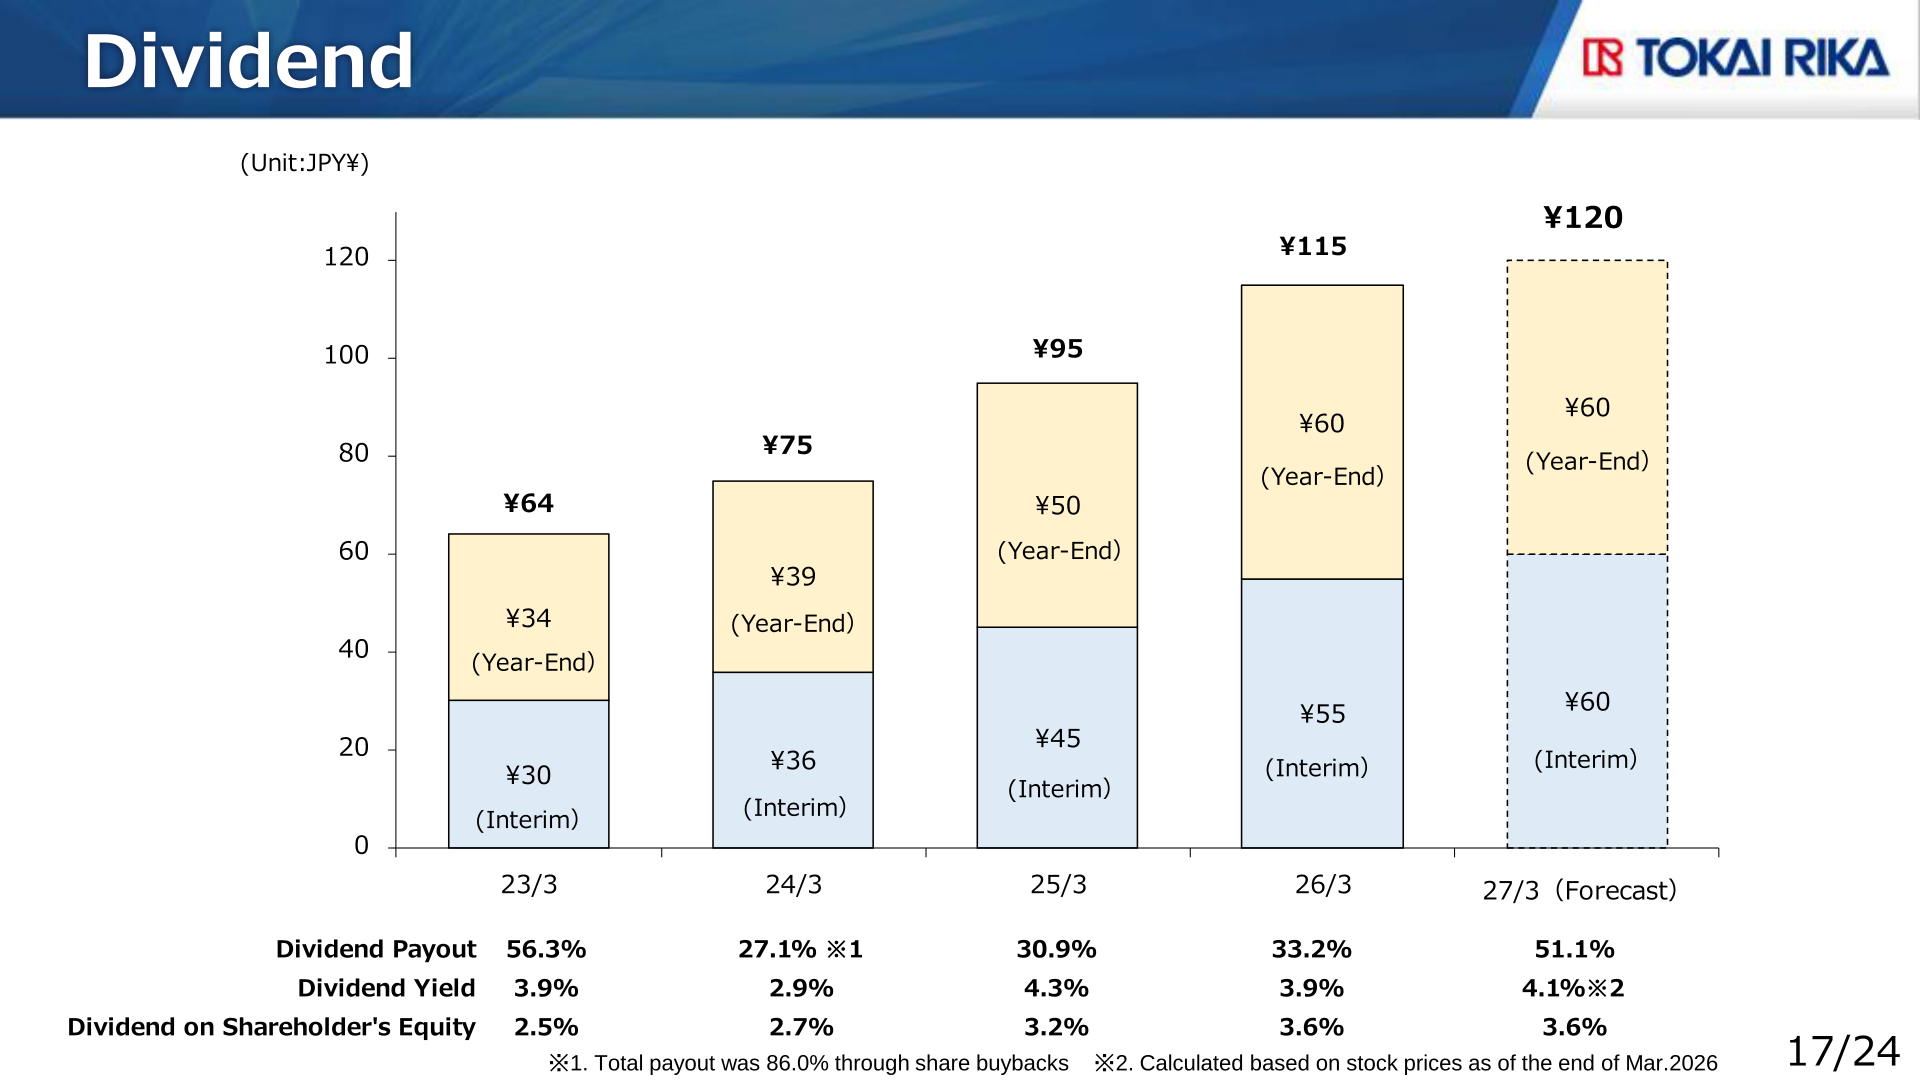
The annual dividend for the year ended March 2026 (26/3) was ¥115 per share (interim ¥55, year-end ¥60), up from ¥95 for 25/3, with a dividend payout of 33.2%, a dividend yield of 3.9%, and dividend on shareholder’s equity of 3.6%. For 27/3, the company forecasts an annual dividend of ¥120 per share (interim ¥60, year-end ¥60), with a dividend payout of 51.1% and a dividend yield of 4.1% (calculated based on stock prices as of the end of March 2026).
| Item | 25/3 | 26/3 | 27/3 (Forecast) |
|---|---|---|---|
| Interim dividend | ¥45 | ¥55 | ¥60 |
| Year-end dividend | ¥50 | ¥60 | ¥60 |
| Annual dividend | ¥95 | ¥115 | ¥120 |
| Dividend Payout | 30.9% | 33.2% | 51.1% |
| Dividend Yield | 4.3% | 3.9% | 4.1% |
| Dividend on Shareholder’s Equity | 3.2% | 3.6% | 3.6% |
Medium-Term Targets and Management KPI
Under its TRV target for 31/3, the company aims for sales of ¥700.0 billion and operating profit of ¥49.0 billion with a 7.0% operating margin, versus ¥644.7 billion and ¥35.6 billion (5.5%) in 26/3. The mid-term plan TR Vision’s target is an ROE of 10%; ROE was 9.0% in FY2026 and is forecast at 5.7% for FY2027, with PBR at 0.7 for both years (stock price as of the end of March 2026). EPS was ¥346 in FY2026 (forecast ¥234 for FY2027), BPS ¥4,086 (¥4,205), and the equity ratio 63.4% (65.3%). R&D cost was ¥34.4 billion in 26/3 (5.3% of sales) and is forecast at ¥36.0 billion (5.5%) for 27/3; capital investment was ¥32.6 billion in FY2026 and is forecast at ¥33.0 billion for FY2027.
This article is an analysis based on publicly available information and is not a recommendation to buy or sell any specific securities. Investment decisions are your own responsibility.
![[Obayashi] Investors’ Guide 2026 — The Complete 24-Article Breakdown](https://japan-equity.com/wp-content/uploads/2026/07/hub_cover-1024x1024.png)
![[Obayashi] IR & SR Policy — Feeding Dialogue Back into Management](https://japan-equity.com/wp-content/uploads/2026/07/p32_sq-1024x1024.jpg)
![[Obayashi] Domestic Civil Engineering — Resilience Spending Supports 9.6% Margin](https://japan-equity.com/wp-content/uploads/2026/07/p11_sq-1024x1024.jpg)
![[Obayashi] Overseas Construction — Orders Reach ¥1.2tn](https://japan-equity.com/wp-content/uploads/2026/07/p15_sq-1024x1024.jpg)
![[Obayashi] Share Price & External Ratings — vs TOPIX, ESG Index Inclusion](https://japan-equity.com/wp-content/uploads/2026/07/p40_sq-1024x1024.jpg)
![[Construction] ¥75.5tn Investment, Shrinking Workforce — Big-5 Market Share](https://japan-equity.com/wp-content/uploads/2026/07/p12_sq-1024x1024.jpg)



![[Obayashi] Capital Policy & Shareholder Returns — ROE 10%+, DOE ~5%, ¥100bn Buyback](https://japan-equity.com/wp-content/uploads/2026/07/p27_sq-1024x1024.jpg)
![[Obayashi] Reducing Cross-Shareholdings — ¥285.2bn Sold in Five Years](https://japan-equity.com/wp-content/uploads/2026/07/p29_sq-1024x1024.jpg)
![[Obayashi] ¥750bn Investment Plan — ¥300bn to Development, ¥190bn to Tech/DX](https://japan-equity.com/wp-content/uploads/2026/07/p30_sq-1024x1024.jpg)
![[Obayashi] MTP2022 KPIs — Operating Profit ~2x Target, ROE 14.4%](https://japan-equity.com/wp-content/uploads/2026/07/p25_sq-1024x1024.jpg)
![[Obayashi] Cash Allocation — ¥420bn Investment CF Over Five Years](https://japan-equity.com/wp-content/uploads/2026/07/p26_sq-1024x1024.jpg)
![[Obayashi] Green Energy — 44 Plants, 344MW, and the Green Hydrogen Challenge](https://japan-equity.com/wp-content/uploads/2026/07/p21_sq-1024x1024.jpg)
![[Obayashi] Tackling the Labor Shortage — Robotics Construction®](https://japan-equity.com/wp-content/uploads/2026/07/p14_sq-1024x1024.jpg)
