
This article is based on publicly available IR materials and is not a recommendation to buy or sell any specific securities.
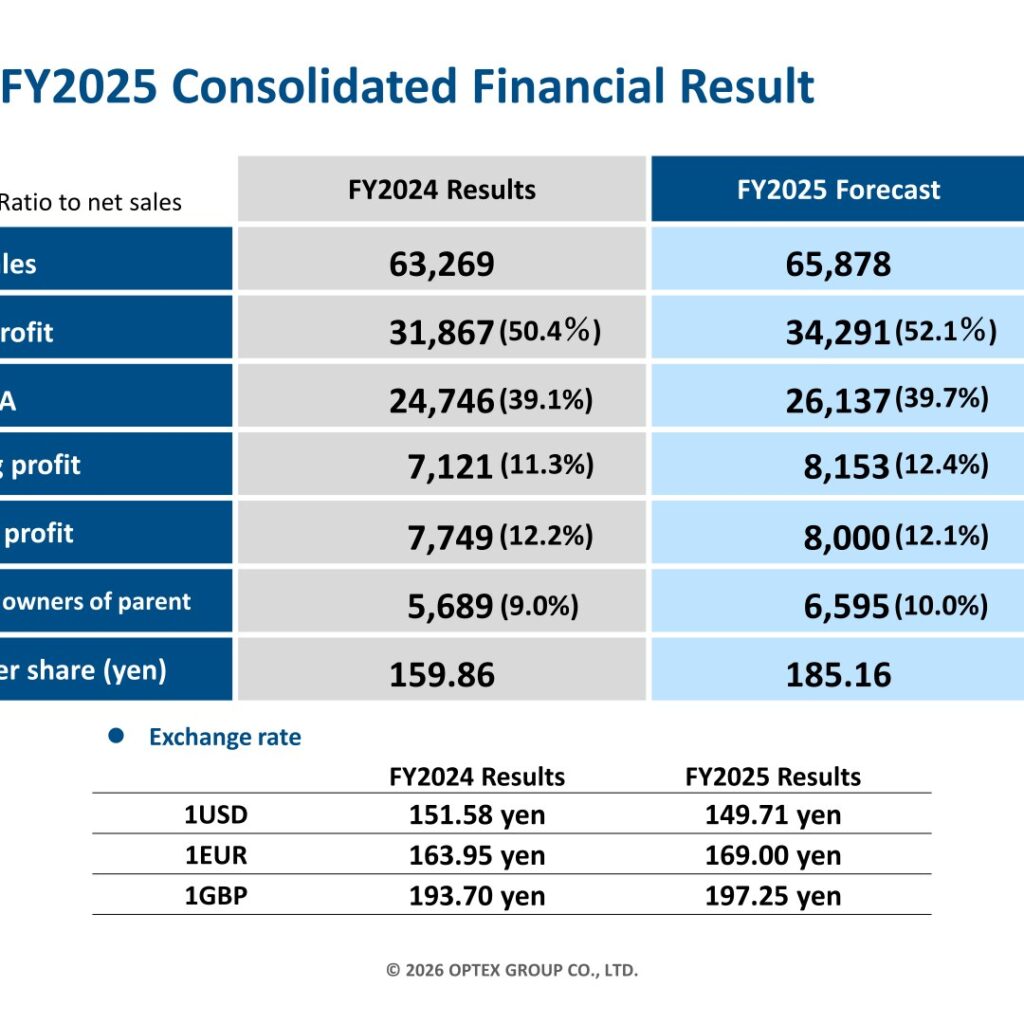
OPTEX GROUP CO., LTD. (Tokyo Stock Exchange Prime Market, Securities code: 6914), whose fiscal year ends in December, reported FY2025 consolidated net sales of 65,878 million yen, up 4.1% year on year, and operating profit of 8,153 million yen, up 14.5%. The gross profit to net sales ratio improved significantly, helped by a better product mix from higher sales of highly profitable products such as security sensors for large critical facilities in the Sensing Solution (SS) Business. Profit attributable to owners of parent rose 15.9% to 6,595 million yen. Alongside the results, the company announced a new three-year management plan (FY2026-FY2028) and a strengthened shareholder return policy effective FY2026.
Consolidated Results (Full-Year Actual)
Net sales increased 4.1% year on year. In the Sensing Solution (SS) Business, sales for large critical facilities in the Security Sensors segment and for parking lots in the Social and Environmental-related segment remained strong. In the Industrial Automation (IA) Business, sales related to Factory Automation and Inspection Lighting remained solid, while Automation Systems-related orders (for secondary battery manufacturing equipment) remained weak. Operating profit increased 14.5%, with the gross profit ratio improving from 50.4% to 52.1% of net sales, reflecting higher sales of highly profitable products and the effect of price revisions; the U.S. tariff impact on operating profit was -400 million yen. Average exchange rates were 149.71 yen per USD and 169.00 yen per EUR in FY2025.
| Item (million yen) | FY2024 Results | FY2025 Results | YoY |
|---|---|---|---|
| Net sales | 63,269 | 65,878 | +4.1% |
| Gross profit | 31,867 (50.4%) | 34,291 (52.1%) | +7.6% |
| SG&A | 24,746 (39.1%) | 26,137 (39.7%) | +5.6% |
| Operating profit | 7,121 (11.3%) | 8,153 (12.4%) | +14.5% |
| Ordinary profit | 7,749 (12.2%) | 8,000 (12.1%) | +3.3% |
| Profit attributable to owners of parent | 5,689 (9.0%) | 6,595 (10.0%) | +15.9% |
| Basic earnings per share (yen) | 159.86 | 185.16 | – |
Segment Results
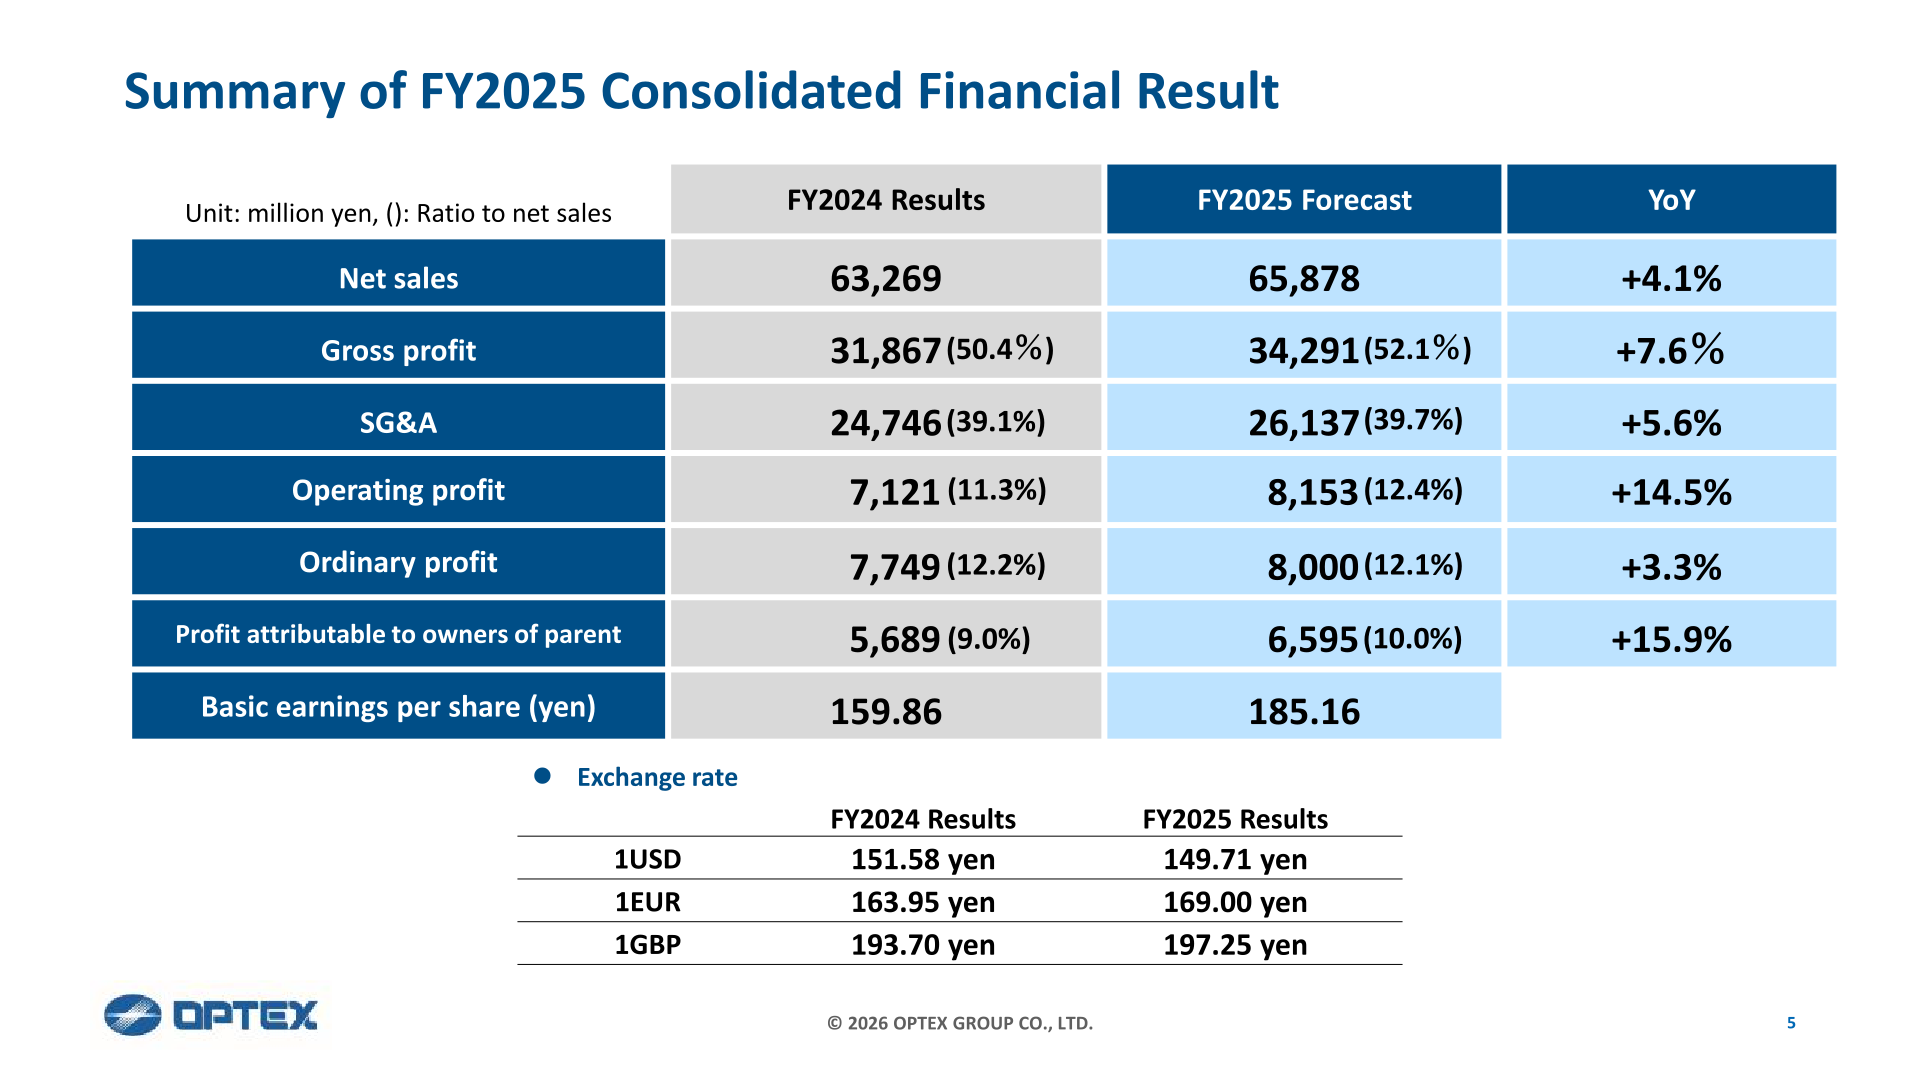
By segment, the Sensing Solution Business grew net sales 9.4% to 31,044 million yen with operating profit up 24.9% to 4,888 million yen (operating profit margin 15.7%). The Industrial Automation Business posted net sales of 33,734 million yen, down 0.0%, with operating profit up 1.7% to 3,827 million yen (margin 11.3%). The EMS Business recorded net sales of 996 million yen, down 4.4%, and an operating loss of 32 million yen (versus a loss of 120 million yen in FY2024). Net sales by segment exclude inter-segment transactions, while operating profit by segment includes operating profit from inter-segment transactions.
| Segment | Metric | FY2024 Results | FY2025 Results | YoY |
|---|---|---|---|---|
| Sensing Solution Business | Net sales (million yen) | 28,374 | 31,044 | +9.4% |
| Sensing Solution Business | Operating profit (million yen) | 3,915 (13.8%) | 4,888 (15.7%) | +24.9% |
| Industrial Automation Business | Net sales (million yen) | 33,748 | 33,734 | -0.0% |
| Industrial Automation Business | Operating profit (million yen) | 3,764 (11.2%) | 3,827 (11.3%) | +1.7% |
| EMS Business | Net sales (million yen) | 1,042 | 996 | -4.4% |
| EMS Business | Operating profit (million yen) | -120 | -32 | – |
By product category, full-year sales were as follows. Security Sensors benefited from ongoing data-center-related projects and large projects for electric power facilities, while Social & Environmental grew 24% on strong vehicle detection sensor and water quality measurement sales. Automation Systems declined 15% due to weak orders for secondary battery manufacturing equipment amid decelerating EV-related capital investment.
| Product category | FY2024 (million yen) | FY2025 (million yen) | YoY |
|---|---|---|---|
| Security Sensors (SS) | 18,227 | 19,925 | +9% |
| Automatic Door Sensors (SS) | 6,965 | 7,182 | +3% |
| Social & Environmental (SS) | 3,182 | 3,937 | +24% |
| Factory Automation (IA) | 8,350 | 9,001 | +8% |
| Inspection Lighting (IA) | 14,266 | 14,774 | +4% |
| Industrial PCs (IA) | 4,926 | 4,690 | -5% |
| Automation Systems (IA) | 6,206 | 5,270 | -15% |
FY2026 Forecast
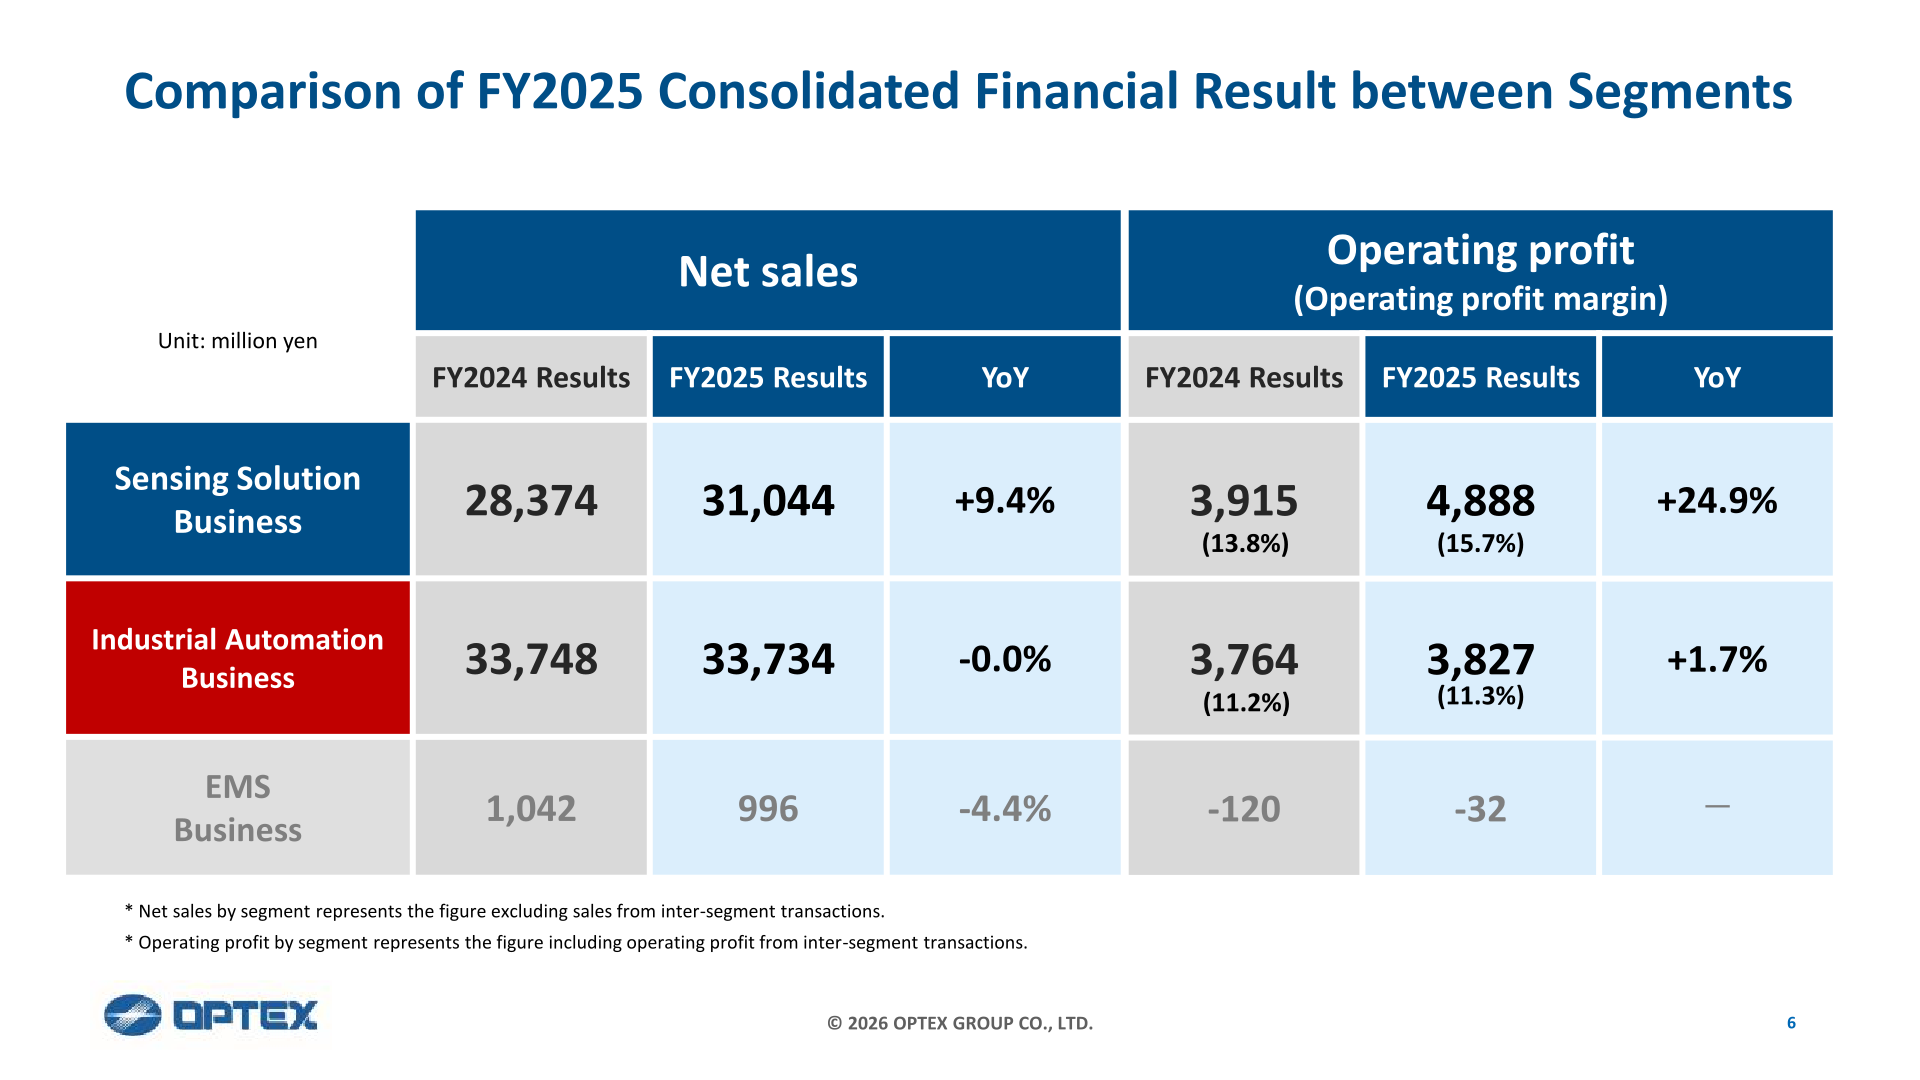
For FY2026, the company forecasts net sales of 69,000 million yen (up 4.7%), operating profit of 8,800 million yen (up 7.9%), ordinary profit of 8,800 million yen (up 10.0%) and profit attributable to owners of parent of 6,600 million yen (up 0.1%). The forecasts reflect the impact of U.S. tariffs (an operating profit impact of -500 million yen) and a decrease in Automation Systems-related orders in the IA Business. The company will seek to strengthen sales of highly profitable products, such as FA sensors and Inspection Lighting in the Industrial Automation Business, against a backdrop of stable growth in the Sensing Solution Business. Assumed exchange rates are 150.00 yen per USD, 175.00 yen per EUR and 200.00 yen per GBP.
| Item (million yen) | FY2025 Results | FY2026 Forecast | YoY |
|---|---|---|---|
| Net sales | 65,878 | 69,000 | +4.7% |
| Gross profit | 34,291 (52.1%) | 36,515 (52.9%) | +6.5% |
| SG&A | 26,137 (39.7%) | 27,715 (40.2%) | +6.0% |
| Operating profit | 8,153 (12.4%) | 8,800 (12.8%) | +7.9% |
| Ordinary profit | 8,000 (12.1%) | 8,800 (12.8%) | +10.0% |
| Profit attributable to owners of parent | 6,595 (10.0%) | 6,600 (9.6%) | +0.1% |
| Basic earnings per share (yen) | 185.16 | 185.30 | – |
Shareholder Returns
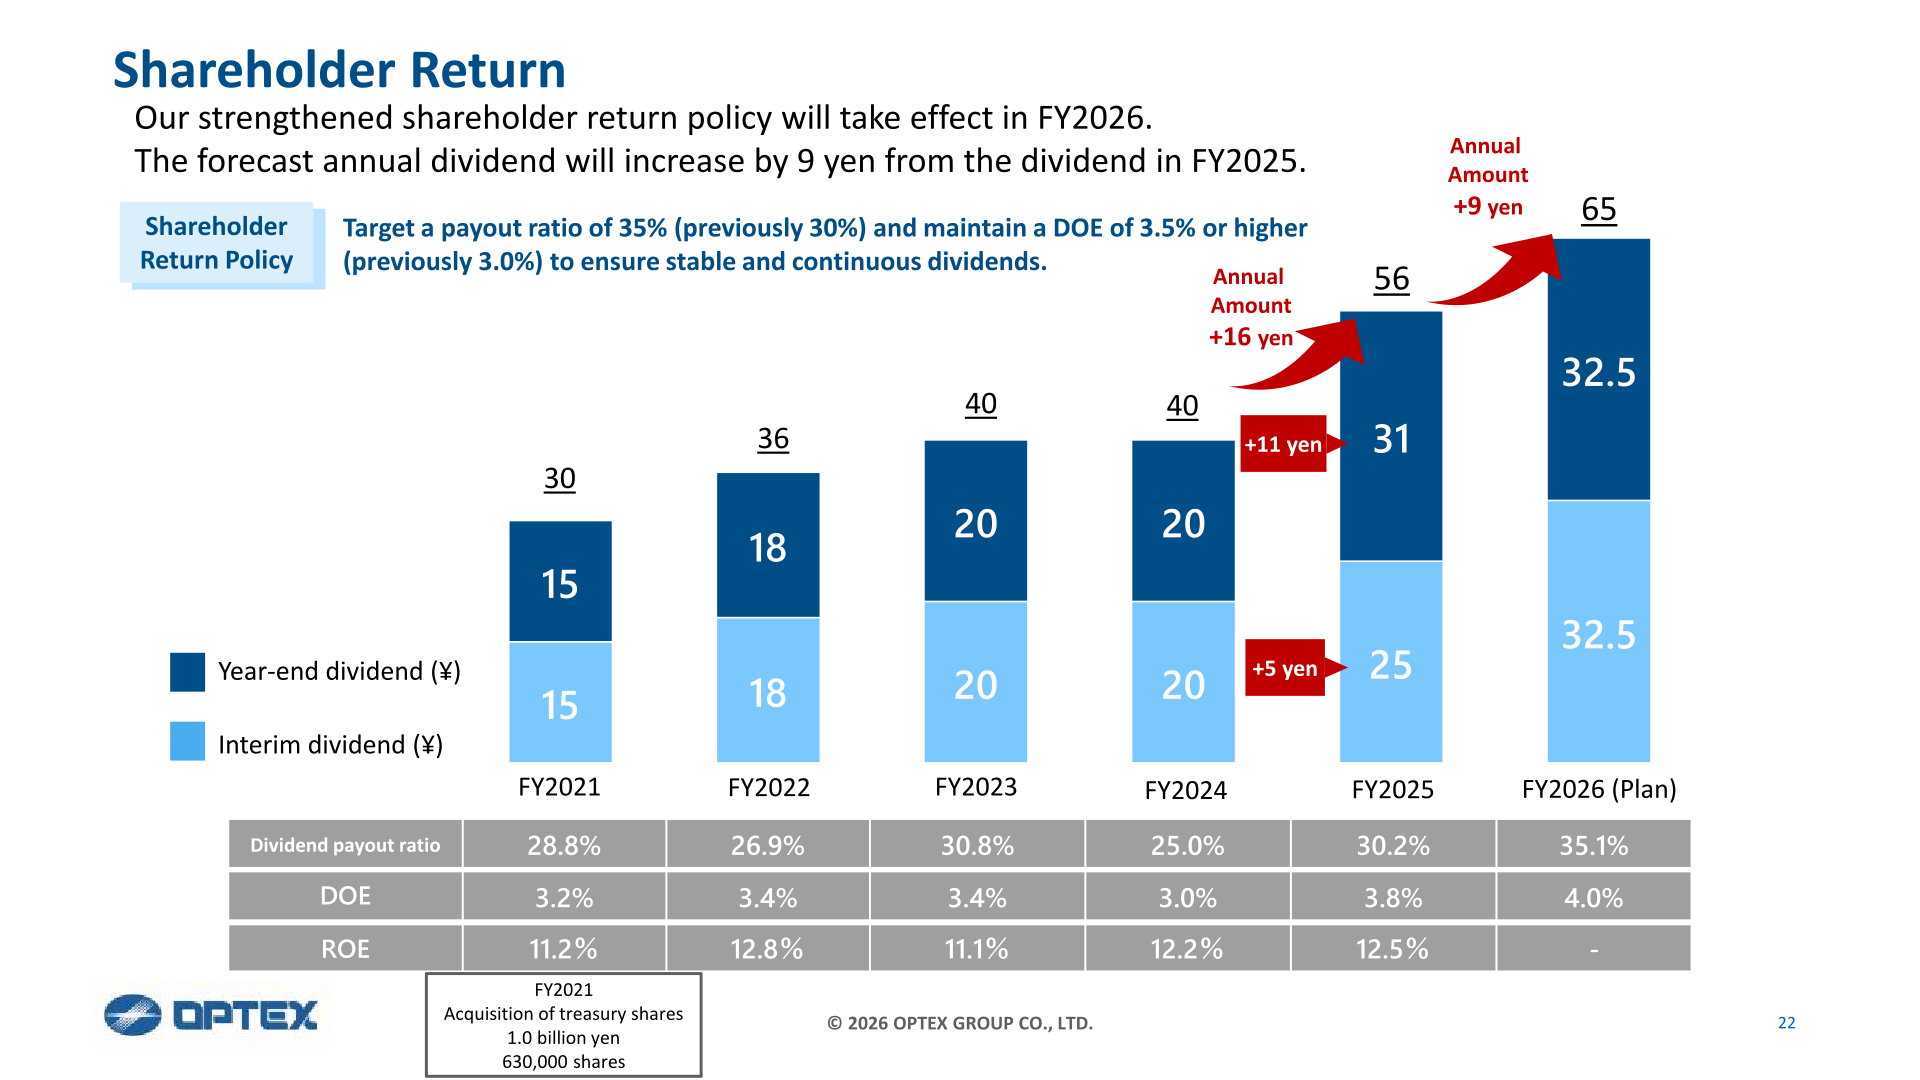
The FY2025 annual dividend was 56 yen per share (interim 25 yen, year-end 31 yen), an increase of 16 yen from FY2024, for a dividend payout ratio of 30.2% and a DOE of 3.8%. A strengthened shareholder return policy takes effect in FY2026: the company targets a payout ratio of 35% (previously 30%) and will maintain a DOE of 3.5% or higher (previously 3.0%) to ensure stable and continuous dividends. The forecast FY2026 annual dividend is 65 yen per share (interim 32.5 yen, year-end 32.5 yen), up 9 yen from FY2025, corresponding to a payout ratio of 35.1% and a DOE of 4.0%. ROE was 12.5% in FY2025.
| Item | FY2024 | FY2025 | FY2026 (Plan) |
|---|---|---|---|
| Interim dividend (yen) | 20 | 25 | 32.5 |
| Year-end dividend (yen) | 20 | 31 | 32.5 |
| Annual dividend (yen) | 40 | 56 | 65 |
| Dividend payout ratio | 25.0% | 30.2% | 35.1% |
| DOE | 3.0% | 3.8% | 4.0% |
| ROE | 12.2% | 12.5% | – |
Three-Year Management Plan (FY2026-FY2028)
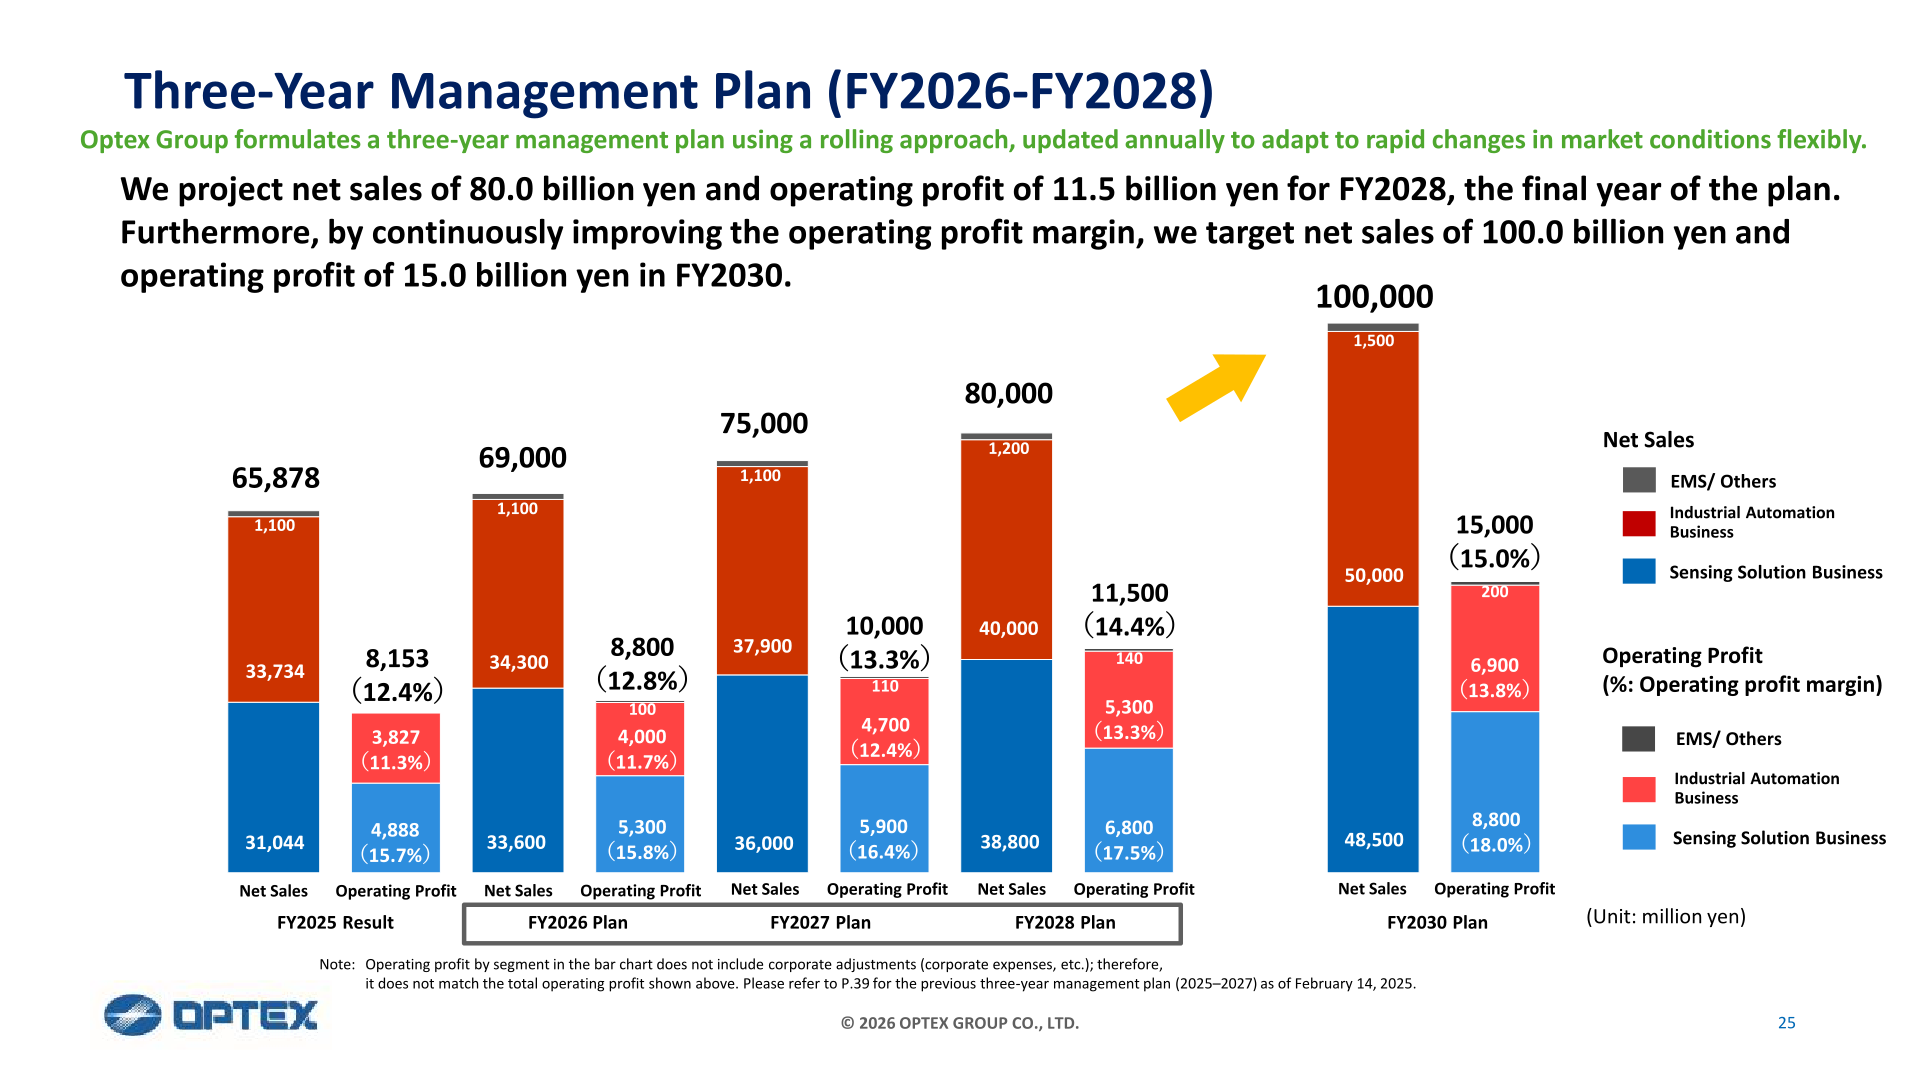
OPTEX Group formulates a three-year management plan using a rolling approach, updated annually. Under the new plan, the company projects net sales of 80.0 billion yen and operating profit of 11.5 billion yen (operating profit margin 14.4%) for FY2028, the final year. By continuously improving the operating profit margin, it targets net sales of 100.0 billion yen and operating profit of 15.0 billion yen (margin 15.0%) in FY2030, together with a stable ROE of 15%. The plan centers on business portfolio management: management resources will be allocated to high-growth, high-profit Core Businesses, while Problematic Businesses will be thoroughly reviewed by FY2028, without exception, including potential downsizing or withdrawal. The company also aims to raise the sales ratio of its solution-oriented business from 24% of consolidated net sales in FY2025 to 31% by FY2028 and 35% by FY2030. On capital allocation, based on three-year operating cash flow of 28 billion yen and FY2025 net cash of 22 billion yen, the company plans approximately 15.0 billion yen for M&A and strategic alliances and approximately 14.0 billion yen for IT/digital transformation investment, with shareholder returns of 9 billion yen.
| Item (million yen) | FY2025 Result | FY2026 Plan | FY2027 Plan | FY2028 Plan | FY2030 Plan |
|---|---|---|---|---|---|
| Net sales | 65,878 | 69,000 | 75,000 | 80,000 | 100,000 |
| Operating profit | 8,153 (12.4%) | 8,800 (12.8%) | 10,000 (13.3%) | 11,500 (14.4%) | 15,000 (15.0%) |
This article is an analysis based on publicly available information and is not a recommendation to buy or sell any specific securities. Investment decisions are your own responsibility.
![[Obayashi] Investors’ Guide 2026 — The Complete 24-Article Breakdown](https://japan-equity.com/wp-content/uploads/2026/07/hub_cover-1024x1024.png)
![[Obayashi] IR & SR Policy — Feeding Dialogue Back into Management](https://japan-equity.com/wp-content/uploads/2026/07/p32_sq-1024x1024.jpg)
![[Obayashi] Real Estate Development — 18.7% Margin, ¥287.7bn Unrealized Gains](https://japan-equity.com/wp-content/uploads/2026/07/p20_sq-1024x1024.jpg)
![[Obayashi] Domestic Civil Engineering — Resilience Spending Supports 9.6% Margin](https://japan-equity.com/wp-content/uploads/2026/07/p11_sq-1024x1024.jpg)
![[Obayashi] Share Price & External Ratings — vs TOPIX, ESG Index Inclusion](https://japan-equity.com/wp-content/uploads/2026/07/p40_sq-1024x1024.jpg)
![[Construction] ¥75.5tn Investment, Shrinking Workforce — Big-5 Market Share](https://japan-equity.com/wp-content/uploads/2026/07/p12_sq-1024x1024.jpg)



![[Obayashi] Capital Policy & Shareholder Returns — ROE 10%+, DOE ~5%, ¥100bn Buyback](https://japan-equity.com/wp-content/uploads/2026/07/p27_sq-1024x1024.jpg)
![[Obayashi] Reducing Cross-Shareholdings — ¥285.2bn Sold in Five Years](https://japan-equity.com/wp-content/uploads/2026/07/p29_sq-1024x1024.jpg)
![[Obayashi] ¥750bn Investment Plan — ¥300bn to Development, ¥190bn to Tech/DX](https://japan-equity.com/wp-content/uploads/2026/07/p30_sq-1024x1024.jpg)
![[Obayashi] MTP2022 KPIs — Operating Profit ~2x Target, ROE 14.4%](https://japan-equity.com/wp-content/uploads/2026/07/p25_sq-1024x1024.jpg)
![[Obayashi] Cash Allocation — ¥420bn Investment CF Over Five Years](https://japan-equity.com/wp-content/uploads/2026/07/p26_sq-1024x1024.jpg)
![[Obayashi] Green Energy — 44 Plants, 344MW, and the Green Hydrogen Challenge](https://japan-equity.com/wp-content/uploads/2026/07/p21_sq-1024x1024.jpg)
![[Obayashi] Tackling the Labor Shortage — Robotics Construction®](https://japan-equity.com/wp-content/uploads/2026/07/p14_sq-1024x1024.jpg)
