
This article is based on publicly available IR materials and is not a recommendation to buy or sell any specific securities.
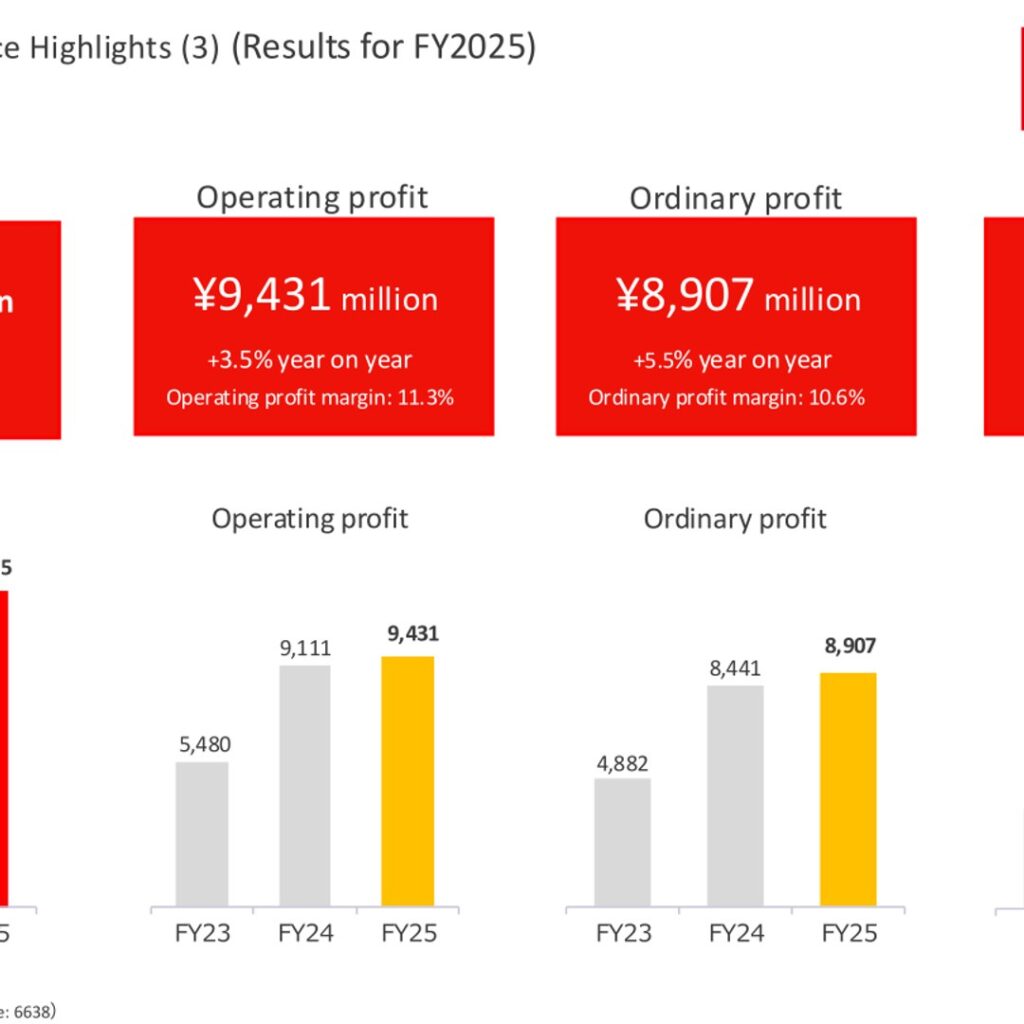
Mimaki Engineering (Securities Code: 6638, TSE Prime Market) released its presentation materials for FY2025 financial results on May 27, 2026. In the company’s materials, FY2025 refers to the fiscal year for which the balance sheet date is March 31, 2026, and that labeling is used throughout this article. Net sales came to 83,725 million yen, down 0.3% year on year but above the previous forecast, while operating profit rose 3.5% to 9,431 million yen, a record high. For FY2026, the company forecasts net sales of 91,000 million yen, up 8.7%, and plans an annual dividend of 55 yen per share, up 5 yen from the ordinary dividend for the previous fiscal year.
Consolidated Results (Full-Year Actual)
Net sales declined 238 million yen year on year (-0.3%, including a +880 million yen impact from exchange rates), exceeding the previous forecast of 82,500 million yen by 1,225 million yen. Excluding foreign exchange effects, sales decreased 1.3%. Operating profit increased 319 million yen (+3.5%, including a +539 million yen impact from exchange rates), with the operating profit margin at 11.3%. The company states that profitability improved after continued activities to reduce costs and a change in the product mix, and that operating profit hit a record high. Profit attributable to owners of parent rose 9.5% to 6,741 million yen.
| Item (millions of yen) | FY2025 | FY2024 | Change |
|---|---|---|---|
| Net sales | 83,725 | 83,963 | -238 (-0.3%) |
| Operating profit | 9,431 | 9,111 | +319 (+3.5%) |
| Ordinary profit | 8,907 | 8,441 | +465 (+5.5%) |
| Profit attributable to owners of parent | 6,741 | 6,156 | +585 (+9.5%) |
Average exchange rates were 150.78 yen for the U.S. dollar (FY2024: 152.57 yen) and 174.79 yen for the euro (FY2024: 163.74 yen). On the balance sheet, inventories increased to 27,692 million yen from 24,863 million yen a year earlier, and the cash conversion cycle (CCC), a key indicator, stood at 4.67 months at the end of March 2026. Cash flows from operating activities were 4,622 million yen and free cash flows were -766 million yen.
Segment Results
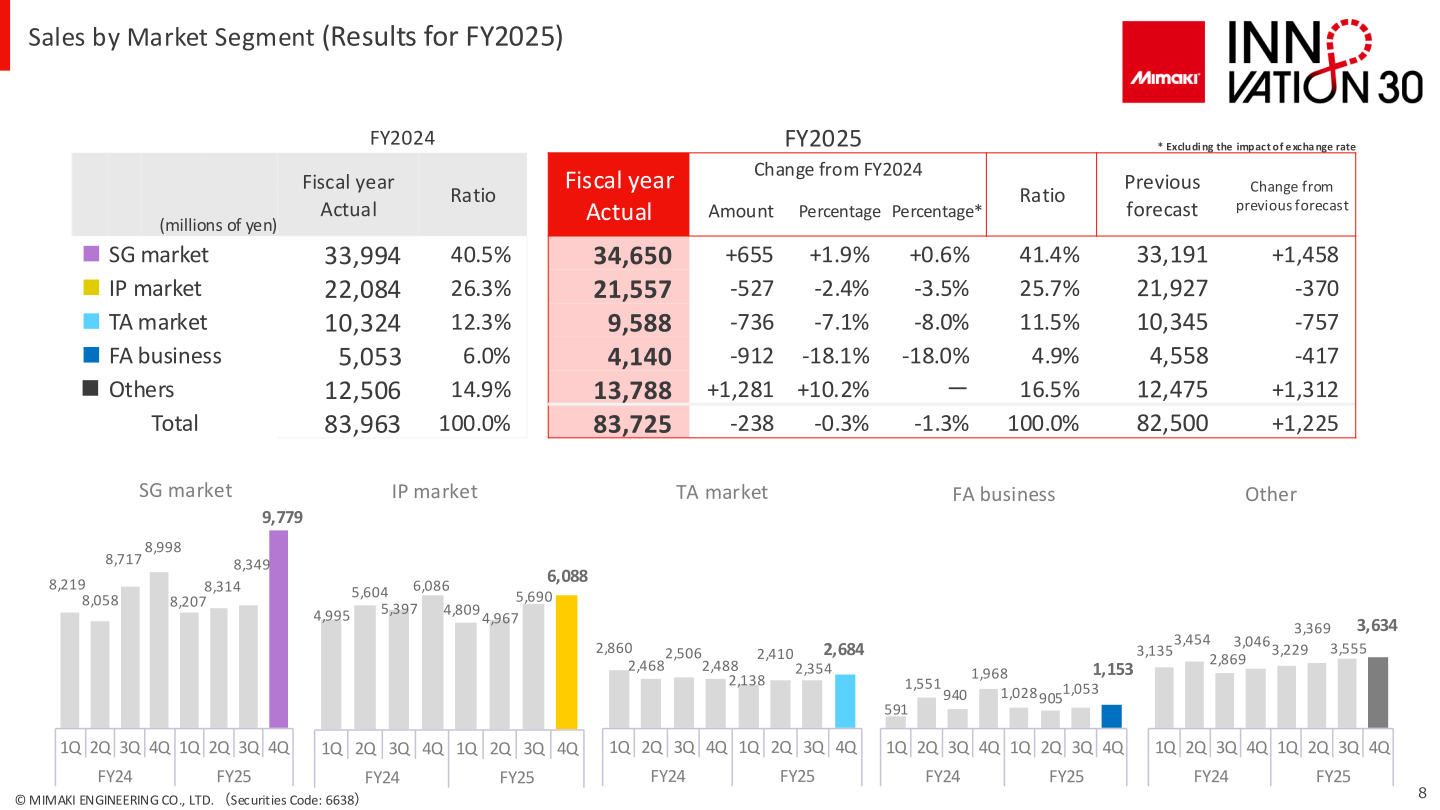
Mimaki discloses sales by product market: SG (Sign Graphics), IP (Industrial Products), TA (Textile & Apparel), and the FA (Factory Automation) business. In the SG market, sales rose slightly, with strong sales of new eco-solvent models throughout the fiscal year and firm ink sales, while existing UV models made poor sales. IP market sales decreased, as thriving ink sales and a second-half recovery in small FB (flatbed) sales failed to make up for a weak first half caused by the lull between new product releases. In the TA market, main unit sales were stagnant due to a slide in sales of DTF (Direct To Film) models despite healthy ink sales. FA business sales dropped sharply on lower sales of FA equipment for the automotive industry.
| Market segment | FY2025 (millions of yen) | FY2024 (millions of yen) | Change |
|---|---|---|---|
| SG market | 34,650 | 33,994 | +655 (+1.9%) |
| IP market | 21,557 | 22,084 | -527 (-2.4%) |
| TA market | 9,588 | 10,324 | -736 (-7.1%) |
| FA business | 4,140 | 5,053 | -912 (-18.1%) |
| Others | 13,788 | 12,506 | +1,281 (+10.2%) |
| Total | 83,725 | 83,963 | -238 (-0.3%) |
By area, sales in Japan were 22,319 million yen (-2.5% year on year), North America 18,095 million yen (+2.1%), Europe 19,403 million yen (+0.4%), Asia and Oceania 14,748 million yen (-1.9%), and Others 9,159 million yen (+1.8%). In local currency, North America sales were $119.9M (+3.1%) and Europe sales were €110.6M (-6.3%).
FY2026 Forecast
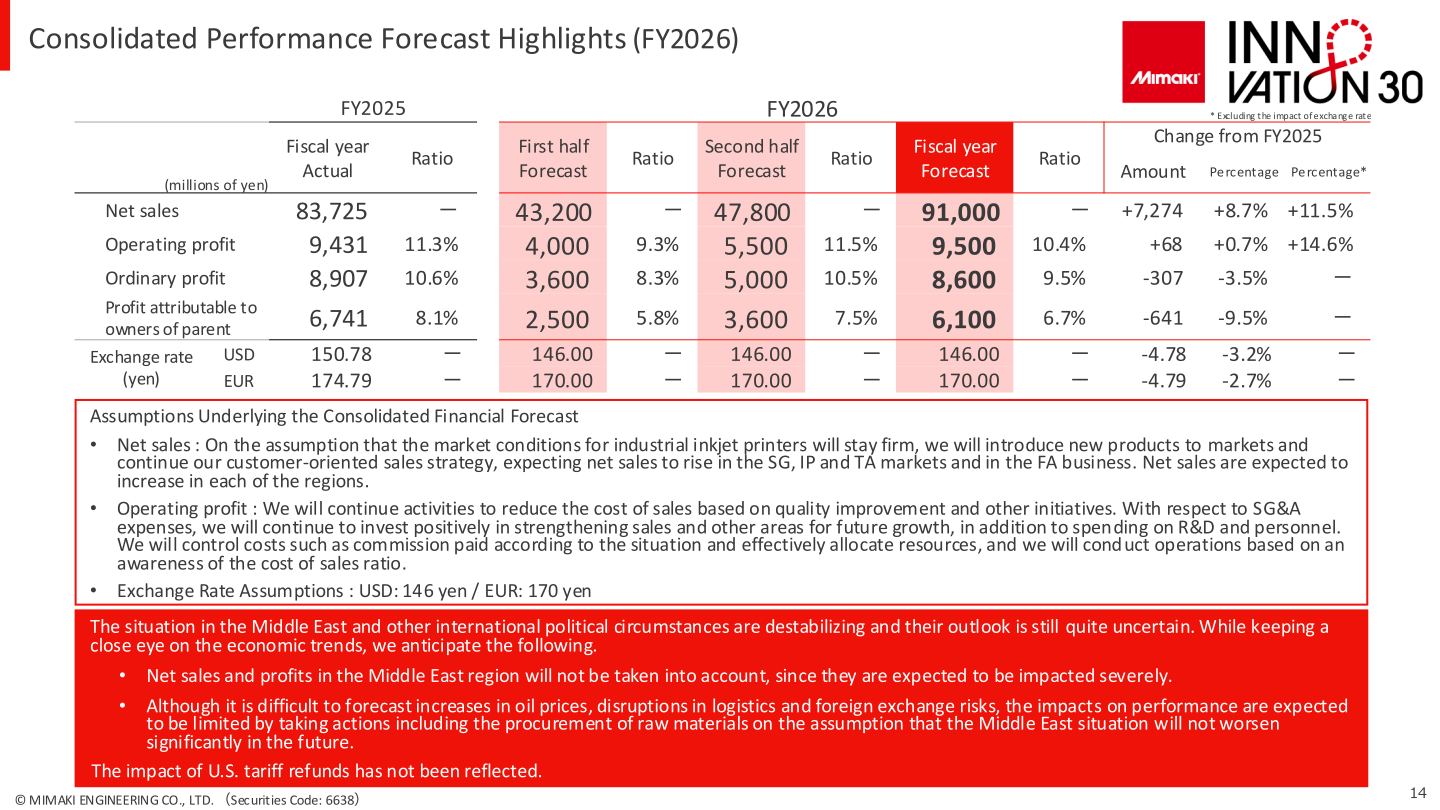
For FY2026, the company forecasts net sales of 91,000 million yen (+8.7% year on year) and operating profit of 9,500 million yen (+0.7%). On the assumption that market conditions for industrial inkjet printers will stay firm, it expects net sales to rise in the SG, IP and TA markets and in the FA business, and to increase in each of the regions. The company notes that net sales and profits in the Middle East region are not taken into account in the forecast, since they are expected to be impacted severely by the destabilizing international political circumstances, and that the impact of U.S. tariff refunds has not been reflected. Exchange rate assumptions are 146 yen per U.S. dollar and 170 yen per euro.
| Item (millions of yen) | FY2026 Forecast | FY2025 Actual | Change |
|---|---|---|---|
| Net sales | 91,000 | 83,725 | +7,274 (+8.7%) |
| Operating profit | 9,500 | 9,431 | +68 (+0.7%) |
| Ordinary profit | 8,600 | 8,907 | -307 (-3.5%) |
| Profit attributable to owners of parent | 6,100 | 6,741 | -641 (-9.5%) |
By market segment, the FY2026 sales forecast is 37,137 million yen for the SG market (+7.2%), 24,922 million yen for the IP market (+15.6%), 11,465 million yen for the TA market (+19.6%), 4,821 million yen for the FA business (+16.4%), and 12,652 million yen for Others (-8.2%). The company also forecasts capital expenditure of 5,800 million yen and R&D investment of 7,600 million yen for FY2026.
Shareholder Returns
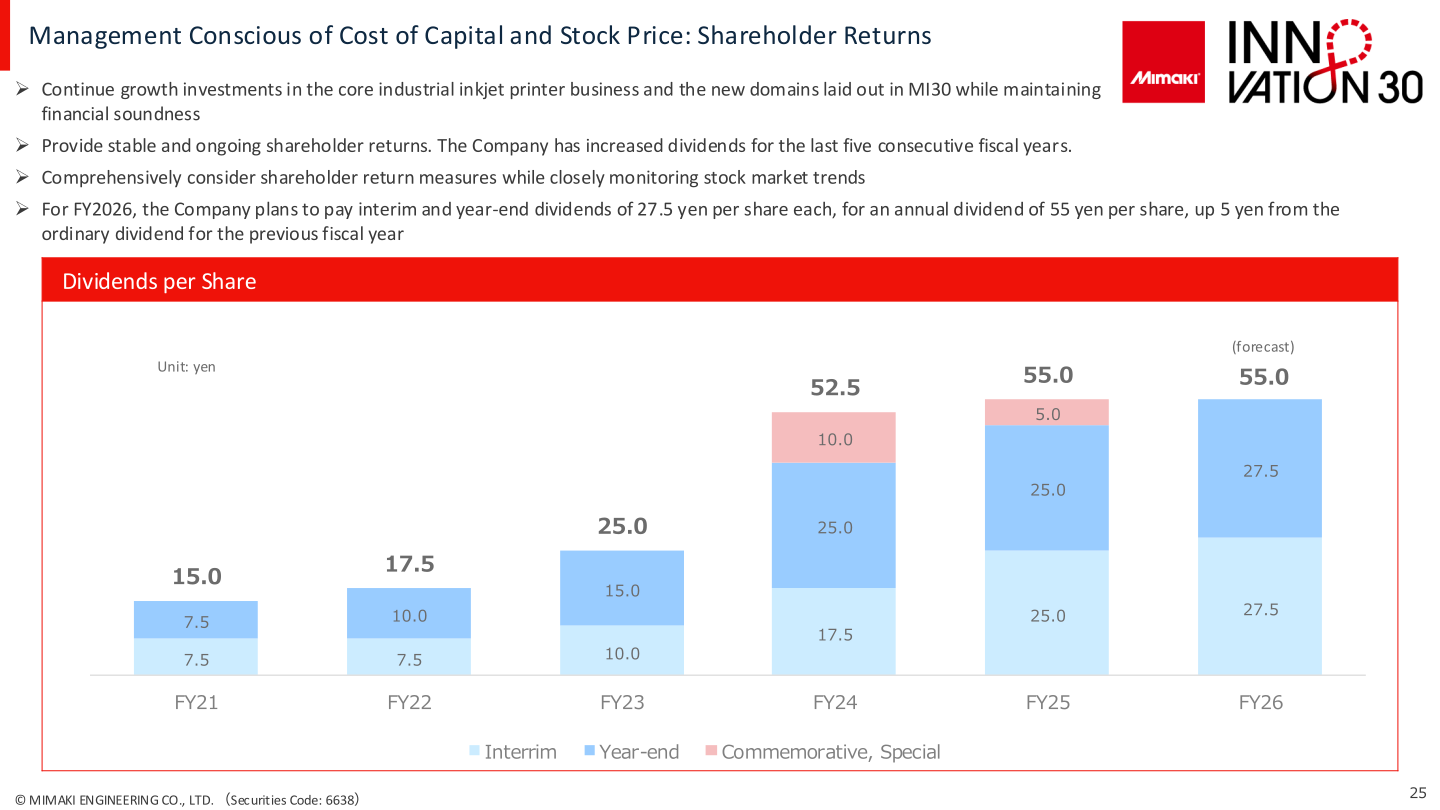
For FY2025, the company paid an interim dividend of 25.0 yen and a year-end dividend of 30.0 yen (including a commemorative dividend of 5.0 yen), raising the annual dividend to 55.0 yen including the commemorative dividend. For FY2026, it plans to pay interim and year-end dividends of 27.5 yen per share each, for an annual dividend of 55 yen per share, up 5 yen from the ordinary dividend for the previous fiscal year. The company states that it has increased dividends for the last five consecutive fiscal years, and that its basic policy is to stably and continuously pay out dividends commensurate with growth in business performance.
| Item | FY2025 (Actual) | FY2026 (Forecast) |
|---|---|---|
| Interim dividend | 25.0 yen | 27.5 yen |
| Year-end dividend | 30.0 yen (incl. commemorative dividend of 5.0 yen) | 27.5 yen |
| Annual dividend | 55.0 yen | 55.0 yen |
Medium-Term Plan / Capital Policy
The medium- to long-term growth strategy Mimaki Innovation 30 (MI30), announced in May 2025, aims to achieve net sales of 150 billion yen and an operating profit margin of 8% or higher by 2030 while continuously improving ROE, targeting a net sales CAGR of 10%. The company plans to continue investing 7% of net sales in R&D each fiscal year, with additional investments equivalent to 1-2% of net sales during the five-year MI30 period from FY2025 to FY2029.
In its analysis of management conscious of the cost of capital and stock price, the company notes that as of March 31, 2026, PBR stood at 1.14 times, PER at 6.71 times, and ROE at 18.7%, with ROE remaining above the cost of shareholders’ equity of 11.11%. ROIC of 12.98% also exceeded WACC of 7.1%. The company states that PER remains below 10, significantly lower than the Prime Market weighted average of 19.2 as of March 2026, indicating that it continues to be undervalued by the market.
This article is an analysis based on publicly available information and is not a recommendation to buy or sell any specific securities. Investment decisions are your own responsibility.
![[Obayashi] Investors’ Guide 2026 — The Complete 24-Article Breakdown](https://japan-equity.com/wp-content/uploads/2026/07/hub_cover-1024x1024.png)
![[Obayashi] IR & SR Policy — Feeding Dialogue Back into Management](https://japan-equity.com/wp-content/uploads/2026/07/p32_sq-1024x1024.jpg)
![[Obayashi] Domestic Civil Engineering — Resilience Spending Supports 9.6% Margin](https://japan-equity.com/wp-content/uploads/2026/07/p11_sq-1024x1024.jpg)
![[Obayashi] Overseas Construction — Orders Reach ¥1.2tn](https://japan-equity.com/wp-content/uploads/2026/07/p15_sq-1024x1024.jpg)
![[Obayashi] Share Price & External Ratings — vs TOPIX, ESG Index Inclusion](https://japan-equity.com/wp-content/uploads/2026/07/p40_sq-1024x1024.jpg)
![[Construction] ¥75.5tn Investment, Shrinking Workforce — Big-5 Market Share](https://japan-equity.com/wp-content/uploads/2026/07/p12_sq-1024x1024.jpg)



![[Obayashi] Capital Policy & Shareholder Returns — ROE 10%+, DOE ~5%, ¥100bn Buyback](https://japan-equity.com/wp-content/uploads/2026/07/p27_sq-1024x1024.jpg)
![[Obayashi] Reducing Cross-Shareholdings — ¥285.2bn Sold in Five Years](https://japan-equity.com/wp-content/uploads/2026/07/p29_sq-1024x1024.jpg)
![[Obayashi] ¥750bn Investment Plan — ¥300bn to Development, ¥190bn to Tech/DX](https://japan-equity.com/wp-content/uploads/2026/07/p30_sq-1024x1024.jpg)
![[Obayashi] MTP2022 KPIs — Operating Profit ~2x Target, ROE 14.4%](https://japan-equity.com/wp-content/uploads/2026/07/p25_sq-1024x1024.jpg)
![[Obayashi] Cash Allocation — ¥420bn Investment CF Over Five Years](https://japan-equity.com/wp-content/uploads/2026/07/p26_sq-1024x1024.jpg)
![[Obayashi] Green Energy — 44 Plants, 344MW, and the Green Hydrogen Challenge](https://japan-equity.com/wp-content/uploads/2026/07/p21_sq-1024x1024.jpg)
![[Obayashi] Tackling the Labor Shortage — Robotics Construction®](https://japan-equity.com/wp-content/uploads/2026/07/p14_sq-1024x1024.jpg)
