
This article is based on publicly available IR materials and is not a recommendation to buy or sell any specific securities.
Note: Taiho Kogyo’s materials label the fiscal year from April 1, 2025 to March 31, 2026 as “FY2026”; in line with this site’s convention, the title of this article refers to the most recently completed fiscal year as FY2025, while the body and tables follow the labels used in the materials.
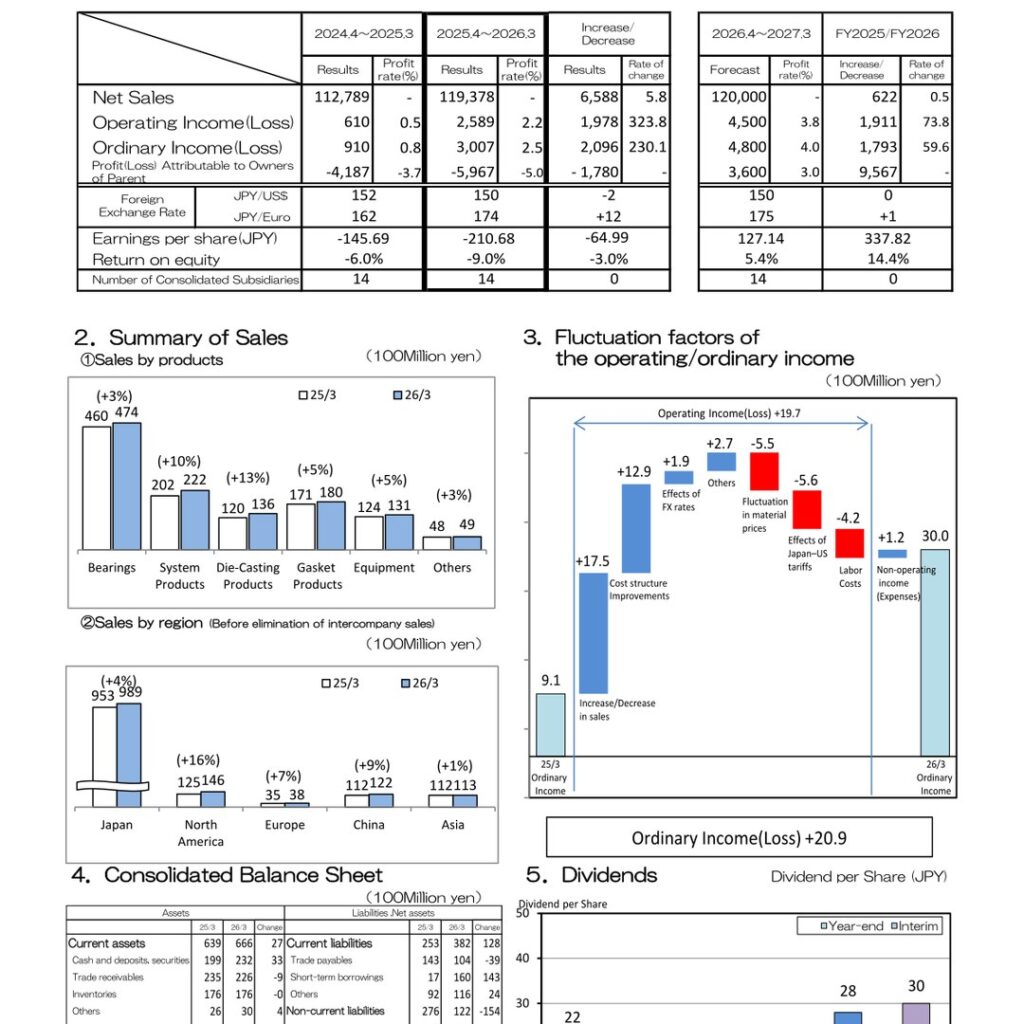
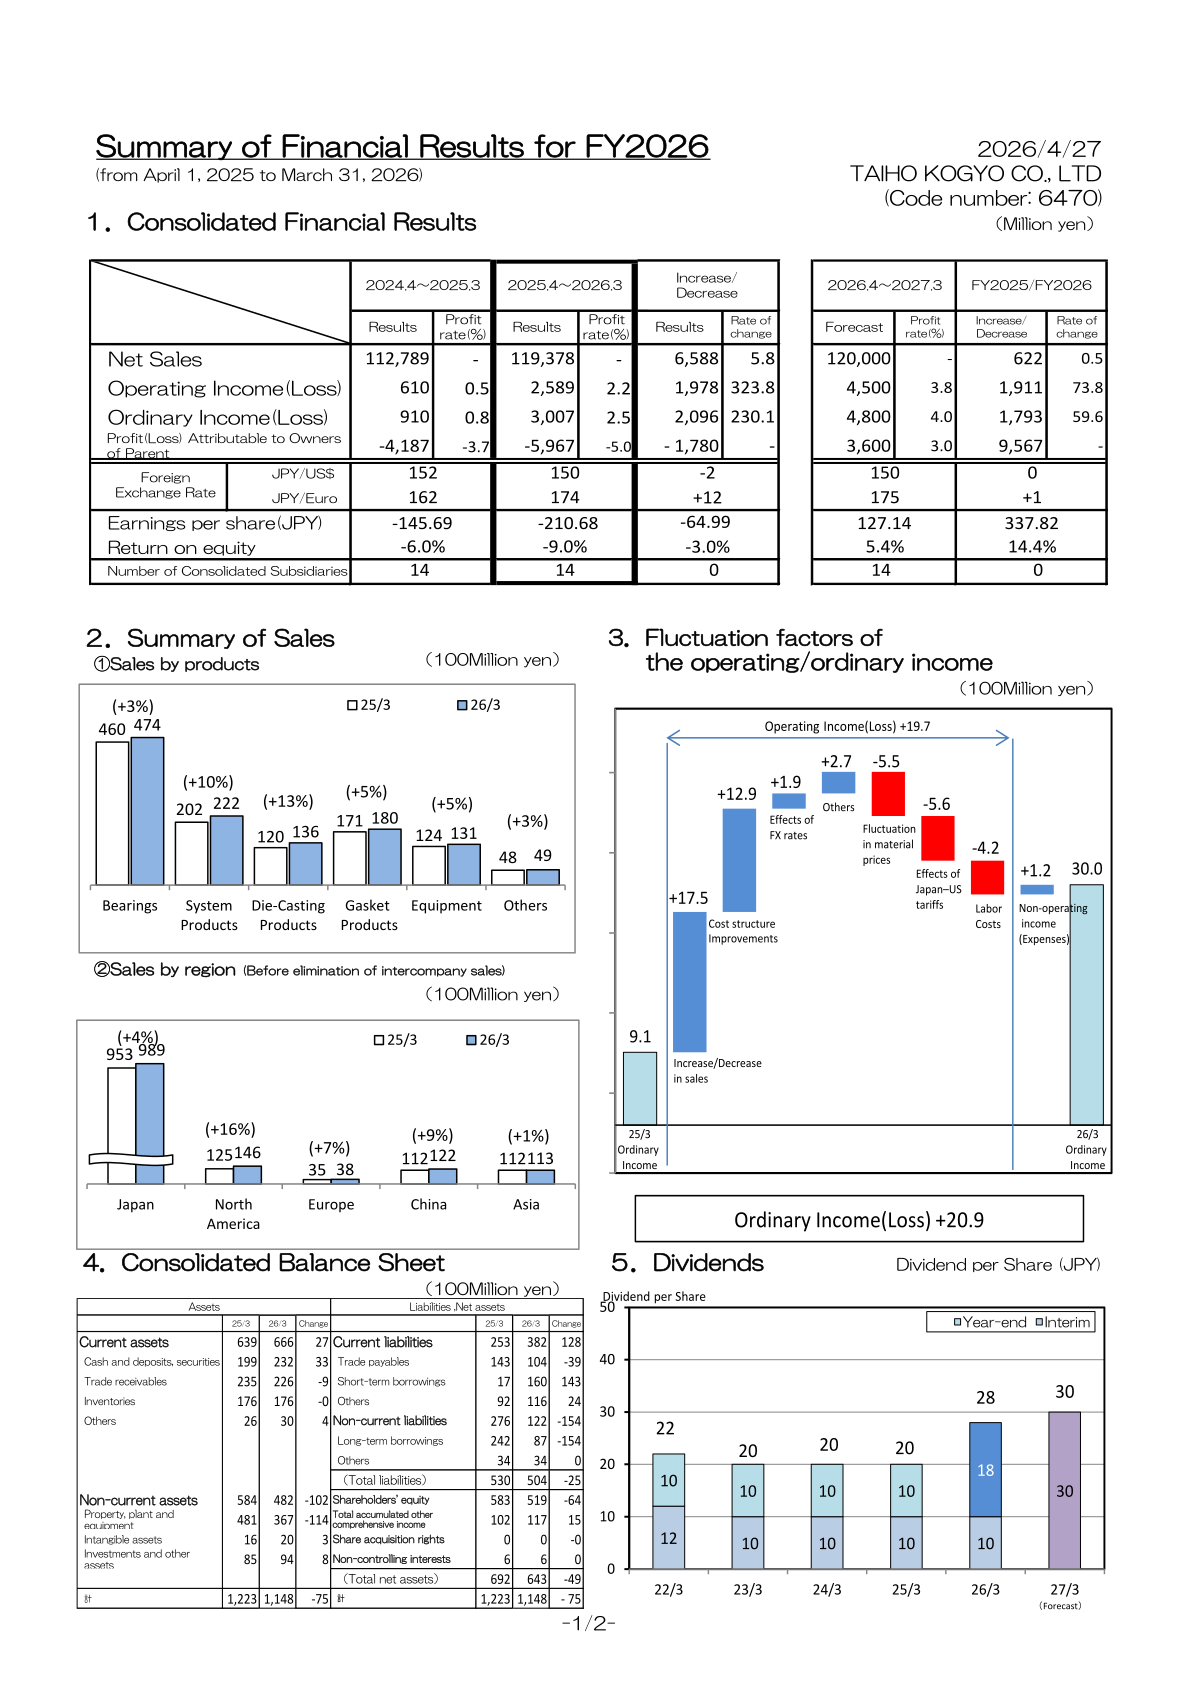
TAIHO KOGYO CO., LTD (Code number: 6470) released its “Summary of Financial Results for FY2026” on April 27, 2026, covering the fiscal year from April 1, 2025 to March 31, 2026. Net sales came to 119,378 million yen, up 6,588 million yen (5.8%) from the prior year, and operating income rose to 2,589 million yen (profit rate 2.2%) from 610 million yen (0.5%), a rate of change of 323.8%. Ordinary income increased to 3,007 million yen (2.5%) from 910 million yen (0.8%), up 230.1%. On the other hand, the loss attributable to owners of parent widened to -5,967 million yen (profit rate -5.0%) from -4,187 million yen (-3.7%) in the prior year, a change of -1,780 million yen.
Consolidated Results (Full-Year Actual)
The average foreign exchange rates for the year were 150 JPY/US$ (down 2 yen from 152) and 174 JPY/Euro (up 12 yen from 162). Earnings per share were -210.68 yen, versus -145.69 yen in the prior year (a change of -64.99 yen), and return on equity was -9.0%, versus -6.0% (a change of -3.0%). The number of consolidated subsidiaries was unchanged at 14.
| Item | 2024.4–2025.3 Results | 2025.4–2026.3 Results | Increase/Decrease | Rate of change (%) |
|---|---|---|---|---|
| Net Sales (Million yen) | 112,789 | 119,378 | 6,588 | 5.8 |
| Operating Income (Loss) (Million yen) | 610 | 2,589 | 1,978 | 323.8 |
| Ordinary Income (Loss) (Million yen) | 910 | 3,007 | 2,096 | 230.1 |
| Profit (Loss) Attributable to Owners of Parent (Million yen) | -4,187 | -5,967 | -1,780 | – |
| Earnings per Share (JPY) | -145.69 | -210.68 | -64.99 | – |
| Return on Equity | -6.0% | -9.0% | -3.0% | – |
A bridge chart of ordinary income (in units of 100 million yen) shows the increase from 9.1 in the year ended March 2025 to 30.0 in the year ended March 2026. Positive factors were increase/decrease in sales (+17.5), cost structure improvements (+12.9), effects of FX rates (+1.9), others (+2.7) and non-operating income (expenses) (+1.2), while negative factors were fluctuation in material prices (-5.5), effects of Japan–US tariffs (-5.6) and labor costs (-4.2). The chart shows operating income (loss) up +19.7 and ordinary income (loss) up +20.9.
Sales by Product and Region
By product (in units of 100 million yen), all categories increased year on year: Bearings 474 (+3%), System Products 222 (+10%), Die-Casting Products 136 (+13%), Gasket Products 180 (+5%), Equipment 131 (+5%) and Others 49 (+3%).
| Product | 25/3 (100 Million yen) | 26/3 (100 Million yen) | YoY |
|---|---|---|---|
| Bearings | 460 | 474 | +3% |
| System Products | 202 | 222 | +10% |
| Die-Casting Products | 120 | 136 | +13% |
| Gasket Products | 171 | 180 | +5% |
| Equipment | 124 | 131 | +5% |
| Others | 48 | 49 | +3% |
By region (before elimination of intercompany sales, in units of 100 million yen), sales were: Japan 989 (+4%), North America 146 (+16%), Europe 38 (+7%), China 122 (+9%) and Asia 113 (+1%), versus 953, 125, 35, 112 and 112 respectively in the prior year.
Segment Results
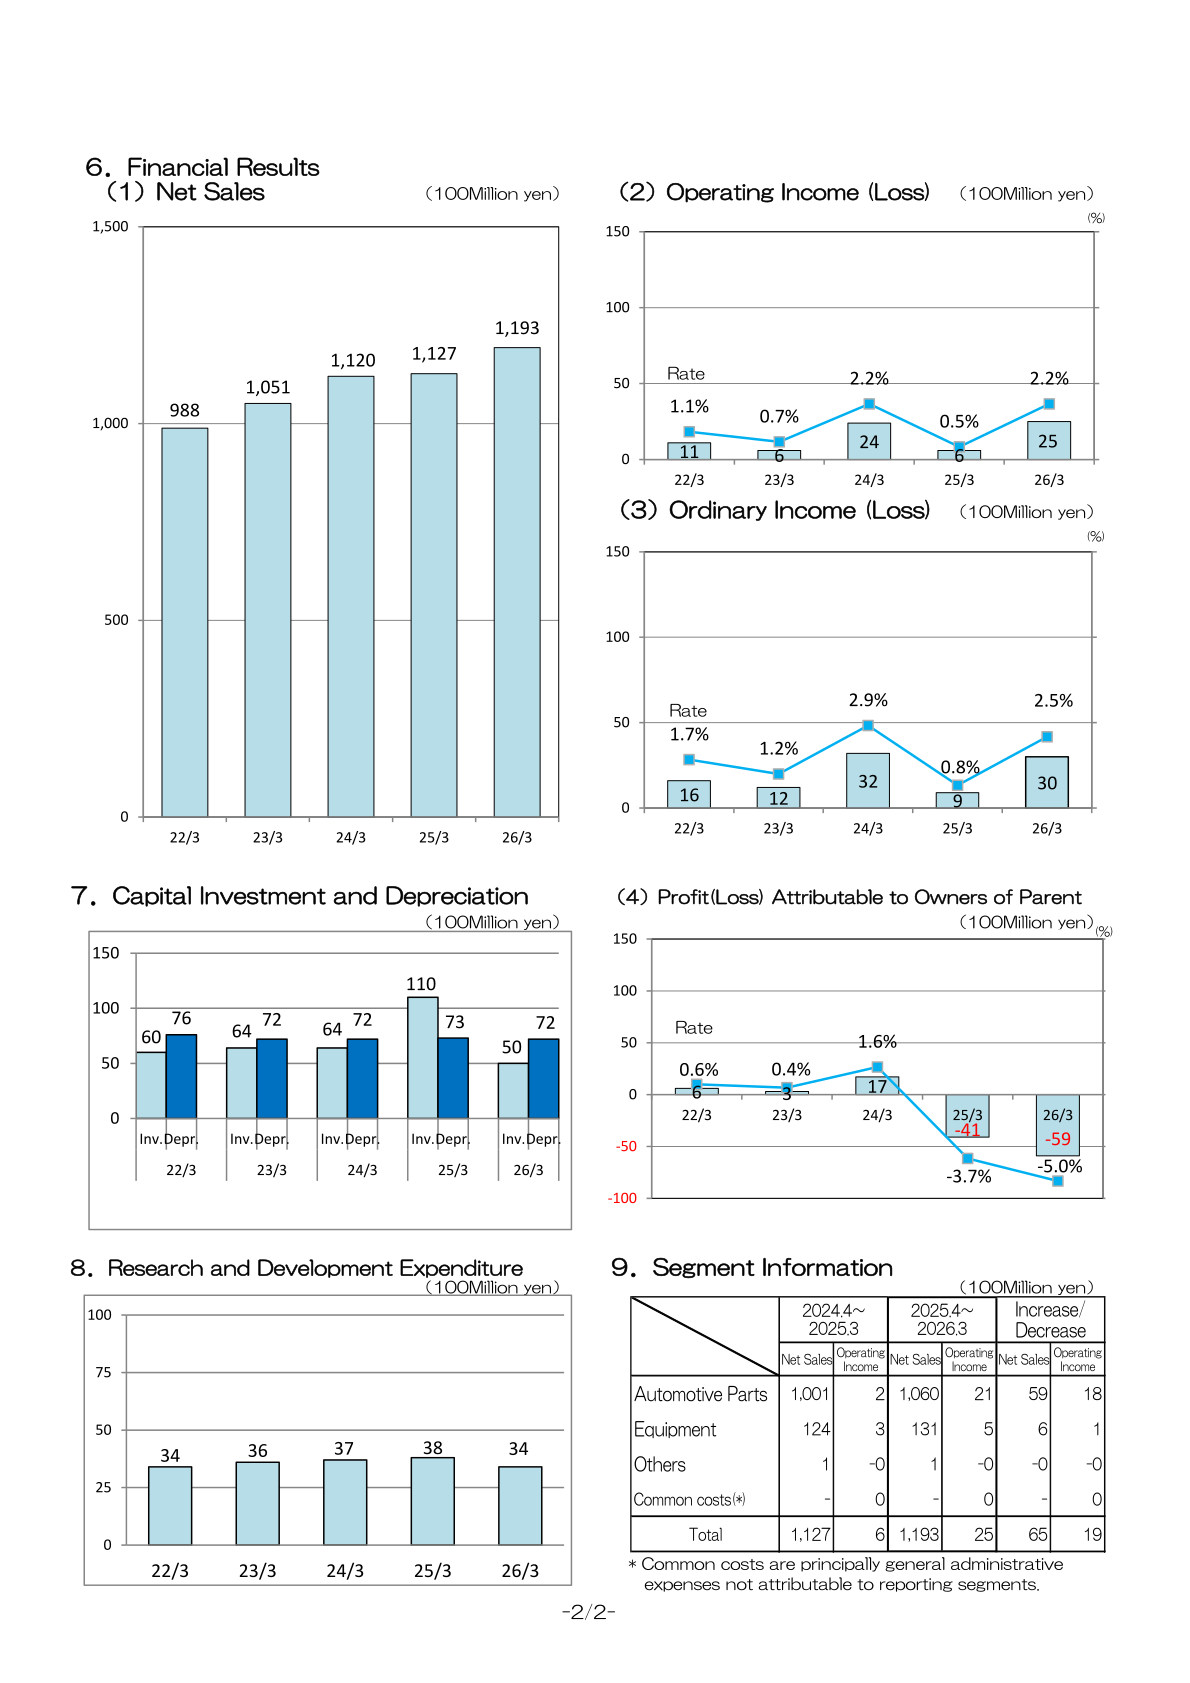
By reporting segment (in units of 100 million yen), Automotive Parts recorded net sales of 1,060 (up 59) and operating income of 21 (up 18), while Equipment recorded net sales of 131 (up 6) and operating income of 5 (up 1). The materials note that common costs are principally general administrative expenses not attributable to reporting segments.
| Segment | Net Sales 2024.4–2025.3 | Operating Income 2024.4–2025.3 | Net Sales 2025.4–2026.3 | Operating Income 2025.4–2026.3 |
|---|---|---|---|---|
| Automotive Parts | 1,001 | 2 | 1,060 | 21 |
| Equipment | 124 | 3 | 131 | 5 |
| Others | 1 | -0 | 1 | -0 |
| Common costs (*) | – | 0 | – | 0 |
| Total | 1,127 | 6 | 1,193 | 25 |
Full-Year Forecast (April 2026–March 2027)
For the fiscal year from April 2026 to March 2027, the company forecasts net sales of 120,000 million yen (up 622 million yen, 0.5%), operating income of 4,500 million yen (profit rate 3.8%, up 1,911 million yen, 73.8%), ordinary income of 4,800 million yen (4.0%, up 1,793 million yen, 59.6%) and profit attributable to owners of parent of 3,600 million yen (3.0%, up 9,567 million yen), a return to profit. Assumed exchange rates are 150 JPY/US$ and 175 JPY/Euro. Forecast earnings per share are 127.14 yen and forecast return on equity is 5.4%.
| Item | 2026.4–2027.3 Forecast | Profit rate (%) | Increase/Decrease | Rate of change (%) |
|---|---|---|---|---|
| Net Sales (Million yen) | 120,000 | – | 622 | 0.5 |
| Operating Income (Loss) (Million yen) | 4,500 | 3.8 | 1,911 | 73.8 |
| Ordinary Income (Loss) (Million yen) | 4,800 | 4.0 | 1,793 | 59.6 |
| Profit (Loss) Attributable to Owners of Parent (Million yen) | 3,600 | 3.0 | 9,567 | – |
Shareholder Returns
The annual dividend per share for the year ended March 2026 was 28 yen, consisting of an interim dividend of 10 yen and a year-end dividend of 18 yen, up from 20 yen (10 yen interim, 10 yen year-end) in each of the three preceding years (23/3, 24/3 and 25/3); the dividend for 22/3 was 22 yen (12 yen interim, 10 yen year-end). For the fiscal year ending March 2027, the materials show a forecast annual dividend of 30 yen per share, with no breakdown between interim and year-end shown.
Financial Position, Capital Investment and R&D
Total assets at March 31, 2026 were 1,148 (100 million yen), down 75 from 1,223 a year earlier. Cash and deposits and securities increased by 33 to 232, while property, plant and equipment decreased by 114 to 367. Short-term borrowings increased by 143 to 160 and long-term borrowings decreased by 154 to 87; total liabilities fell by 25 to 504. Total net assets decreased by 49 to 643, with shareholders’ equity down 64 to 519. Capital investment for the year was 50 (100 million yen, versus 110 in the prior year) and depreciation was 72 (versus 73). Research and development expenditure was 34 (versus 38).
This article is an analysis based on publicly available information and is not a recommendation to buy or sell any specific securities. Investment decisions are your own responsibility.
![[Obayashi] Investors’ Guide 2026 — The Complete 24-Article Breakdown](https://japan-equity.com/wp-content/uploads/2026/07/hub_cover-1024x1024.png)
![[Obayashi] IR & SR Policy — Feeding Dialogue Back into Management](https://japan-equity.com/wp-content/uploads/2026/07/p32_sq-1024x1024.jpg)
![[Obayashi] Real Estate Development — 18.7% Margin, ¥287.7bn Unrealized Gains](https://japan-equity.com/wp-content/uploads/2026/07/p20_sq-1024x1024.jpg)
![[Obayashi] Domestic Civil Engineering — Resilience Spending Supports 9.6% Margin](https://japan-equity.com/wp-content/uploads/2026/07/p11_sq-1024x1024.jpg)
![[Obayashi] Share Price & External Ratings — vs TOPIX, ESG Index Inclusion](https://japan-equity.com/wp-content/uploads/2026/07/p40_sq-1024x1024.jpg)
![[Construction] ¥75.5tn Investment, Shrinking Workforce — Big-5 Market Share](https://japan-equity.com/wp-content/uploads/2026/07/p12_sq-1024x1024.jpg)



![[Obayashi] Capital Policy & Shareholder Returns — ROE 10%+, DOE ~5%, ¥100bn Buyback](https://japan-equity.com/wp-content/uploads/2026/07/p27_sq-1024x1024.jpg)
![[Obayashi] Reducing Cross-Shareholdings — ¥285.2bn Sold in Five Years](https://japan-equity.com/wp-content/uploads/2026/07/p29_sq-1024x1024.jpg)
![[Obayashi] ¥750bn Investment Plan — ¥300bn to Development, ¥190bn to Tech/DX](https://japan-equity.com/wp-content/uploads/2026/07/p30_sq-1024x1024.jpg)
![[Obayashi] MTP2022 KPIs — Operating Profit ~2x Target, ROE 14.4%](https://japan-equity.com/wp-content/uploads/2026/07/p25_sq-1024x1024.jpg)
![[Obayashi] Cash Allocation — ¥420bn Investment CF Over Five Years](https://japan-equity.com/wp-content/uploads/2026/07/p26_sq-1024x1024.jpg)
![[Obayashi] Green Energy — 44 Plants, 344MW, and the Green Hydrogen Challenge](https://japan-equity.com/wp-content/uploads/2026/07/p21_sq-1024x1024.jpg)
![[Obayashi] Tackling the Labor Shortage — Robotics Construction®](https://japan-equity.com/wp-content/uploads/2026/07/p14_sq-1024x1024.jpg)
