
This article is based on publicly available IR materials and is not a recommendation to buy or sell any specific securities.
Note: The Nanto Bank does not publish an English results presentation; this article is based on the company’s Japanese-language results presentation, with figures transcribed as reported. The presentation covers the fiscal year ended March 31, 2026, which this site classifies as FY2025; period labels in the text and tables below follow the company’s own notation. For the year, the Nanto Bank Group posted consolidated ordinary profit of 24,820 million yen and profit attributable to owners of parent of 17,062 million yen, both up year on year. The bank states that operating expenses increased, but net interest income and gains (losses) on bonds improved and credit-related expenses declined.
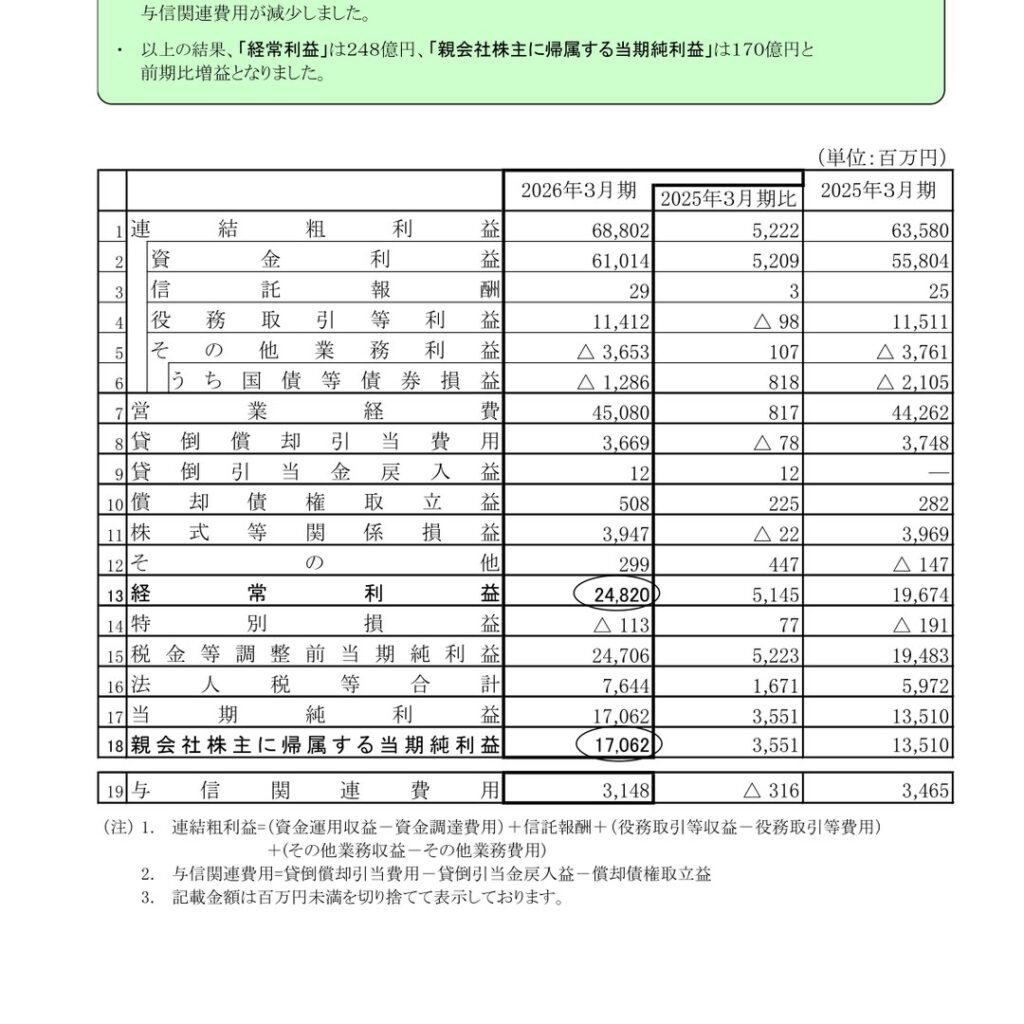
Consolidated Results (Full-Year Actual)
Consolidated gross business profit was 68,802 million yen, an increase of 5,222 million yen from the previous year, led by net interest income of 61,014 million yen (up 5,209 million yen). Net fees and commissions edged down 98 million yen to 11,412 million yen, while other operating income remained negative at minus 3,653 million yen, an improvement of 107 million yen, as losses on bonds narrowed to minus 1,286 million yen from minus 2,105 million yen. Operating expenses rose 817 million yen to 45,080 million yen. Ordinary profit increased 5,145 million yen to 24,820 million yen, and profit attributable to owners of parent rose 3,551 million yen to 17,062 million yen. Credit-related expenses fell 316 million yen to 3,148 million yen.
| Item (Millions of yen) | FY ended Mar 2026 | Change | FY ended Mar 2025 |
|---|---|---|---|
| Consolidated gross business profit | 68,802 | 5,222 | 63,580 |
| Net interest income | 61,014 | 5,209 | 55,804 |
| Trust fees | 29 | 3 | 25 |
| Net fees and commissions | 11,412 | △ 98 | 11,511 |
| Other operating income (loss) | △ 3,653 | 107 | △ 3,761 |
| of which gains (losses) on bonds | △ 1,286 | 818 | △ 2,105 |
| Operating expenses | 45,080 | 817 | 44,262 |
| Ordinary profit | 24,820 | 5,145 | 19,674 |
| Profit before income taxes | 24,706 | 5,223 | 19,483 |
| Total income taxes | 7,644 | 1,671 | 5,972 |
| Profit attributable to owners of parent | 17,062 | 3,551 | 13,510 |
| Credit-related expenses | 3,148 | △ 316 | 3,465 |
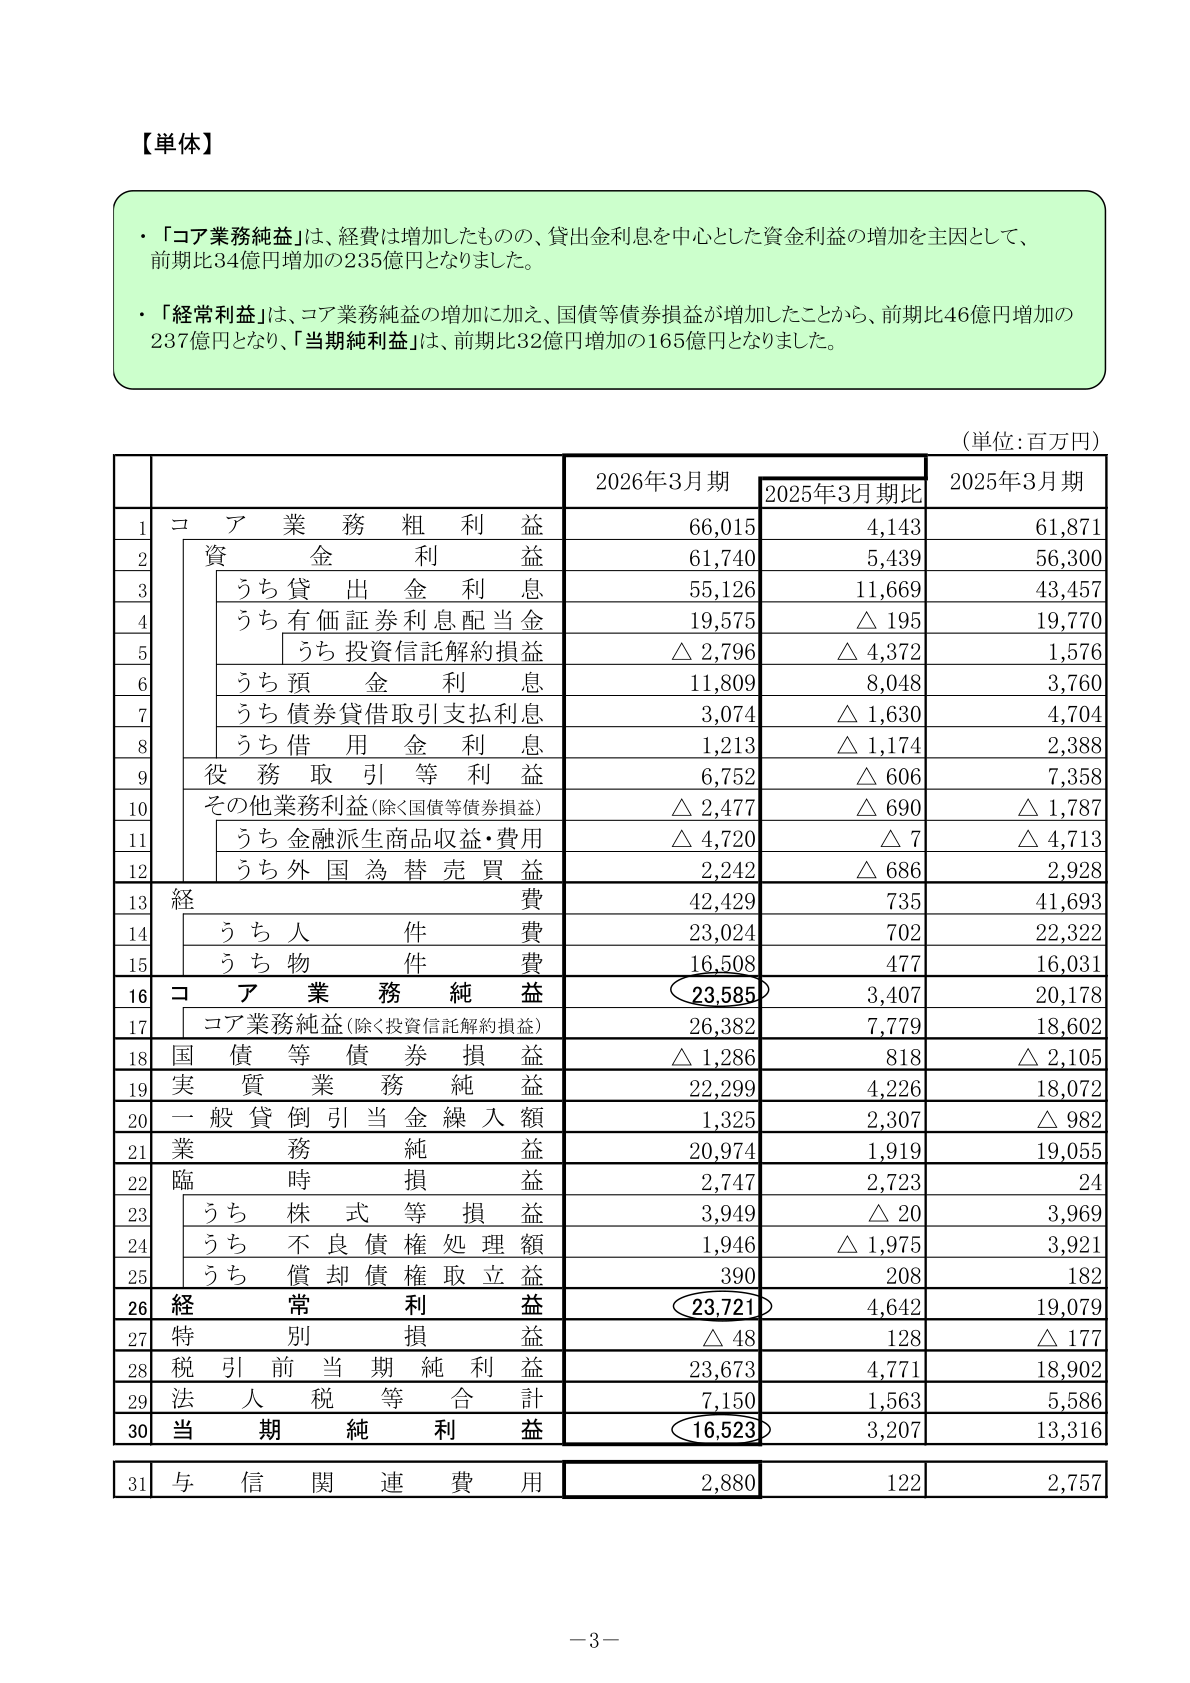
Non-Consolidated Results and Core Net Business Profit
On a non-consolidated basis, core gross business profit was 66,015 million yen, up 4,143 million yen. Net interest income rose 5,439 million yen to 61,740 million yen, with interest on loans up 11,669 million yen to 55,126 million yen, while interest on deposits within the same breakdown increased 8,048 million yen to 11,809 million yen. Interest and dividends on securities was 19,575 million yen, down 195 million yen, and included minus 2,796 million yen of gains (losses) on cancellation of investment trusts. Net fees and commissions declined 606 million yen to 6,752 million yen. Expenses increased 735 million yen to 42,429 million yen, comprising personnel expenses of 23,024 million yen and non-personnel expenses of 16,508 million yen. The bank states that core net business profit rose 3,407 million yen to 23,585 million yen, mainly on higher net interest income centered on interest on loans, despite the increase in expenses; excluding gains (losses) on cancellation of investment trusts, core net business profit was 26,382 million yen. Ordinary profit rose 4,642 million yen to 23,721 million yen and profit rose 3,207 million yen to 16,523 million yen.
| Item (Millions of yen, non-consolidated) | FY ended Mar 2026 | Change | FY ended Mar 2025 |
|---|---|---|---|
| Core gross business profit | 66,015 | 4,143 | 61,871 |
| Net interest income | 61,740 | 5,439 | 56,300 |
| of which interest on loans | 55,126 | 11,669 | 43,457 |
| of which interest and dividends on securities | 19,575 | △ 195 | 19,770 |
| of which interest on deposits | 11,809 | 8,048 | 3,760 |
| Net fees and commissions | 6,752 | △ 606 | 7,358 |
| Expenses | 42,429 | 735 | 41,693 |
| of which personnel expenses | 23,024 | 702 | 22,322 |
| of which non-personnel expenses | 16,508 | 477 | 16,031 |
| Core net business profit | 23,585 | 3,407 | 20,178 |
| Core net business profit (excluding gains/losses on cancellation of investment trusts) | 26,382 | 7,779 | 18,602 |
| Net business profit | 20,974 | 1,919 | 19,055 |
| Ordinary profit | 23,721 | 4,642 | 19,079 |
| Profit | 16,523 | 3,207 | 13,316 |
| Credit-related expenses | 2,880 | 122 | 2,757 |
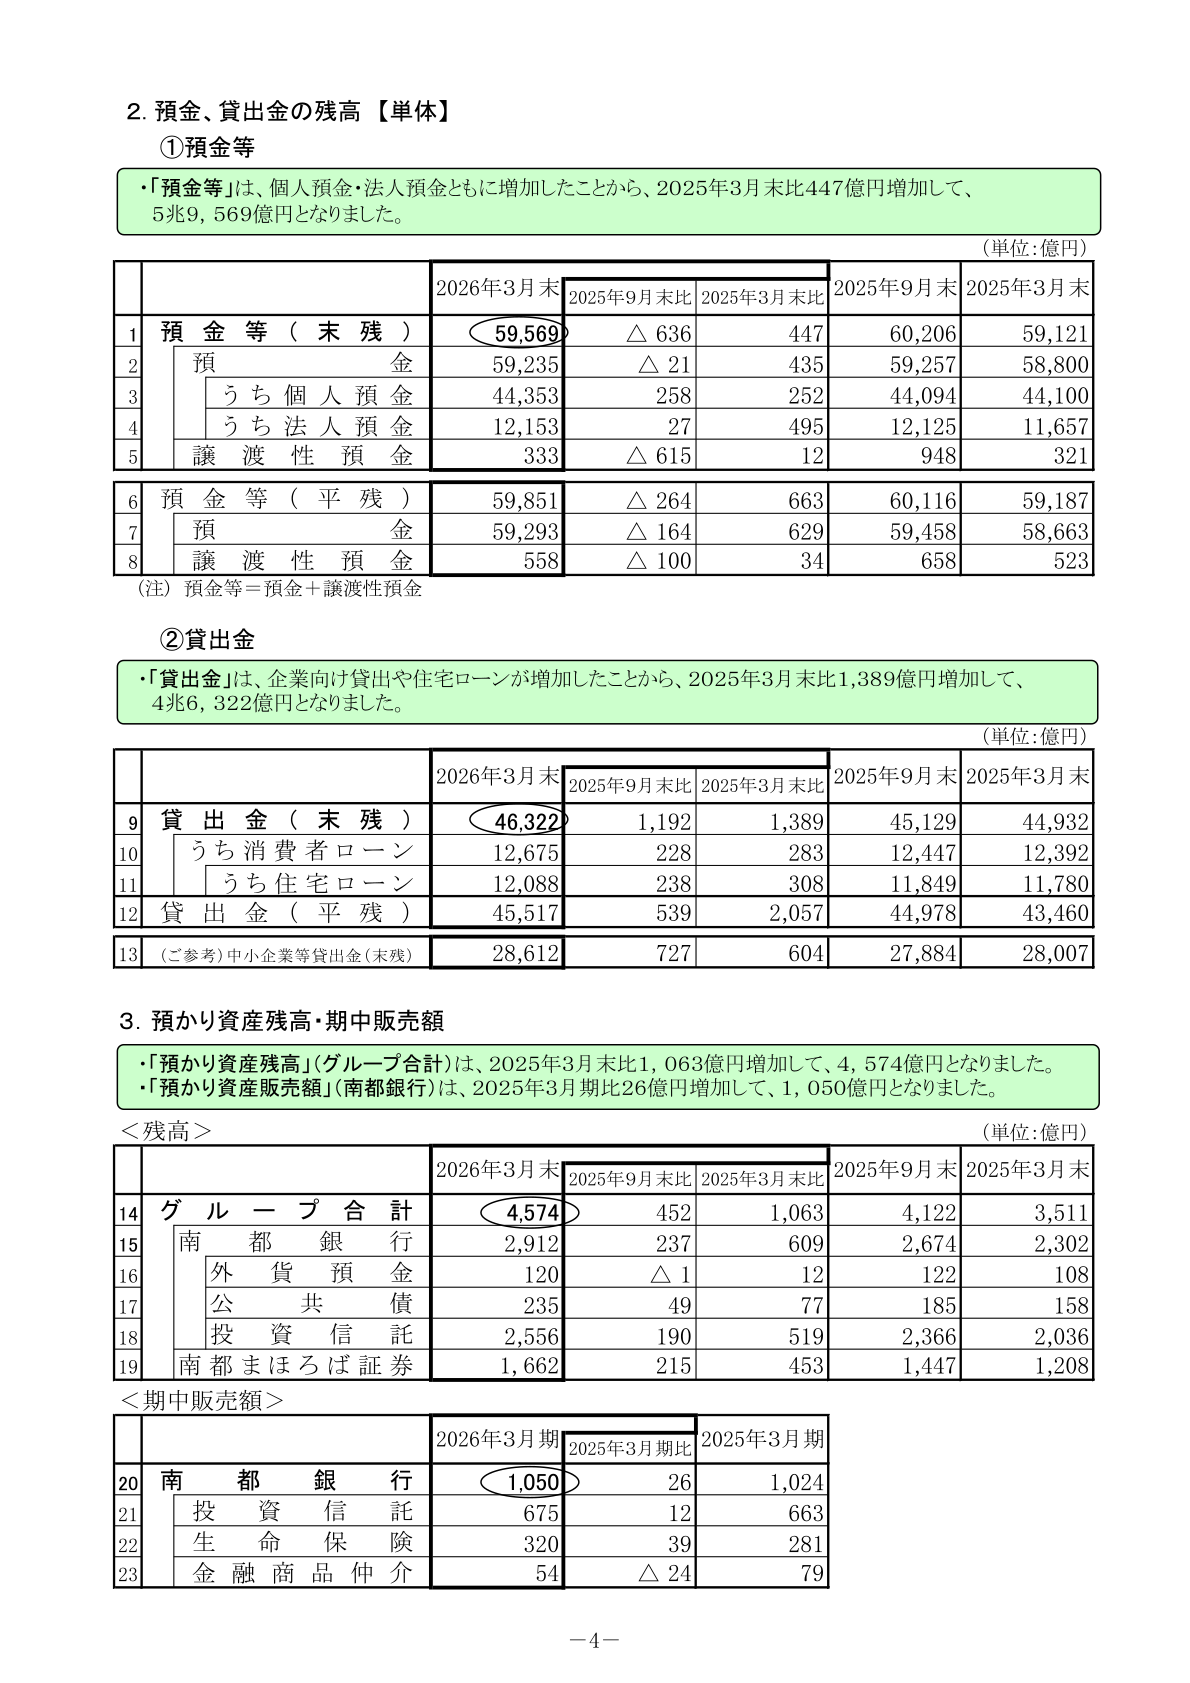
Deposits, Loans and Assets under Custody
Deposits and negotiable certificates of deposit (period-end, non-consolidated) increased 447 hundred million yen from the end of March 2025 to 59,569 hundred million yen, with the bank citing growth in both individual and corporate deposits. Loans (period-end) increased 1,389 hundred million yen to 46,322 hundred million yen, which the bank attributes to growth in corporate lending and housing loans; housing loans stood at 12,088 hundred million yen. Assets under custody for the group totaled 4,574 hundred million yen, up 1,063 hundred million yen, of which the Nanto Bank accounted for 2,912 hundred million yen and Nanto Mahoroba Securities for 1,662 hundred million yen. Sales of investment products at the Nanto Bank during the period were 1,050 hundred million yen, up 26 hundred million yen year on year.
| Item (Hundred millions of yen, non-consolidated) | End-Mar 2026 | Change vs End-Mar 2025 | End-Mar 2025 |
|---|---|---|---|
| Deposits and NCDs (period-end) | 59,569 | 447 | 59,121 |
| Deposits | 59,235 | 435 | 58,800 |
| of which individual deposits | 44,353 | 252 | 44,100 |
| of which corporate deposits | 12,153 | 495 | 11,657 |
| Loans (period-end) | 46,322 | 1,389 | 44,932 |
| of which consumer loans | 12,675 | 283 | 12,392 |
| of which housing loans | 12,088 | 308 | 11,780 |
| Loans (average balance) | 45,517 | 2,057 | 43,460 |
| Loans to SMEs, etc. (period-end, reference) | 28,612 | 604 | 28,007 |
| Assets under custody, group total | 4,574 | 1,063 | 3,511 |
| of which the Nanto Bank | 2,912 | 609 | 2,302 |
| of which Nanto Mahoroba Securities | 1,662 | 453 | 1,208 |
Capital Adequacy and Management Indicators
The capital adequacy ratio (domestic standard) was 12.82% on a consolidated basis (preliminary figure) and 12.38% on a non-consolidated basis, both higher than at the end of March 2025 (11.31% and 10.93%). The bank explains that risk assets decreased on a lower securities balance while the amount of capital increased through accumulated earnings, and notes that the securities balance was reduced temporarily, adding that it is working to rebuild its securities portfolio to strengthen earning power. Consolidated capital was 2,937 hundred million yen and risk assets were 22,912 hundred million yen. Among management indicators, ROE on a net business profit basis (non-consolidated) was 7.60%, ROE on a profit basis was 5.99% (non-consolidated) and 5.90% (consolidated), ROA on a core net business profit basis (non-consolidated) was 0.35%, and OHR on a core gross business profit basis (non-consolidated) was 64.2%, against 67.3% a year earlier. On asset quality, non-consolidated disclosed claims under the Financial Reconstruction Act totaled 577 hundred million yen, down 38 hundred million yen from the end of March 2025, and the coverage ratio was 84.6%, up from 82.4%.
FY2026 Forecast (Fiscal Year Ending March 31, 2027)
For the fiscal year ending March 31, 2027, the bank forecasts consolidated ordinary profit of 325 hundred million yen and consolidated profit attributable to owners of parent of 220 hundred million yen. On a non-consolidated basis, it forecasts core net business profit of 320 hundred million yen, ordinary profit of 315 hundred million yen and profit of 215 hundred million yen. Interest on loans is projected at 686 hundred million yen and expenses at 451 hundred million yen, while gains (losses) on bonds are forecast at minus 35 hundred million yen and credit-related expenses at 25 hundred million yen.
| Item (Hundred millions of yen) | FY ending Mar 2027 (Forecast) | Change | FY ended Mar 2026 (Actual) |
|---|---|---|---|
| Ordinary profit (consolidated) | 325 | 76 | 248 |
| Profit attributable to owners of parent (consolidated) | 220 | 49 | 170 |
| Core gross business profit (non-consolidated) | 773 | 113 | 660 |
| Net interest income (non-consolidated) | 719 | 101 | 617 |
| of which interest on loans | 686 | 135 | 551 |
| of which interest on securities | 246 | 51 | 195 |
| Net fees and commissions (non-consolidated) | 72 | 4 | 67 |
| Expenses (non-consolidated) | 451 | 27 | 424 |
| Core net business profit (non-consolidated) | 320 | 84 | 235 |
| Gains (losses) on bonds (non-consolidated) | △ 35 | △ 22 | △ 12 |
| Ordinary profit (non-consolidated) | 315 | 77 | 237 |
| Profit (non-consolidated) | 215 | 49 | 165 |
| Credit-related expenses (non-consolidated) | 25 | △ 3 | 28 |
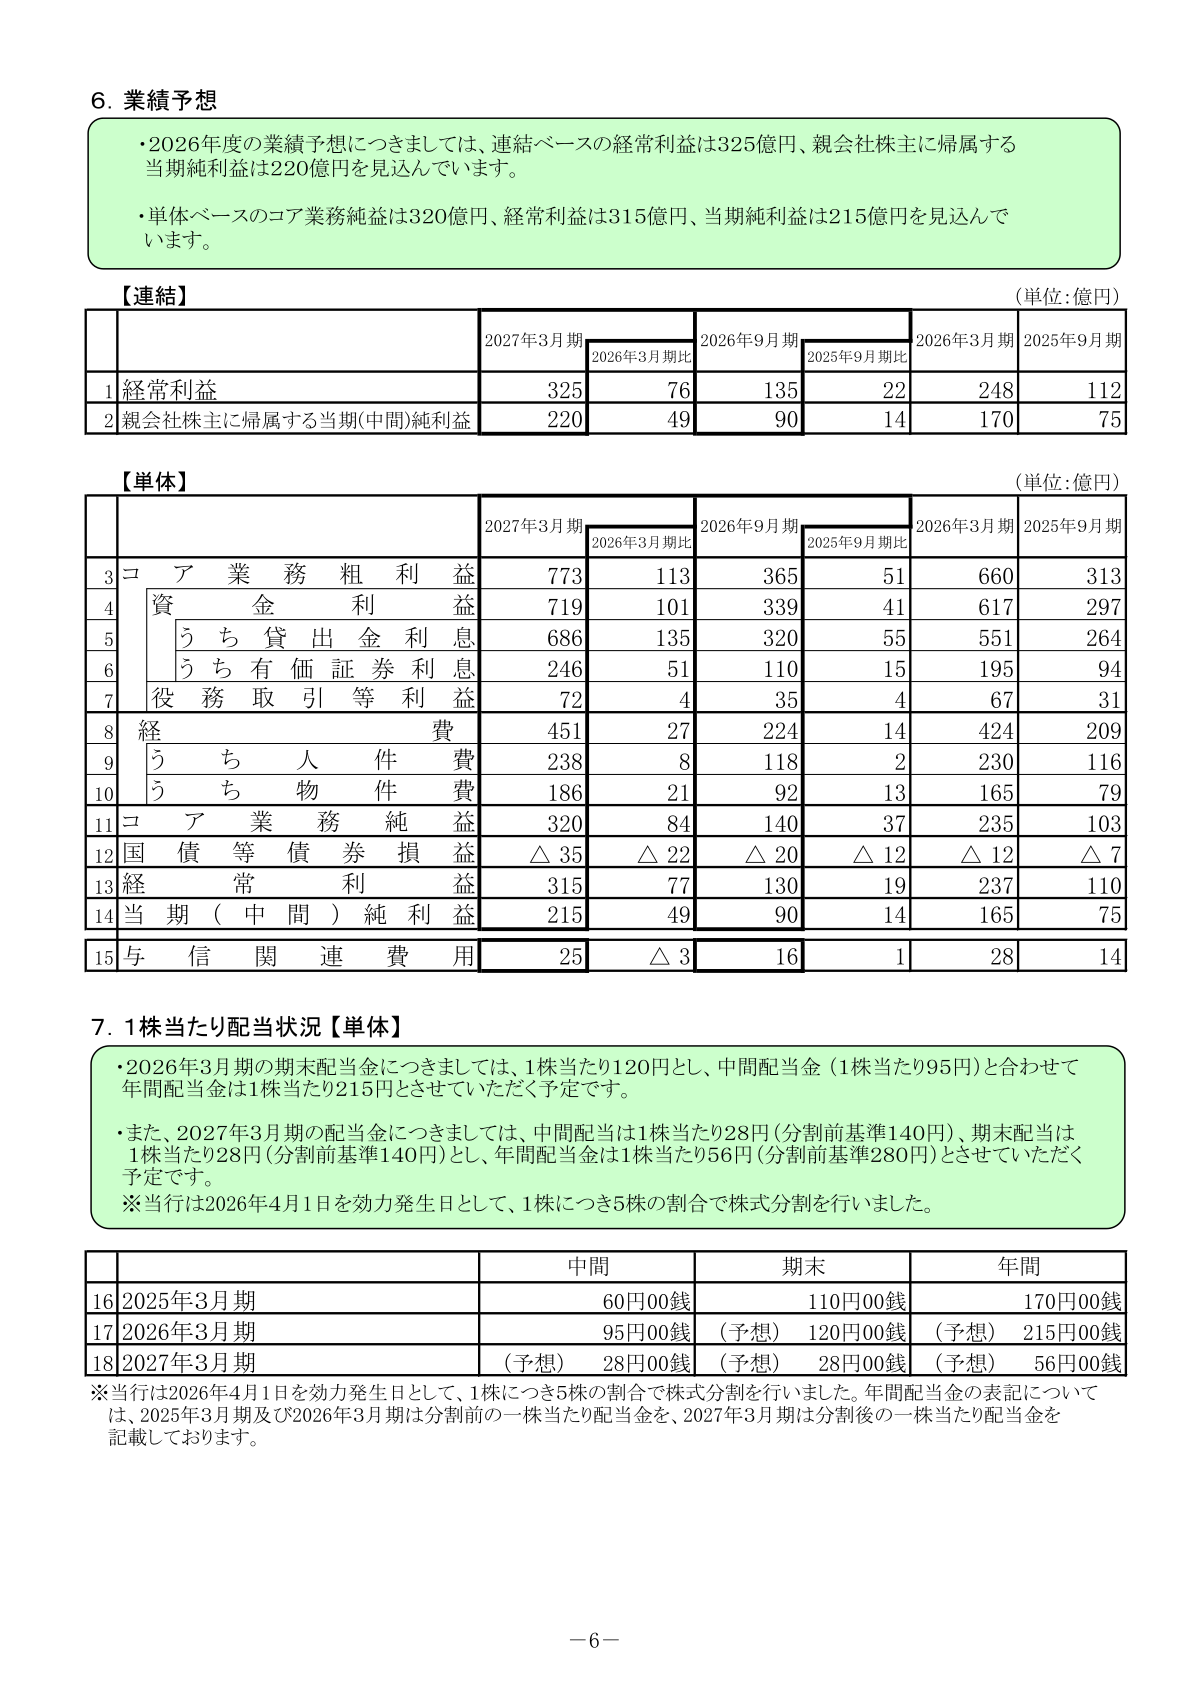
Shareholder Returns
For the fiscal year ended March 31, 2026, the bank plans a year-end dividend of 120.00 yen per share, which together with the interim dividend of 95.00 yen per share brings the annual dividend to 215.00 yen per share, against 170.00 yen per share for the fiscal year ended March 31, 2025. For the fiscal year ending March 31, 2027, it plans an interim dividend of 28.00 yen per share (140.00 yen on a pre-split basis) and a year-end dividend of 28.00 yen per share (140.00 yen on a pre-split basis), for an annual dividend of 56.00 yen per share (280.00 yen on a pre-split basis). The bank carried out a five-for-one share split with an effective date of April 1, 2026; the presentation states that dividends per share for the fiscal years ended March 31, 2025 and March 31, 2026 are shown on a pre-split basis, while those for the fiscal year ending March 31, 2027 are shown on a post-split basis.
| Dividends per share | Interim | Year-end | Annual |
|---|---|---|---|
| FY ended Mar 2025 | 60.00 yen | 110.00 yen | 170.00 yen |
| FY ended Mar 2026 | 95.00 yen | 120.00 yen (forecast) | 215.00 yen (forecast) |
| FY ending Mar 2027 (post-split) | 28.00 yen (forecast) | 28.00 yen (forecast) | 56.00 yen (forecast) |
Loan Portfolio by Industry
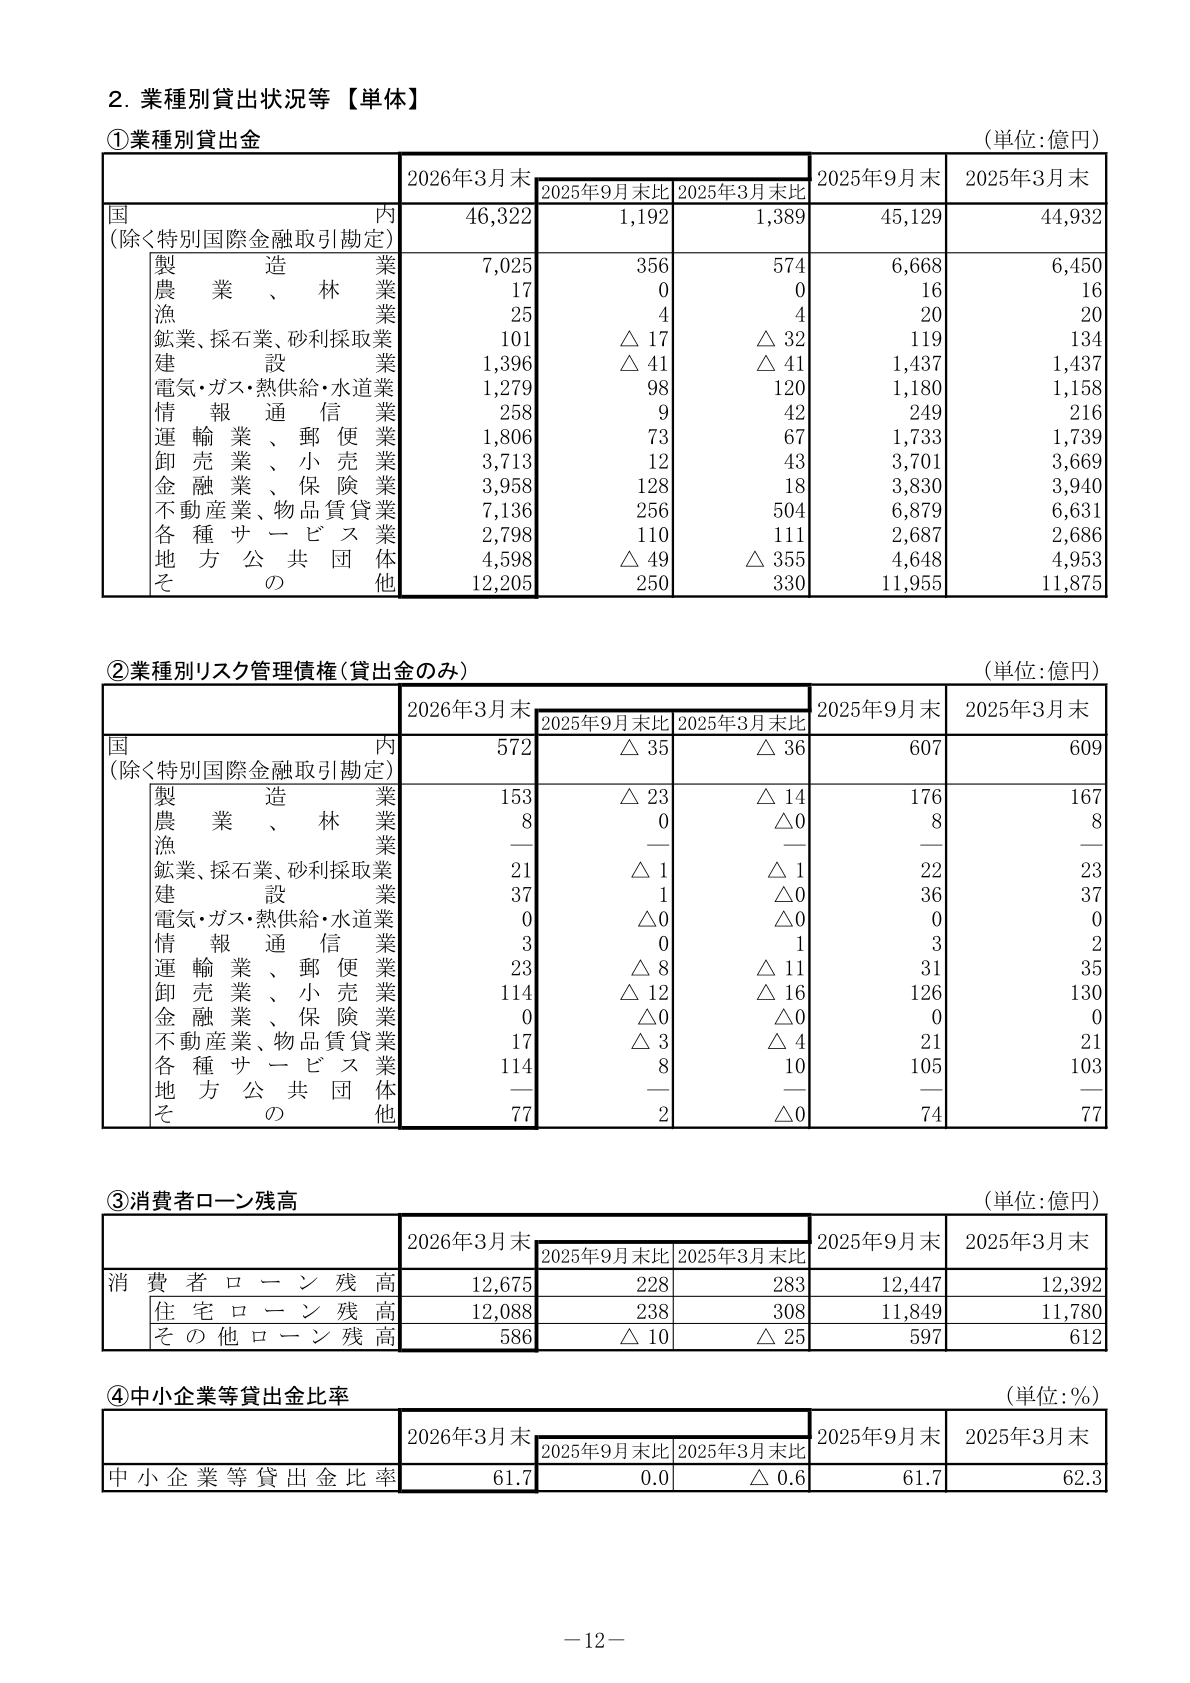
Domestic loans (non-consolidated, excluding the special international financial transactions account) stood at 46,322 hundred million yen at the end of March 2026. The largest exposures were real estate and goods rental at 7,136 hundred million yen (up 504 hundred million yen from the end of March 2025) and manufacturing at 7,025 hundred million yen (up 574 hundred million yen), followed by local governments at 4,598 hundred million yen (down 355 hundred million yen), finance and insurance at 3,958 hundred million yen and wholesale and retail at 3,713 hundred million yen. The ratio of loans to SMEs and others was 61.7%, compared with 62.3% at the end of March 2025. Risk-monitored loans by industry totaled 572 hundred million yen, down 36 hundred million yen from the end of March 2025.
This article is an analysis based on publicly available information and is not a recommendation to buy or sell any specific securities. Investment decisions are your own responsibility.
![[Obayashi] Investors’ Guide 2026 — The Complete 24-Article Breakdown](https://japan-equity.com/wp-content/uploads/2026/07/hub_cover-1024x1024.png)
![[Obayashi] IR & SR Policy — Feeding Dialogue Back into Management](https://japan-equity.com/wp-content/uploads/2026/07/p32_sq-1024x1024.jpg)
![[Obayashi] Real Estate Development — 18.7% Margin, ¥287.7bn Unrealized Gains](https://japan-equity.com/wp-content/uploads/2026/07/p20_sq-1024x1024.jpg)
![[Obayashi] Domestic Civil Engineering — Resilience Spending Supports 9.6% Margin](https://japan-equity.com/wp-content/uploads/2026/07/p11_sq-1024x1024.jpg)
![[Obayashi] Share Price & External Ratings — vs TOPIX, ESG Index Inclusion](https://japan-equity.com/wp-content/uploads/2026/07/p40_sq-1024x1024.jpg)
![[Construction] ¥75.5tn Investment, Shrinking Workforce — Big-5 Market Share](https://japan-equity.com/wp-content/uploads/2026/07/p12_sq-1024x1024.jpg)



![[Obayashi] Capital Policy & Shareholder Returns — ROE 10%+, DOE ~5%, ¥100bn Buyback](https://japan-equity.com/wp-content/uploads/2026/07/p27_sq-1024x1024.jpg)
![[Obayashi] Reducing Cross-Shareholdings — ¥285.2bn Sold in Five Years](https://japan-equity.com/wp-content/uploads/2026/07/p29_sq-1024x1024.jpg)
![[Obayashi] ¥750bn Investment Plan — ¥300bn to Development, ¥190bn to Tech/DX](https://japan-equity.com/wp-content/uploads/2026/07/p30_sq-1024x1024.jpg)
![[Obayashi] MTP2022 KPIs — Operating Profit ~2x Target, ROE 14.4%](https://japan-equity.com/wp-content/uploads/2026/07/p25_sq-1024x1024.jpg)
![[Obayashi] Cash Allocation — ¥420bn Investment CF Over Five Years](https://japan-equity.com/wp-content/uploads/2026/07/p26_sq-1024x1024.jpg)
![[Obayashi] Green Energy — 44 Plants, 344MW, and the Green Hydrogen Challenge](https://japan-equity.com/wp-content/uploads/2026/07/p21_sq-1024x1024.jpg)
![[Obayashi] Tackling the Labor Shortage — Robotics Construction®](https://japan-equity.com/wp-content/uploads/2026/07/p14_sq-1024x1024.jpg)
