
This article is based on publicly available IR materials and is not a recommendation to buy or sell any specific securities.
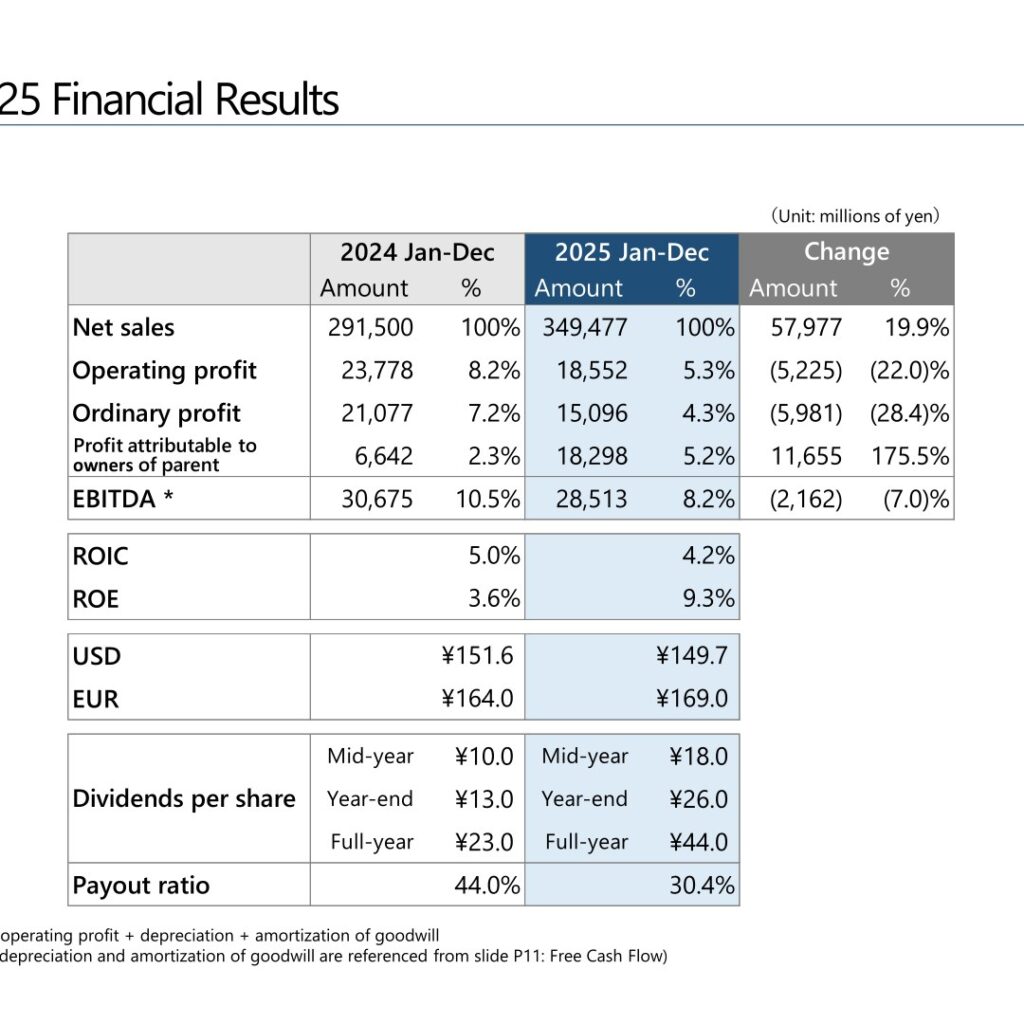
Tadano Ltd. released its consolidated financial results for FY 2025 on February 10, 2026. The company’s fiscal year runs from January 1 to December 31, so FY 2025 covers January 1, 2025 through December 31, 2025. Net sales came to 349,477 million yen, up 57,977 million yen or 19.9% year on year, which the company attributes to the acquisitions of Manitex and TIS. Operating profit fell to 18,552 million yen, down 5,225 million yen or 22.0%, on temporary factors including M&A-related expenses and the impact of U.S. tariffs, while profit attributable to owners of parent rose 175.5% to 18,298 million yen on extraordinary income from the sale of non-current assets in Europe.
Consolidated Results (Full-Year Actual)
Against the company’s forecast, net sales came in 5.5 billion yen lower, which Tadano explains by temporary shipment delays amid U.S. tariff uncertainties and production delays from production transfers in Europe. Operating profit was 0.5 billion yen above forecast and profit attributable to owners of parent was 3.2 billion yen above forecast, the latter helped by gain on sale of investment securities and shares of subsidiaries and associates. EBITDA, defined in the materials as operating profit plus depreciation plus amortization of goodwill, was 28,513 million yen. ROE rose to 9.3% from 3.6%, while ROIC declined to 4.2% from 5.0%.
| Item (millions of yen) | 2024 Jan-Dec | 2025 Jan-Dec | Change | Change % |
|---|---|---|---|---|
| Net sales | 291,500 | 349,477 | 57,977 | 19.9% |
| Operating profit | 23,778 | 18,552 | (5,225) | (22.0)% |
| Ordinary profit | 21,077 | 15,096 | (5,981) | (28.4)% |
| Profit attributable to owners of parent | 6,642 | 18,298 | 11,655 | 175.5% |
| EBITDA | 30,675 | 28,513 | (2,162) | (7.0)% |
| Operating profit margin | 8.2% | 5.3% | – | – |
| ROIC | 5.0% | 4.2% | – | – |
| ROE | 3.6% | 9.3% | – | – |
| USD (exchange rate) | ¥151.6 | ¥149.7 | – | – |
| EUR (exchange rate) | ¥164.0 | ¥169.0 | – | – |
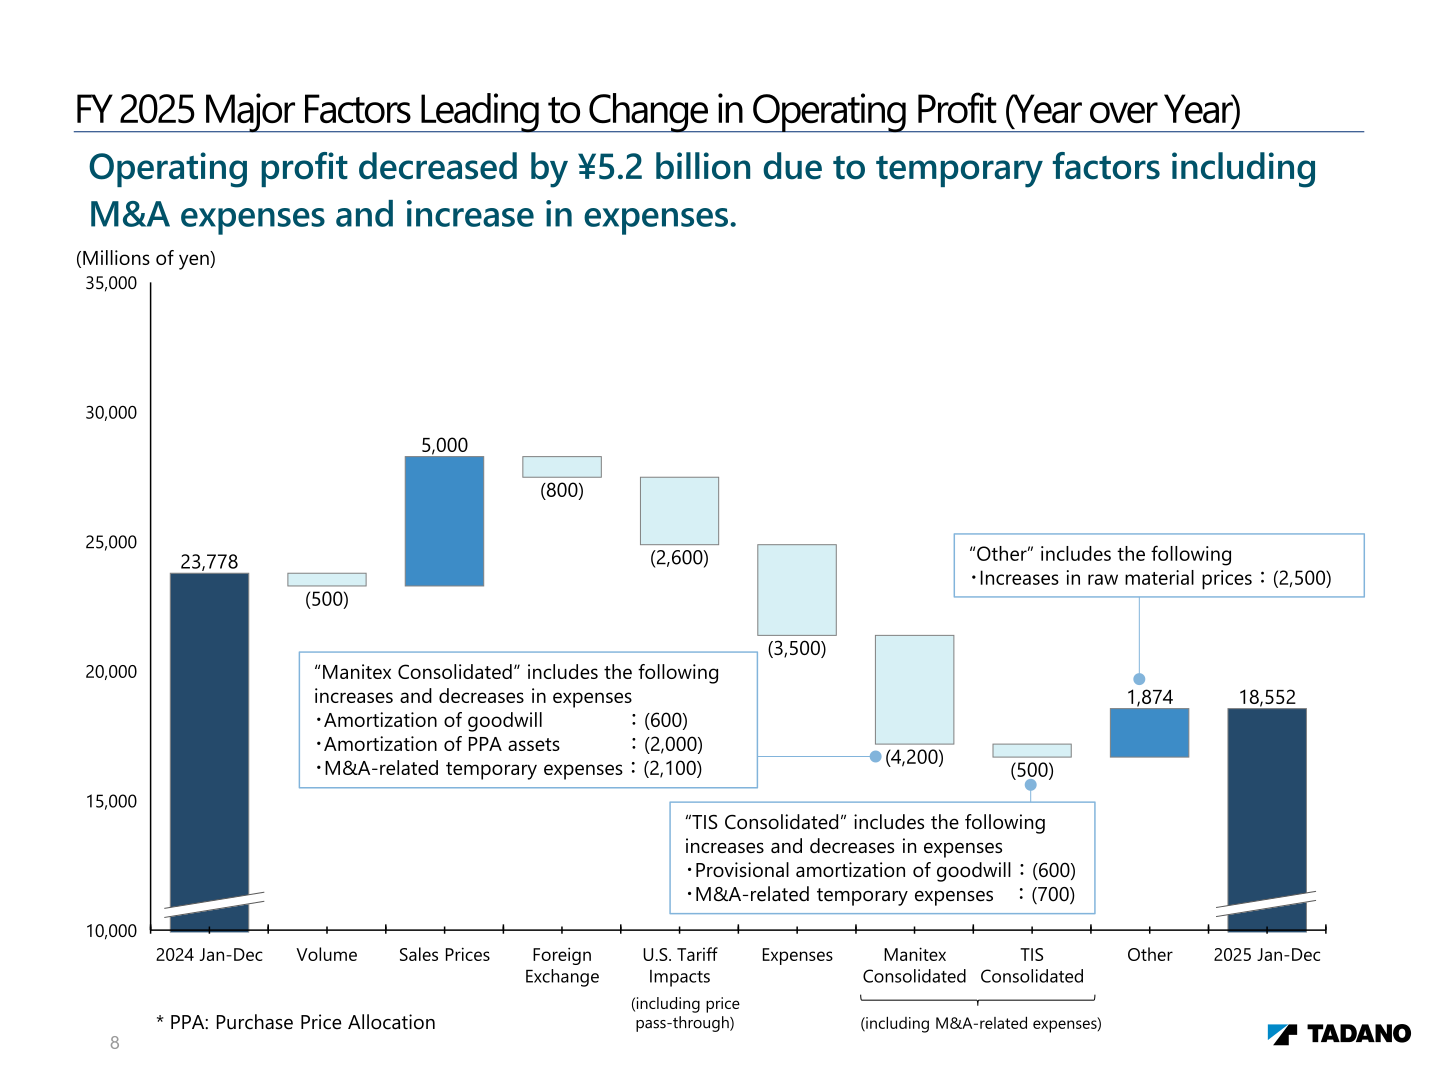
The materials break down the year-on-year change in operating profit as follows: Volume (500), Sales Prices +5,000, Foreign Exchange (800), U.S. Tariff Impacts (2,600), Expenses (3,500), Manitex Consolidated (4,200), TIS Consolidated (500) and Other +1,874, in millions of yen. Within “Manitex Consolidated”, the company lists amortization of goodwill (600), amortization of PPA assets (2,000) and M&A-related temporary expenses (2,100); within “TIS Consolidated”, provisional amortization of goodwill (600) and M&A-related temporary expenses (700); and within “Other”, increases in raw material prices (2,500).
Net Sales by Product
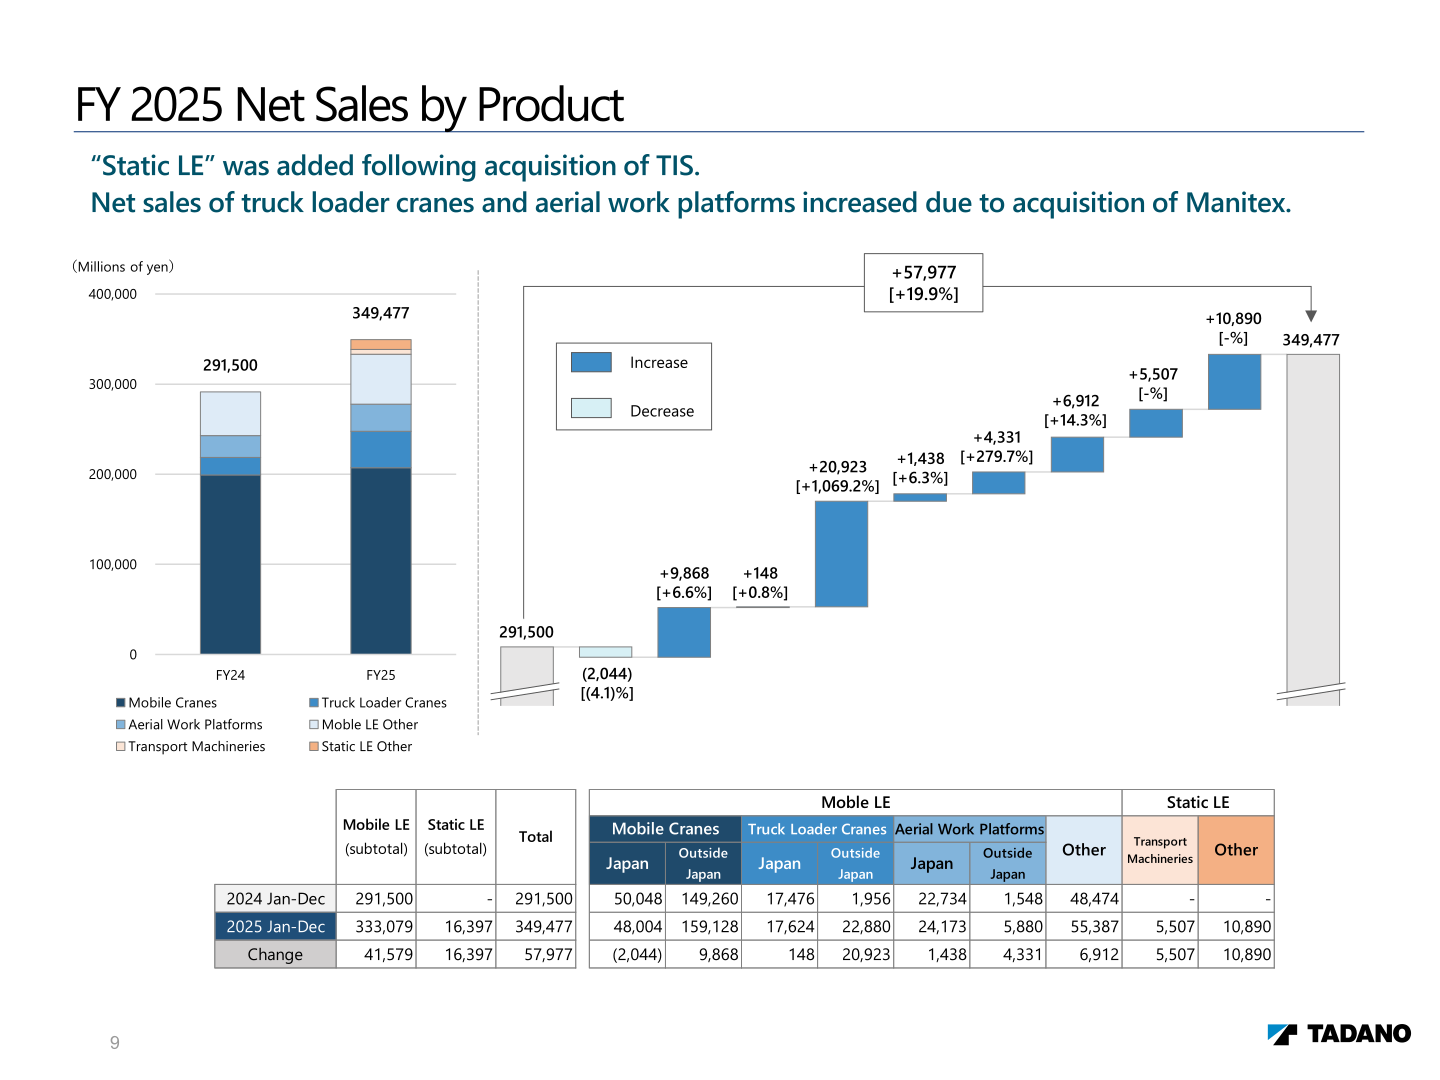
Mobile cranes recorded net sales of 207.1 billion yen. By market, Tadano cites lower demand in Japan as operator shortages and rising material costs curbed small- and medium-scale construction projects; solid sales in North America where data-center investment maintained demand despite shipment delays related to U.S. tariffs; declining demand in Europe as new investments were postponed amid the economic downturn in Germany and other European markets, together with delayed All Terrain Crane production caused by the production transfer; and subdued oil-related demand in the Middle East, where large orders helped sustain sales. Truck loader crane net sales were 40.5 billion yen and aerial work platform net sales were 30.0 billion yen, both lifted by the Manitex acquisition. A new “Static LE” category was added following the acquisition of TIS.
| Net sales by product (millions of yen) | 2024 Jan-Dec | 2025 Jan-Dec | Change |
|---|---|---|---|
| Mobile Cranes — Japan | 50,048 | 48,004 | (2,044) |
| Mobile Cranes — Outside Japan | 149,260 | 159,128 | 9,868 |
| Truck Loader Cranes — Japan | 17,476 | 17,624 | 148 |
| Truck Loader Cranes — Outside Japan | 1,956 | 22,880 | 20,923 |
| Aerial Work Platforms — Japan | 22,734 | 24,173 | 1,438 |
| Aerial Work Platforms — Outside Japan | 1,548 | 5,880 | 4,331 |
| Mobile LE — Other | 48,474 | 55,387 | 6,912 |
| Mobile LE (subtotal) | 291,500 | 333,079 | 41,579 |
| Static LE — Transport Machineries | – | 5,507 | 5,507 |
| Static LE — Other | – | 10,890 | 10,890 |
| Static LE (subtotal) | – | 16,397 | 16,397 |
| Total | 291,500 | 349,477 | 57,977 |
Net Sales by Region
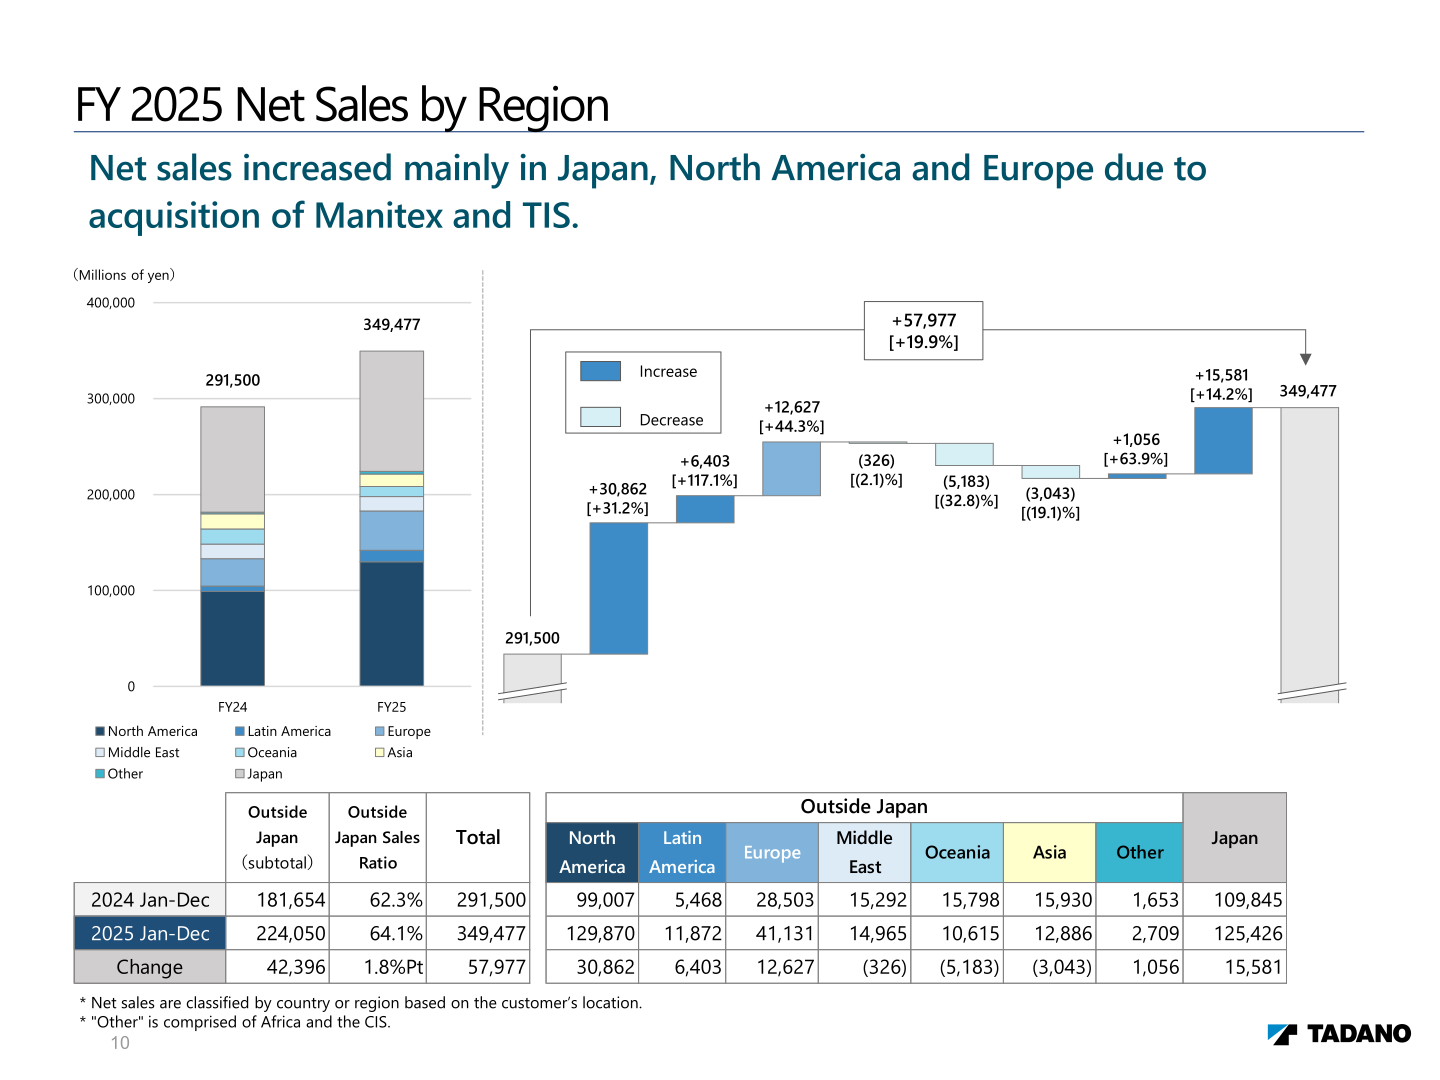
Net sales increased mainly in Japan, North America and Europe on the acquisitions of Manitex and TIS. Sales outside Japan reached 224,050 million yen, taking the outside-Japan sales ratio to 64.1% from 62.3%, a gain of 1.8 percentage points. The Middle East, Oceania and Asia declined. Net sales are classified by country or region based on the customer’s location, and “Other” is comprised of Africa and the CIS.
| Net sales by region (millions of yen) | 2024 Jan-Dec | 2025 Jan-Dec | Change |
|---|---|---|---|
| North America | 99,007 | 129,870 | 30,862 |
| Latin America | 5,468 | 11,872 | 6,403 |
| Europe | 28,503 | 41,131 | 12,627 |
| Middle East | 15,292 | 14,965 | (326) |
| Oceania | 15,798 | 10,615 | (5,183) |
| Asia | 15,930 | 12,886 | (3,043) |
| Other | 1,653 | 2,709 | 1,056 |
| Outside Japan (subtotal) | 181,654 | 224,050 | 42,396 |
| Japan | 109,845 | 125,426 | 15,581 |
| Total | 291,500 | 349,477 | 57,977 |
| Outside Japan sales ratio | 62.3% | 64.1% | 1.8%Pt |
Balance Sheet and Free Cash Flow
Total assets grew to 458,529 million yen as of December 31, 2025 from 403,422 million yen a year earlier. Inventories rose to 156,716 million yen and intangible fixed assets to 27,225 million yen, while interest-bearing debt increased to 146,016 million yen from 122,473 million yen. Tadano attributes the increase in interest-bearing debt to preparation for the impact of U.S. tariffs and states that inventories, fixed assets and interest-bearing debt all increased due to the acquisition of Manitex and TIS. Net interest-bearing debt was 64,174 million yen and the net D/E ratio was 0.31 versus 0.16. Operating CF was negative 2,407 million yen, investing CF was negative 649 million yen and free cash flow was negative 3,056 million yen, an improvement of 22,026 million yen from the prior year.
FY 2026 Forecast
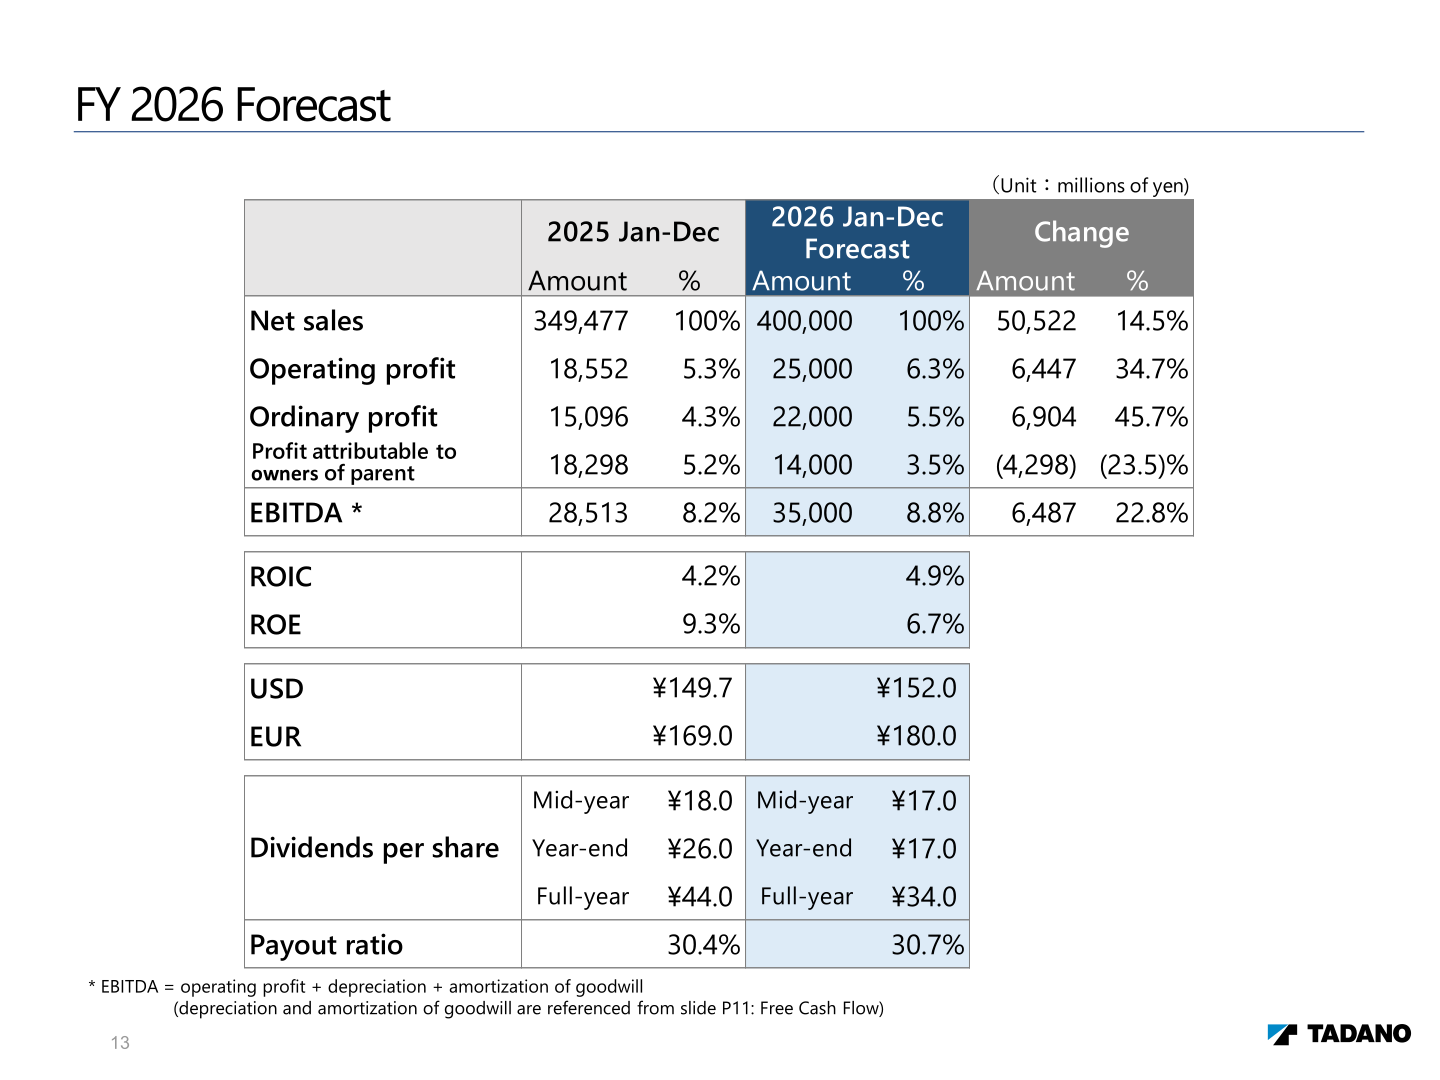
For FY 2026 (January-December 2026), Tadano forecasts net sales of 400,000 million yen and operating profit of 25,000 million yen. The company expects operating profit to increase by 6.4 billion yen due to the absence of temporary factors including the M&A expenses recorded in FY 2025, an increase in sales volume and improvements in selling prices. Profit attributable to owners of parent is projected to fall to 14,000 million yen. Assumed exchange rates are ¥152.0 to the USD and ¥180.0 to the EUR.
| Item (millions of yen) | 2025 Jan-Dec | 2026 Jan-Dec Forecast | Change | Change % |
|---|---|---|---|---|
| Net sales | 349,477 | 400,000 | 50,522 | 14.5% |
| Operating profit | 18,552 | 25,000 | 6,447 | 34.7% |
| Ordinary profit | 15,096 | 22,000 | 6,904 | 45.7% |
| Profit attributable to owners of parent | 18,298 | 14,000 | (4,298) | (23.5)% |
| EBITDA | 28,513 | 35,000 | 6,487 | 22.8% |
| Operating profit margin | 5.3% | 6.3% | – | – |
| ROIC | 4.2% | 4.9% | – | – |
| ROE | 9.3% | 6.7% | – | – |
| USD (exchange rate) | ¥149.7 | ¥152.0 | – | – |
| EUR (exchange rate) | ¥169.0 | ¥180.0 | – | – |
By region, the forecast assumes the largest increase in Europe, at 61,000 million yen or +48.3%, with North America at 145,000 million yen and Japan at 140,000 million yen. The outside-Japan sales ratio is projected at 65.0%. By product, mobile cranes are forecast at 242,000 million yen (+16.8%), truck loader cranes at 45,000 million yen (+11.1%), aerial work platforms at 33,000 million yen (+9.8%) and the Static LE subtotal at 27,000 million yen (+64.7%).
| Net sales by region (millions of yen) | 2025 Jan-Dec | 2026 Jan-Dec Forecast | Change | Change % |
|---|---|---|---|---|
| North America | 129,870 | 145,000 | 15,129 | 11.6% |
| Latin America | 11,872 | 11,000 | (872) | (7.3)% |
| Europe | 41,131 | 61,000 | 19,868 | 48.3% |
| Middle East | 14,965 | 12,000 | (2,965) | (19.8)% |
| Oceania | 10,615 | 12,000 | 1,384 | 13.0% |
| Asia | 12,886 | 16,000 | 3,113 | 24.2% |
| Other | 2,709 | 3,000 | 290 | 10.7% |
| Subtotal (outside Japan) | 224,050 | 260,000 | 35,949 | 16.0% |
| Japan | 125,426 | 140,000 | 14,573 | 11.6% |
| Total | 349,477 | 400,000 | 50,522 | 14.5% |
| Outside Japan sales ratio | 64.1% | 65.0% | – | – |
Shareholder Returns
The FY 2025 dividend per share was ¥44.0 in total, comprising a mid-year dividend of ¥18.0 and a year-end dividend of ¥26.0, against ¥23.0 in FY 2024 (mid-year ¥10.0, year-end ¥13.0). The payout ratio was 30.4%, down from 44.0%. For FY 2026 the company forecasts a full-year dividend of ¥34.0 per share, comprising ¥17.0 mid-year and ¥17.0 year-end, for a payout ratio of 30.7%.
| Dividends per share | 2024 Jan-Dec | 2025 Jan-Dec | 2026 Jan-Dec Forecast |
|---|---|---|---|
| Mid-year | ¥10.0 | ¥18.0 | ¥17.0 |
| Year-end | ¥13.0 | ¥26.0 | ¥17.0 |
| Full-year | ¥23.0 | ¥44.0 | ¥34.0 |
| Payout ratio | 44.0% | 30.4% | 30.7% |
Market Demand for Mobile Cranes
In the appendix, Tadano presents demand and share data for mobile cranes (Rough Terrain Cranes, All Terrain Cranes and Truck Cranes). Total demand in 2025 (January-December) was 15,970 units, up 0.4% from 15,900 units, with the outside-Japan subtotal at 14,640 units (+0.8%) and Japan at 1,330 units (-3.6%). Tadano’s share was 12% of the total, versus 13% a year earlier; the Japan share was 59% versus 61%. Figures showing demand based on Tadano research are rounded to the nearest ten units, and mobile cranes produced in Russia and produced in China for the Chinese market are excluded from demand.
| Mobile cranes (RT/AT/TC) | Demand 2024 Jan-Dec (units) | Demand 2025 Jan-Dec (units) | Change | Share 2024 | Share 2025 |
|---|---|---|---|---|---|
| North America | 1,500 | 1,540 | 2.7% | 40% | 40% |
| Latin America | 1,500 | 1,400 | (6.7)% | 2% | 2% |
| Europe | 1,540 | 1,380 | (10.4)% | 6% | 5% |
| Middle East | 2,580 | 3,260 | 26.4% | 8% | 6% |
| Oceania | 190 | 190 | 0.0% | 31% | 18% |
| Asia | 2,650 | 2,810 | 6.0% | 6% | 4% |
| Other | 4,560 | 4,060 | (11.0)% | 0% | 1% |
| Subtotal | 14,520 | 14,640 | 0.8% | – | – |
| Japan | 1,380 | 1,330 | (3.6)% | 61% | 59% |
| Total | 15,900 | 15,970 | 0.4% | 13% | 12% |
This article is an analysis based on publicly available information and is not a recommendation to buy or sell any specific securities. Investment decisions are your own responsibility.
![[Obayashi] Investors’ Guide 2026 — The Complete 24-Article Breakdown](https://japan-equity.com/wp-content/uploads/2026/07/hub_cover-1024x1024.png)
![[Obayashi] IR & SR Policy — Feeding Dialogue Back into Management](https://japan-equity.com/wp-content/uploads/2026/07/p32_sq-1024x1024.jpg)
![[Obayashi] Real Estate Development — 18.7% Margin, ¥287.7bn Unrealized Gains](https://japan-equity.com/wp-content/uploads/2026/07/p20_sq-1024x1024.jpg)
![[Obayashi] Domestic Civil Engineering — Resilience Spending Supports 9.6% Margin](https://japan-equity.com/wp-content/uploads/2026/07/p11_sq-1024x1024.jpg)
![[Obayashi] Share Price & External Ratings — vs TOPIX, ESG Index Inclusion](https://japan-equity.com/wp-content/uploads/2026/07/p40_sq-1024x1024.jpg)
![[Construction] ¥75.5tn Investment, Shrinking Workforce — Big-5 Market Share](https://japan-equity.com/wp-content/uploads/2026/07/p12_sq-1024x1024.jpg)



![[Obayashi] Capital Policy & Shareholder Returns — ROE 10%+, DOE ~5%, ¥100bn Buyback](https://japan-equity.com/wp-content/uploads/2026/07/p27_sq-1024x1024.jpg)
![[Obayashi] Reducing Cross-Shareholdings — ¥285.2bn Sold in Five Years](https://japan-equity.com/wp-content/uploads/2026/07/p29_sq-1024x1024.jpg)
![[Obayashi] ¥750bn Investment Plan — ¥300bn to Development, ¥190bn to Tech/DX](https://japan-equity.com/wp-content/uploads/2026/07/p30_sq-1024x1024.jpg)
![[Obayashi] MTP2022 KPIs — Operating Profit ~2x Target, ROE 14.4%](https://japan-equity.com/wp-content/uploads/2026/07/p25_sq-1024x1024.jpg)
![[Obayashi] Cash Allocation — ¥420bn Investment CF Over Five Years](https://japan-equity.com/wp-content/uploads/2026/07/p26_sq-1024x1024.jpg)
![[Obayashi] Green Energy — 44 Plants, 344MW, and the Green Hydrogen Challenge](https://japan-equity.com/wp-content/uploads/2026/07/p21_sq-1024x1024.jpg)
![[Obayashi] Tackling the Labor Shortage — Robotics Construction®](https://japan-equity.com/wp-content/uploads/2026/07/p14_sq-1024x1024.jpg)
