
This article is based on publicly available IR materials and is not a recommendation to buy or sell any specific securities.
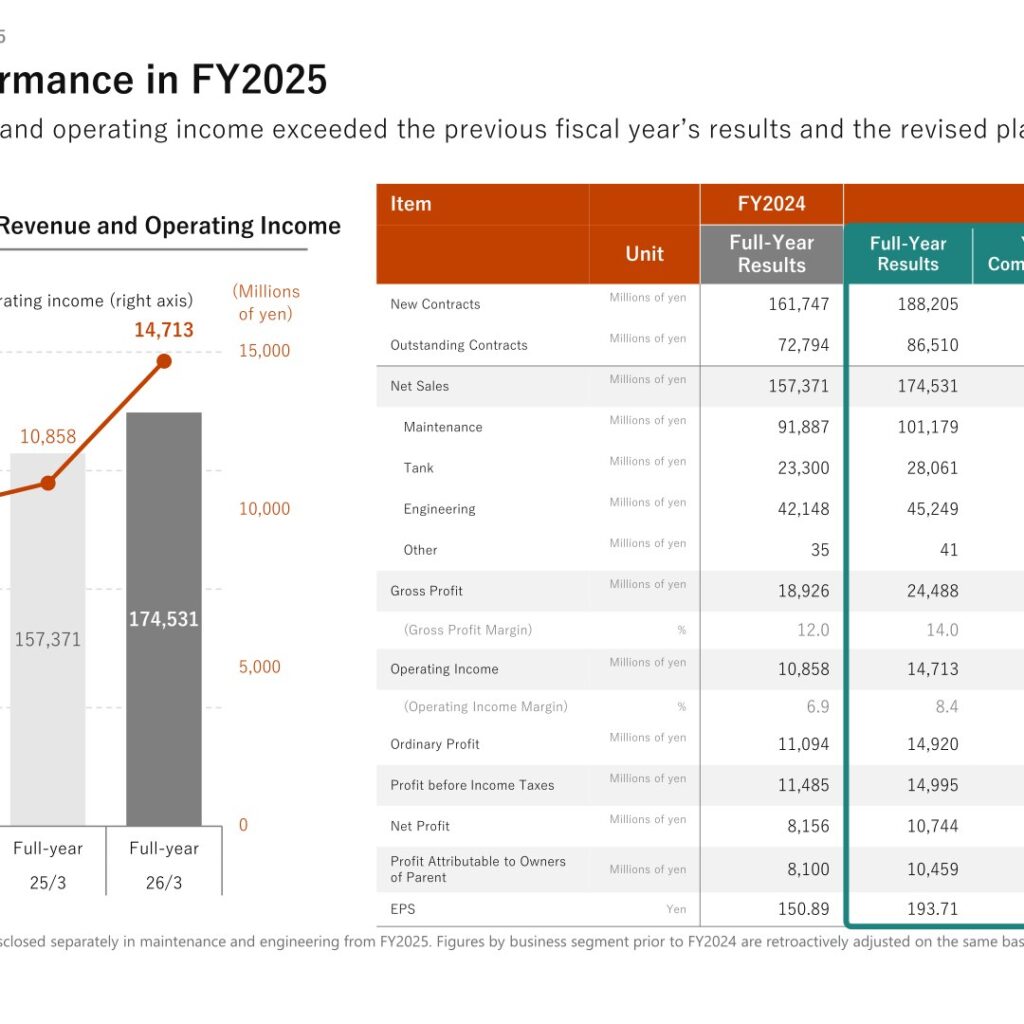
RAIZNEXT Corporation released “FY2025 Consolidated Results (Fiscal Year Ended March 31, 2026)” on May 13, 2026. For FY2025, net sales increased to 174.5 billion yen (up 10.9% YoY), while operating profit rose to 14.7 billion yen (up 35.5% YoY), both exceeding the previous fiscal year’s results and the revised plan. Growth was driven by additional work related to periodic repair work and an increase in maintenance projects. New contracts were 188.2 billion yen (up 16.4% YoY), and company-wide outstanding contracts at the end of the fourth quarter totaled 86.5 billion yen, up 18.8% YoY.
Consolidated Results (Full-Year Actual)
Gross profit margin improved as the Company continued selective orders with a focus on profitability, in addition to the elimination of one-time RS-related expenses incurred in the previous fiscal year. Combined with increased project volume, these factors contributed to a significant growth in operating profit. Compared with the revised forecast announced at the time of the FY2025 Q2 results, new contracts exceeded the forecast by 11.4%, net sales by 3.9%, and operating profit by 6.6%. SG&A expenses increased to 9.7 billion yen, up 21.2% YoY, reflecting increases in personnel expenses and depreciation associated with significant growth in net sales as well as advertising expenses aimed at strengthening recruitment activities.
| Item (Millions of yen unless noted) | FY2024 Full-Year Results | FY2025 Full-Year Results | YoY Comparison | FY2025 Revised Plan | Vs. Plan |
|---|---|---|---|---|---|
| New Contracts | 161,747 | 188,205 | +16.4% | 169,000 | +11.4% |
| Outstanding Contracts | 72,794 | 86,510 | +18.8% | 73,794 | +17.2% |
| Net Sales | 157,371 | 174,531 | +10.9% | 168,000 | +3.9% |
| Gross Profit | 18,926 | 24,488 | +29.4% | 23,100 | +6.0% |
| (Gross Profit Margin) % | 12.0 | 14.0 | +2.0pt | 13.8 | +0.2pt |
| Operating Income | 10,858 | 14,713 | +35.5% | 13,800 | +6.6% |
| (Operating Income Margin) % | 6.9 | 8.4 | +1.5pt | 8.2 | +0.2pt |
| Ordinary Profit | 11,094 | 14,920 | +34.5% | 14,000 | +6.6% |
| Profit before Income Taxes | 11,485 | 14,995 | +30.6% | – | – |
| Net Profit | 8,156 | 10,744 | +31.7% | – | – |
| Profit Attributable to Owners of Parent | 8,100 | 10,459 | +29.1% | 9,300 | +12.5% |
| EPS (Yen) | 150.89 | 193.71 | +28.4% | 172.27 | +12.4% |
Segment Results
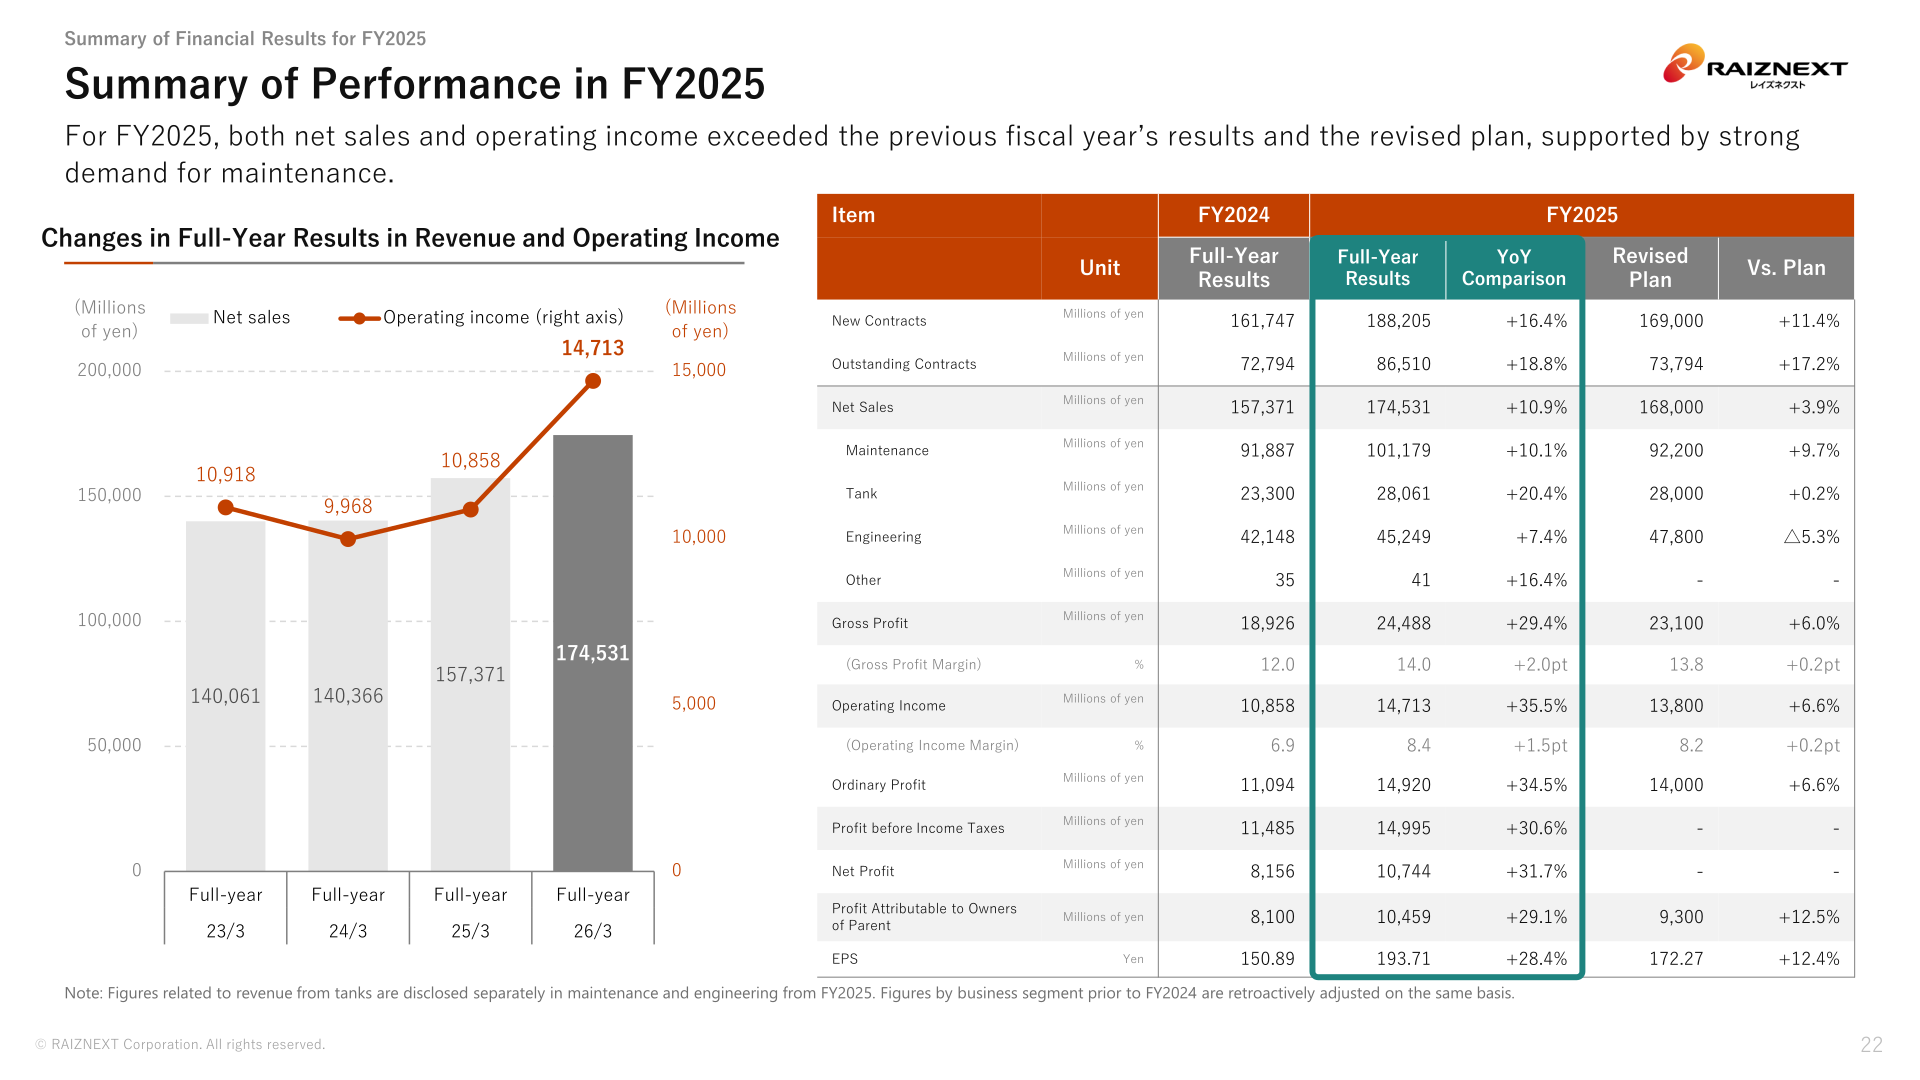
In FY2025, the Maintenance Business and Tank Business drove growth in both net sales and new contracts. In the Maintenance Business, increases in additional work and maintenance work volume associated with periodic repair work drove higher net sales, while additional work related to periodic repair work and the partial advance recording of projects for FY2026 contributed to new contracts. In the Engineering Business, while net sales exceeded the previous fiscal year’s performance due to contributions from large-scale projects, they fell short of the Company’s plan as a result of the timing of revenue recognition under the percentage-of-completion method; new contracts declined year on year but exceeded the Company’s plan thanks to contributions from large-scale projects. Figures related to revenue from tanks are disclosed separately in Maintenance and Engineering from FY2025, and figures by business segment prior to FY2024 are retroactively adjusted on the same basis.
| Segment (Millions of yen) | Net Sales FY2025 | Net Sales FY2024 | New Contracts FY2025 | New Contracts FY2024 |
|---|---|---|---|---|
| Maintenance | 101,179 | 91,887 | 114,205 | 92,291 |
| Tank | 28,061 | 23,300 | 32,327 | 24,558 |
| Engineering | 45,249 | 42,148 | 41,673 | 44,896 |
| Other | 41 | 35 | – | – |
| Total | 174,531 | 157,371 | 188,205 | 161,747 |
FY2026 Plan
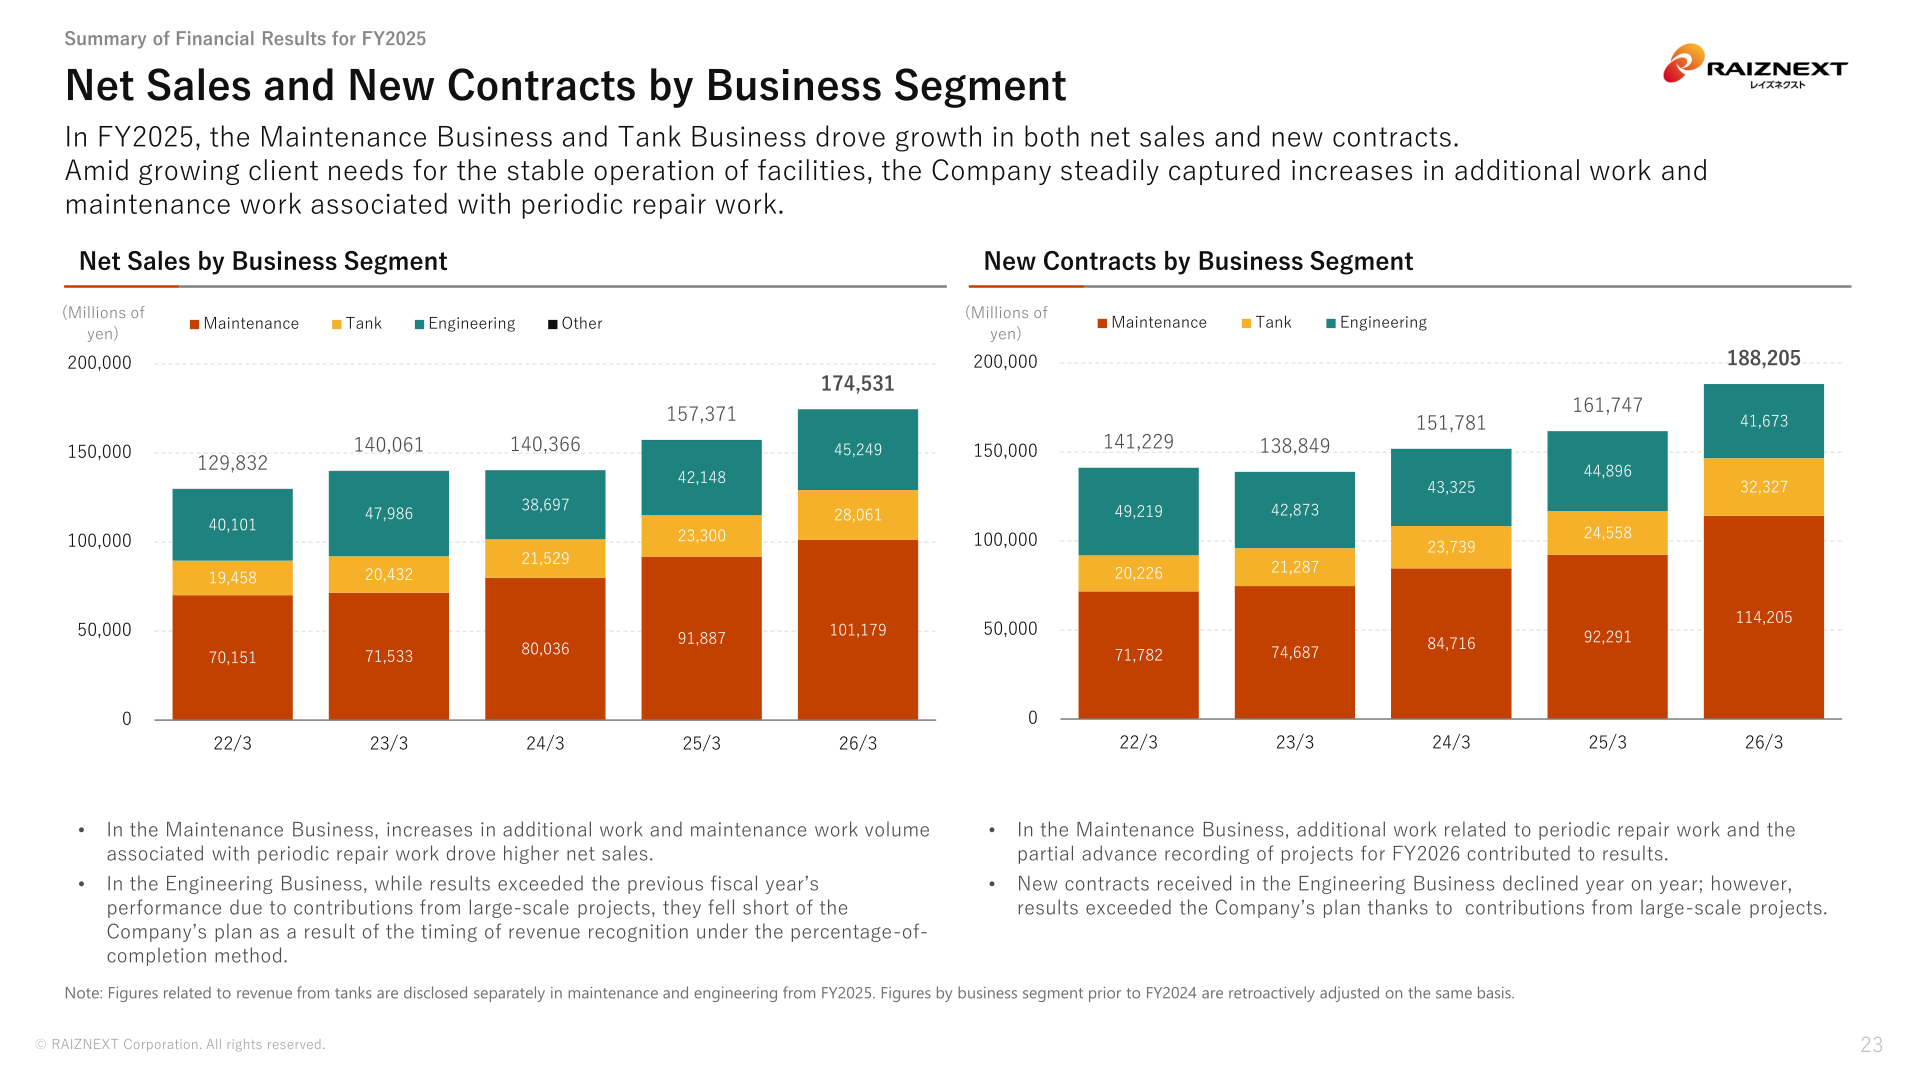
The plan for FY2026 was formulated based only on projects currently foreseeable, taking into account uncertainty in the external environment, in addition to the impact of certain projects being recorded ahead of schedule in FY2025. As a result, the Company expects flat net sales and lower profit. Regarding the impact of the situation in the Middle East, the Company has incorporated a certain degree of risk such as delays in project completion, but does not anticipate an expansion in maintenance demand associated with unplanned crude oil tank drawdowns. The Company does not expect the improvement in the gross profit margin driven by increases in additional work seen in the previous fiscal year to continue, while SG&A expenses are expected to increase due to the recording of investments in human capital and other initiatives aimed at expanding supply capacity. Based on the cycle of periodic repair work, the completion of large-scale projects is expected to be concentrated in the second half of FY2026.
| Item (Millions of yen unless noted) | FY2026 Plan (Full-Year) | FY2025 Results (Full-Year) | FY2025 Comparison |
|---|---|---|---|
| New Contracts | 167,000 | 188,205 | △11.3% |
| New Contracts: Maintenance | 87,500 | 114,205 | △23.4% |
| New Contracts: Tank | 24,100 | 32,327 | △25.4% |
| New Contracts: Engineering | 55,400 | 41,673 | +32.9% |
| Outstanding Contracts | 78,510 | 86,510 | △9.2% |
| Net Sales | 175,000 | 174,531 | +0.3% |
| Net Sales: Maintenance | 98,600 | 101,179 | △2.5% |
| Net Sales: Tank | 26,900 | 28,061 | △4.1% |
| Net Sales: Engineering | 49,500 | 45,249 | +9.4% |
| Gross Profit | 23,900 | 24,488 | △2.4% |
| (Gross Profit Margin) % | 13.7 | 14.0 | △0.3pt |
| Operating Income | 13,000 | 14,713 | △11.6% |
| (Operating Income Margin) % | 7.4 | 8.4 | △1.0pt |
| Ordinary Profit | 13,250 | 14,920 | △11.2% |
| Profit Attributable to Owners of Parent | 9,000 | 10,459 | △14.0% |
| EPS (Yen) | 166.67 | 193.71 | △14.0% |
Shareholder Returns
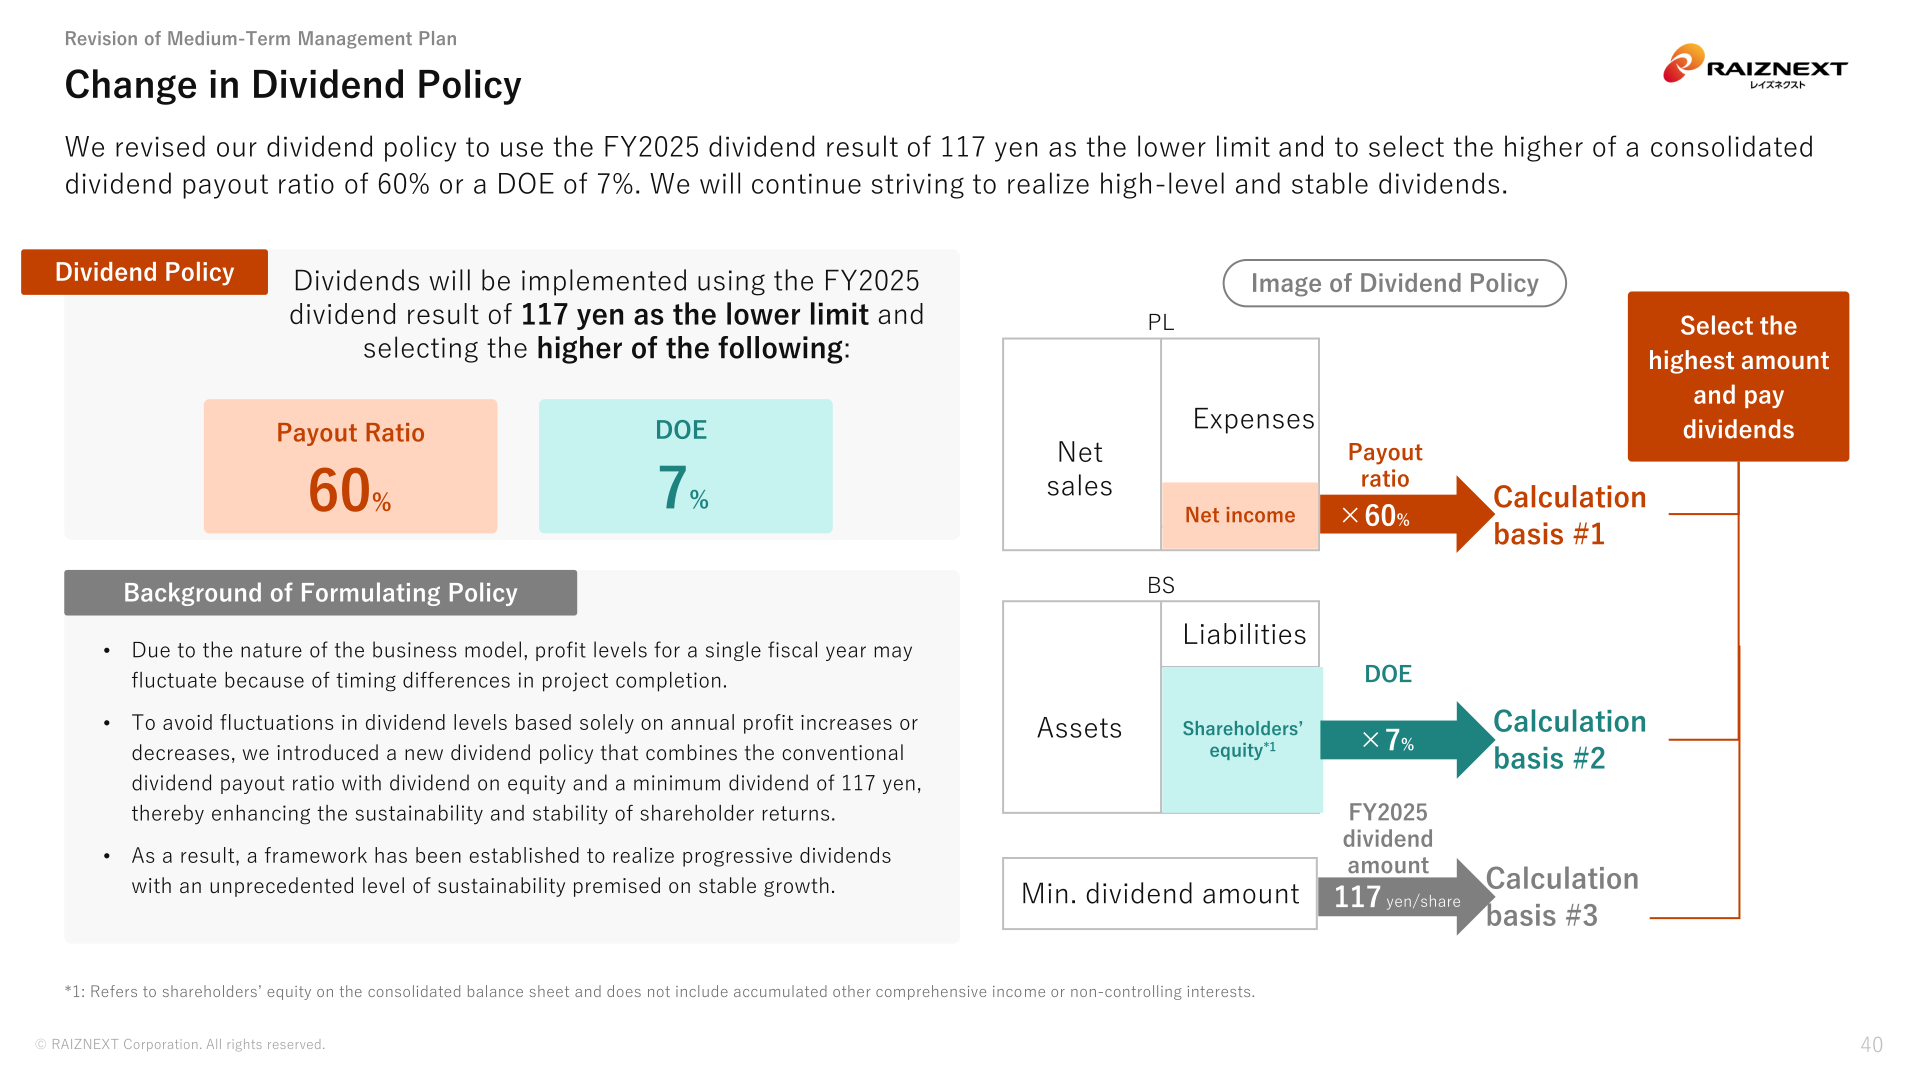
DPS for FY2025 was 117.00 yen (interim dividend 45.00 yen, year-end dividend 72.00 yen), with a dividend payout ratio of 60.4%. The Company revised its dividend policy to use the FY2025 dividend result of 117 yen as the lower limit and to select the higher of a consolidated dividend payout ratio of 60% or a DOE of 7%. It explains that, due to the nature of the business model, profit levels for a single fiscal year may fluctuate because of timing differences in project completion, and that combining the conventional dividend payout ratio with dividend on equity and a minimum dividend of 117 yen enhances the sustainability and stability of shareholder returns. Alongside this, the Company announced a capital allocation policy that prioritizes allocation to shareholder returns and growth investment, using approximately 27.0 billion yen in operating cash flow generated during FY2026 to FY2028 together with up to approximately 10.0 billion yen through borrowing and sale of cross-shareholdings as funding sources. A dividend forecast for FY2026 cannot be confirmed from the materials.
| Item | FY2023 Results | FY2024 Results | FY2025 Results |
|---|---|---|---|
| DPS (Yen) | 135.00 | 91.00 | 117.00 |
| Interim Dividend (Yen) | 30.00 | 35.00 | 45.00 |
| Year-End Dividend (Yen) | 105.00 | 56.00 | 72.00 |
| Dividend Payout Ratio (%) | 100.6 | 60.3 | 60.4 |
Note: Please note that the DPS and year-end dividend for FY2023 include a special dividend (65.00 yen).
Revision of the Medium-Term Management Plan
In response to significant changes in the business environment since the formulation of the Third Medium-Term Management Plan, the Company rebuilt its growth strategy and revised upward its performance targets for FY2028, the final year of the plan. The growth strategy uses existing sites as the core to expand order domains within clients, across regions and across clients; expands domains from existing facility modifications to new decarbonization-related facilities such as cryogenic tanks; and expands supply capacity through human capital investment, M&A, and DX/mechanization. The ROE target was raised from more than 9.5% to more than 10.0%; ROE was 11.9% in FY2025, against an estimated cost of shareholders’ equity of 6.0 to 7.0%.
| Item | FY2028 (after Revision) | FY2028 (before Revision) | Percent Revision |
|---|---|---|---|
| Net Sales | 195.0 billion yen | 171.0 billion yen | +14.0% |
| Operating Income | 16.3 billion yen | 13.6 billion yen | +19.9% |
| Net Income | 11.2 billion yen | 9.3 billion yen | +20.4% |
| ROE | Over 10% | Over 9.5% | ー |
This article is an analysis based on publicly available information and is not a recommendation to buy or sell any specific securities. Investment decisions are your own responsibility.
![[Obayashi] Investors’ Guide 2026 — The Complete 24-Article Breakdown](https://japan-equity.com/wp-content/uploads/2026/07/hub_cover-1024x1024.png)
![[Obayashi] IR & SR Policy — Feeding Dialogue Back into Management](https://japan-equity.com/wp-content/uploads/2026/07/p32_sq-1024x1024.jpg)
![[Obayashi] Real Estate Development — 18.7% Margin, ¥287.7bn Unrealized Gains](https://japan-equity.com/wp-content/uploads/2026/07/p20_sq-1024x1024.jpg)
![[Obayashi] Domestic Civil Engineering — Resilience Spending Supports 9.6% Margin](https://japan-equity.com/wp-content/uploads/2026/07/p11_sq-1024x1024.jpg)
![[Obayashi] Share Price & External Ratings — vs TOPIX, ESG Index Inclusion](https://japan-equity.com/wp-content/uploads/2026/07/p40_sq-1024x1024.jpg)
![[Construction] ¥75.5tn Investment, Shrinking Workforce — Big-5 Market Share](https://japan-equity.com/wp-content/uploads/2026/07/p12_sq-1024x1024.jpg)



![[Obayashi] Capital Policy & Shareholder Returns — ROE 10%+, DOE ~5%, ¥100bn Buyback](https://japan-equity.com/wp-content/uploads/2026/07/p27_sq-1024x1024.jpg)
![[Obayashi] Reducing Cross-Shareholdings — ¥285.2bn Sold in Five Years](https://japan-equity.com/wp-content/uploads/2026/07/p29_sq-1024x1024.jpg)
![[Obayashi] ¥750bn Investment Plan — ¥300bn to Development, ¥190bn to Tech/DX](https://japan-equity.com/wp-content/uploads/2026/07/p30_sq-1024x1024.jpg)
![[Obayashi] MTP2022 KPIs — Operating Profit ~2x Target, ROE 14.4%](https://japan-equity.com/wp-content/uploads/2026/07/p25_sq-1024x1024.jpg)
![[Obayashi] Cash Allocation — ¥420bn Investment CF Over Five Years](https://japan-equity.com/wp-content/uploads/2026/07/p26_sq-1024x1024.jpg)
![[Obayashi] Green Energy — 44 Plants, 344MW, and the Green Hydrogen Challenge](https://japan-equity.com/wp-content/uploads/2026/07/p21_sq-1024x1024.jpg)
![[Obayashi] Tackling the Labor Shortage — Robotics Construction®](https://japan-equity.com/wp-content/uploads/2026/07/p14_sq-1024x1024.jpg)
