
This article is based on publicly available IR materials and is not a recommendation to buy or sell any specific securities.
Note: Komori labels the fiscal year ended March 31, 2026 as “FY2026” in its results presentation; this article follows the site’s title convention of “FY2025” for the most recently completed fiscal year, while all figures, tables and year labels below are kept exactly as the company presents them.
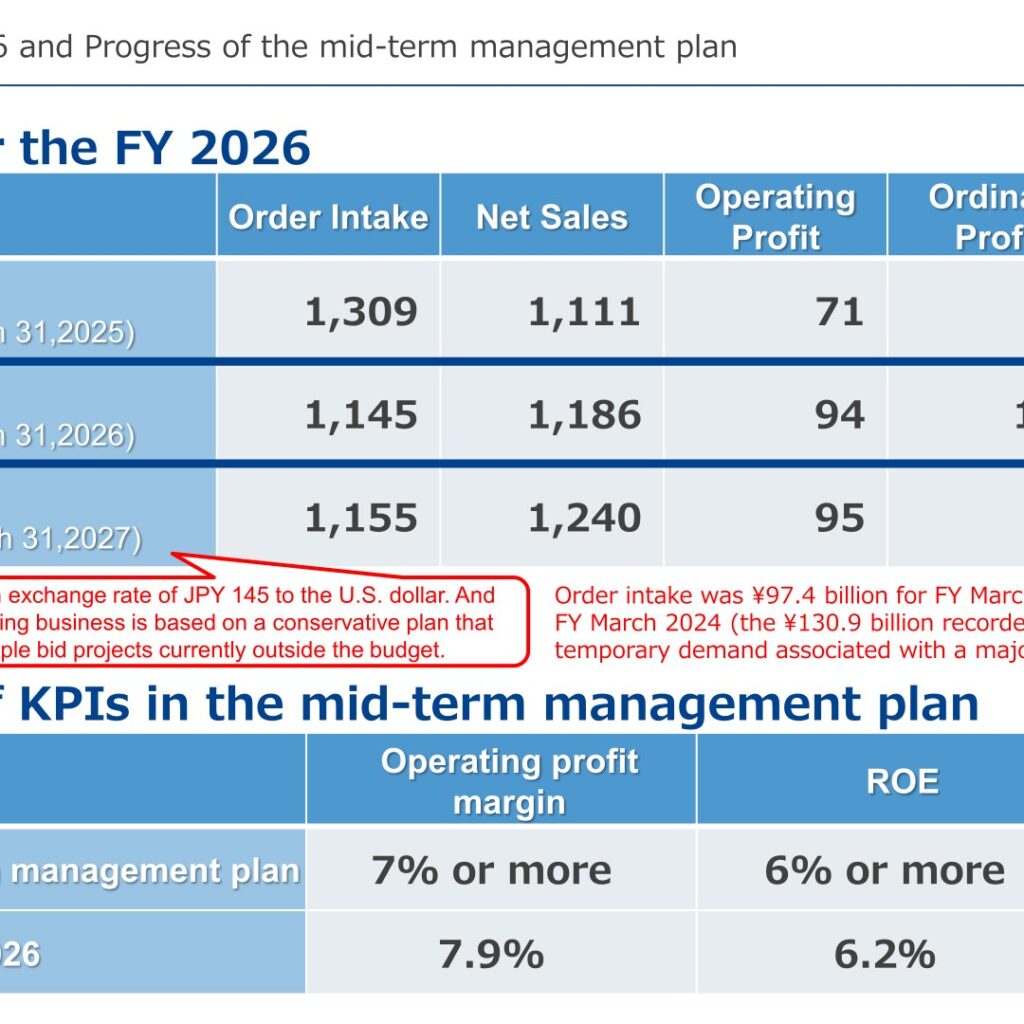
Komori Corporation reported net sales of 1,186 (100 million yen) for FY2026, the fiscal year ended March 31, 2026, against 1,111 in FY2025, with operating profit of 94 versus 71, ordinary profit of 107 versus 76 and profit attributable to owners of parent of 74 versus 72. Order intake came in at 1,145 against 1,309 a year earlier; the presentation notes that order intake was 97.4 billion yen for FY March 2023 and 99.1 billion yen for FY March 2024, and that the 130.9 billion yen recorded for FY March 2025 reflects temporary demand associated with a major international exhibition. Against the FY2026 budget, net sales came in at 95% and order intake at 96%, while operating profit reached 103%, ordinary profit 120% and profit attributable to owners of parent 116%.
Consolidated Results (Full-Year Actual)
Operating profit margin for FY2026 was 7.9% and ROE was 6.2%, against KPIs in the mid-term management plan of 7% or more and 6% or more respectively. Average exchange rates for FY2026 were USD 150.97 and EUR 174.54, compared with USD 152.48 and EUR 163.62 in FY2025; end-of-term rates were USD 159.88 and EUR 183.41, against USD 149.52 and EUR 162.08 a year earlier.
| Item (100 million yen) | FY2026 (2026/3) | FY2025 (2025/3) | Change | vs. FY2025 | Budget FY2026 | vs. Budget |
|---|---|---|---|---|---|---|
| Order intake | 1,145 | 1,309 | -164 | 87% | 1,190 | 96% |
| Net sales | 1,186 | 1,111 | 76 | 107% | 1,245 | 95% |
| Operating profit | 94 | 71 | 23 | 132% | 91 | 103% |
| Ordinary profit | 107 | 76 | 31 | 140% | 89 | 120% |
| Profit attributable to owners of parent | 74 | 72 | 2 | 102% | 64 | 116% |
Order Intake by Region and Model
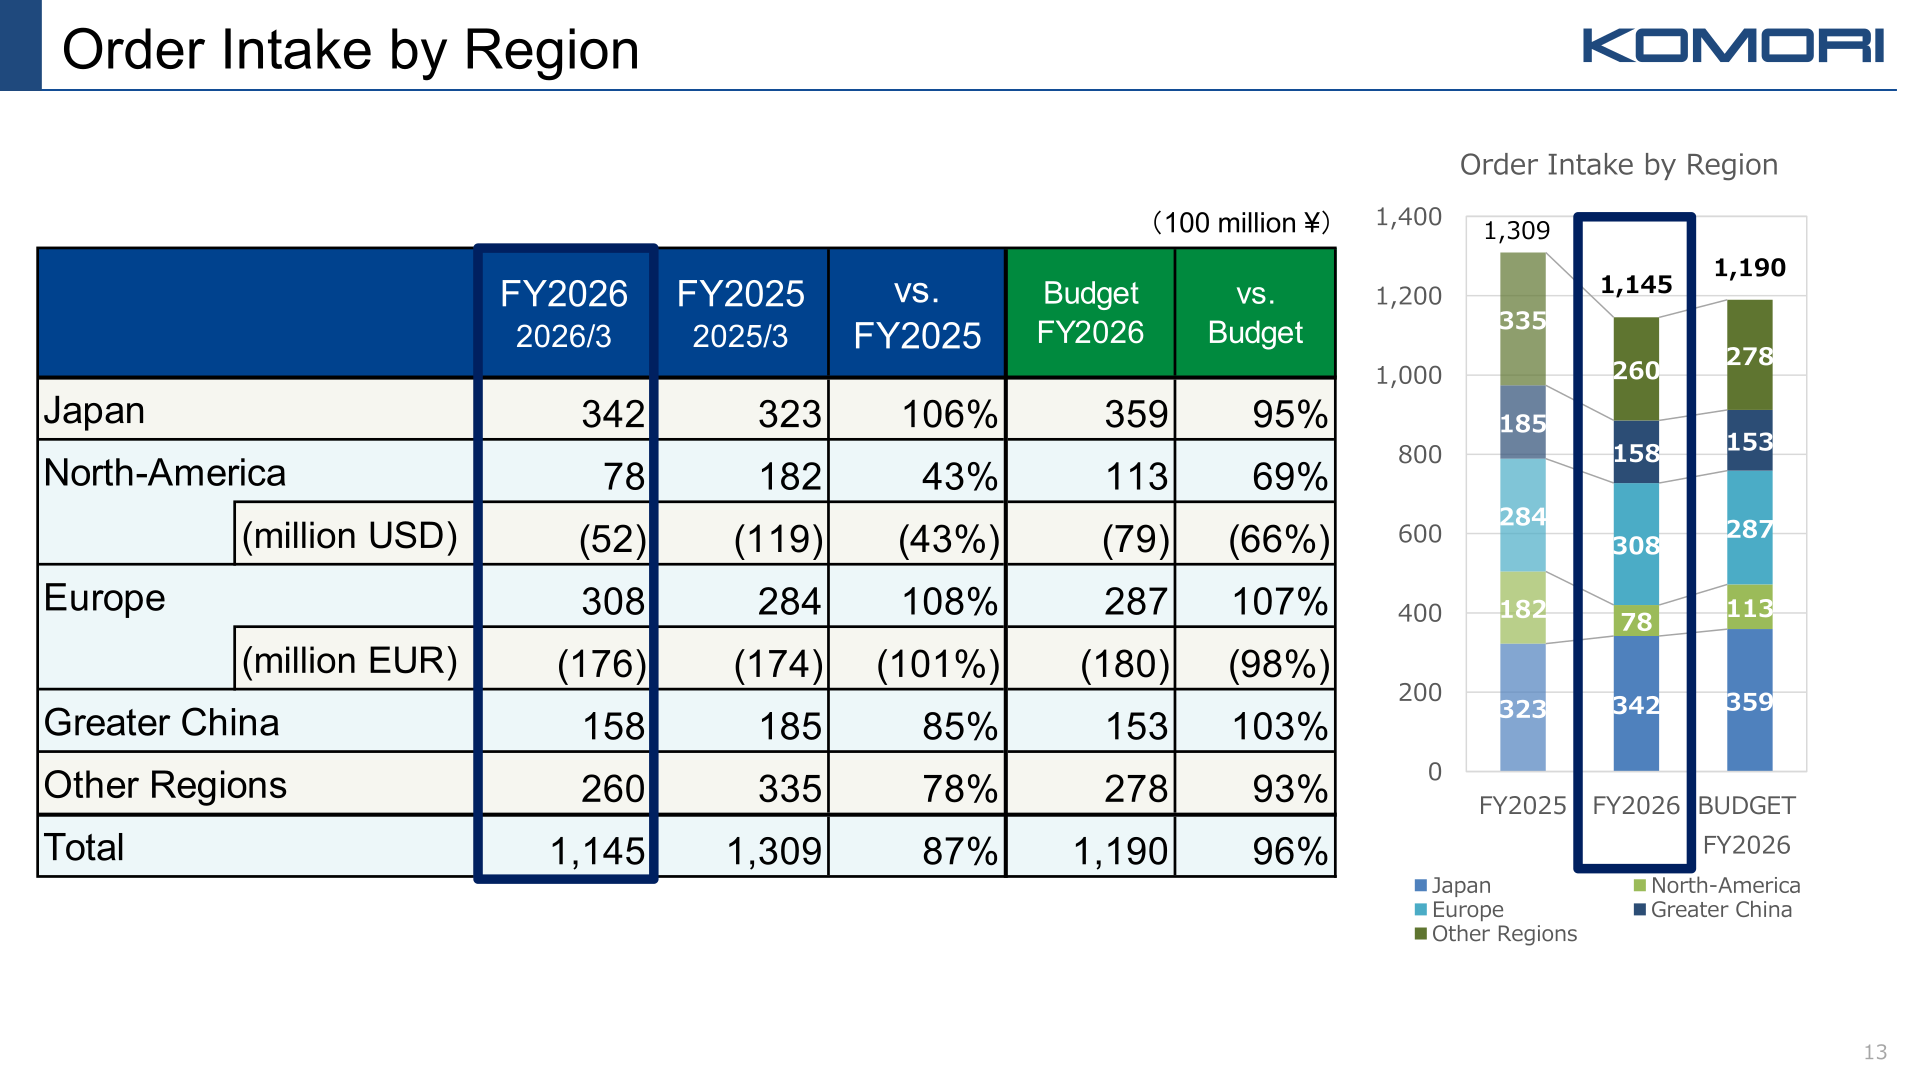
By region, order intake in Japan was 342 against 323 in FY2025, Europe 308 against 284, while North-America fell to 78 from 182, Greater China to 158 from 185 and Other Regions to 260 from 335. In local-currency terms, North-America order intake was 52 million USD against 119 million USD, and Europe 176 million EUR against 174 million EUR. By model, Sheet-fed offset presses were 530 against 680 and DPS, PE & Others 144 against 166, while Web offset presses & Security presses were 217 against 241 and Maintenance & Repair rose to 255 from 222. Order backlog stood at 757 (100 million yen) at the end of 4Q of 2026/3, compared with 766 at the end of 4Q of 2025/3.
| Order Intake by Region (100 million yen) | FY2026 (2026/3) | FY2025 (2025/3) | vs. FY2025 | Budget FY2026 | vs. Budget |
|---|---|---|---|---|---|
| Japan | 342 | 323 | 106% | 359 | 95% |
| North-America | 78 | 182 | 43% | 113 | 69% |
| North-America (million USD) | (52) | (119) | (43%) | (79) | (66%) |
| Europe | 308 | 284 | 108% | 287 | 107% |
| Europe (million EUR) | (176) | (174) | (101%) | (180) | (98%) |
| Greater China | 158 | 185 | 85% | 153 | 103% |
| Other Regions | 260 | 335 | 78% | 278 | 93% |
| Total | 1,145 | 1,309 | 87% | 1,190 | 96% |
Net Sales by Region and Model
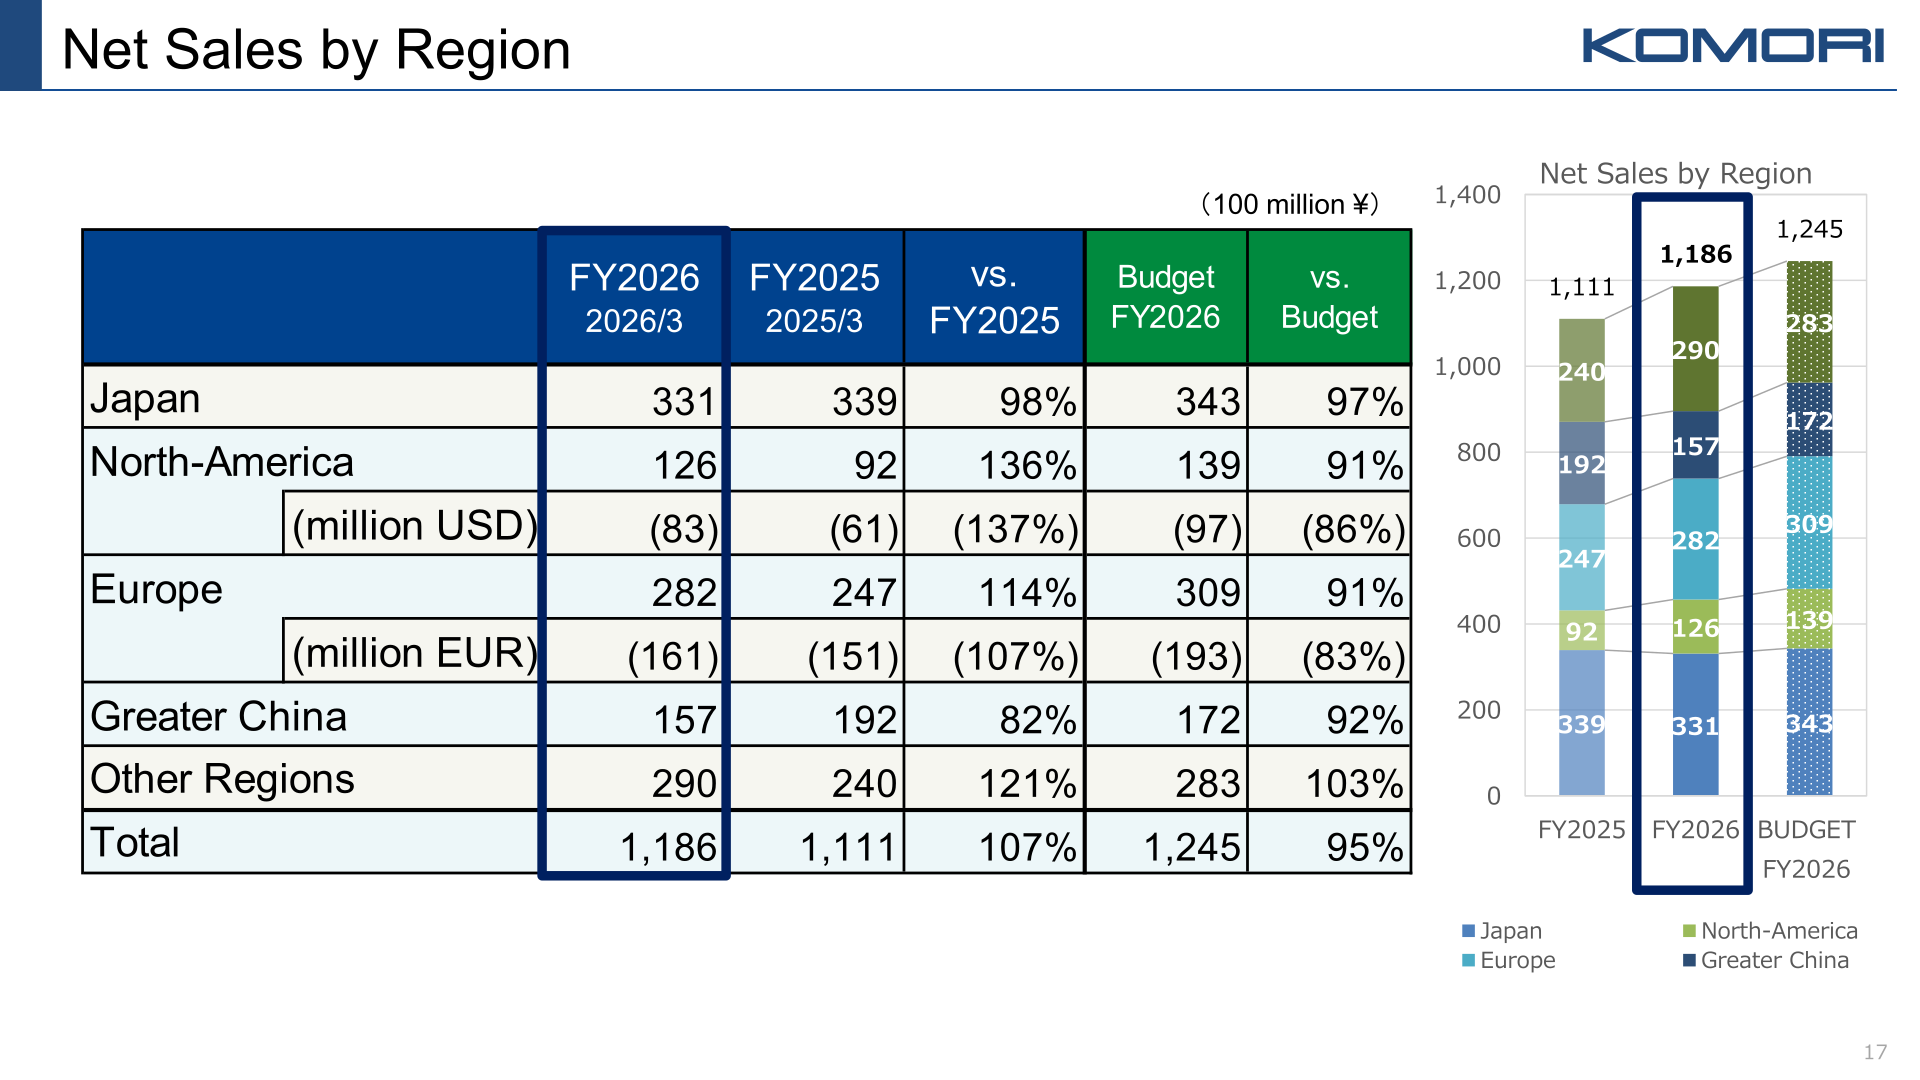
Net sales rose in North-America to 126 from 92, in Europe to 282 from 247 and in Other Regions to 290 from 240, while Japan was 331 against 339 and Greater China 157 against 192. In local-currency terms, North-America net sales were 83 million USD against 61 million USD and Europe 161 million EUR against 151 million EUR. By model, Sheet-fed offset presses were 650 against 537 and Maintenance & Repair 232 against 223, while Web offset presses & Security presses were 155 against 180 and DPS, PE & Others 150 against 171.
| Net Sales by Region (100 million yen) | FY2026 (2026/3) | FY2025 (2025/3) | vs. FY2025 | Budget FY2026 | vs. Budget |
|---|---|---|---|---|---|
| Japan | 331 | 339 | 98% | 343 | 97% |
| North-America | 126 | 92 | 136% | 139 | 91% |
| North-America (million USD) | (83) | (61) | (137%) | (97) | (86%) |
| Europe | 282 | 247 | 114% | 309 | 91% |
| Europe (million EUR) | (161) | (151) | (107%) | (193) | (83%) |
| Greater China | 157 | 192 | 82% | 172 | 92% |
| Other Regions | 290 | 240 | 121% | 283 | 103% |
| Total | 1,186 | 1,111 | 107% | 1,245 | 95% |
| Net Sales by Model (100 million yen) | FY2026 (2026/3) | FY2025 (2025/3) | vs. FY2025 | Budget FY2026 | vs. Budget |
|---|---|---|---|---|---|
| Sheet-fed offset presses | 650 | 537 | 121% | 629 | 103% |
| Web offset presses & Security presses | 155 | 180 | 86% | 185 | 84% |
| Maintenance & Repair | 232 | 223 | 104% | 223 | 104% |
| DPS, PE & Others | 150 | 171 | 87% | 209 | 72% |
| Total | 1,186 | 1,111 | 107% | 1,245 | 95% |
FY2027 Forecast
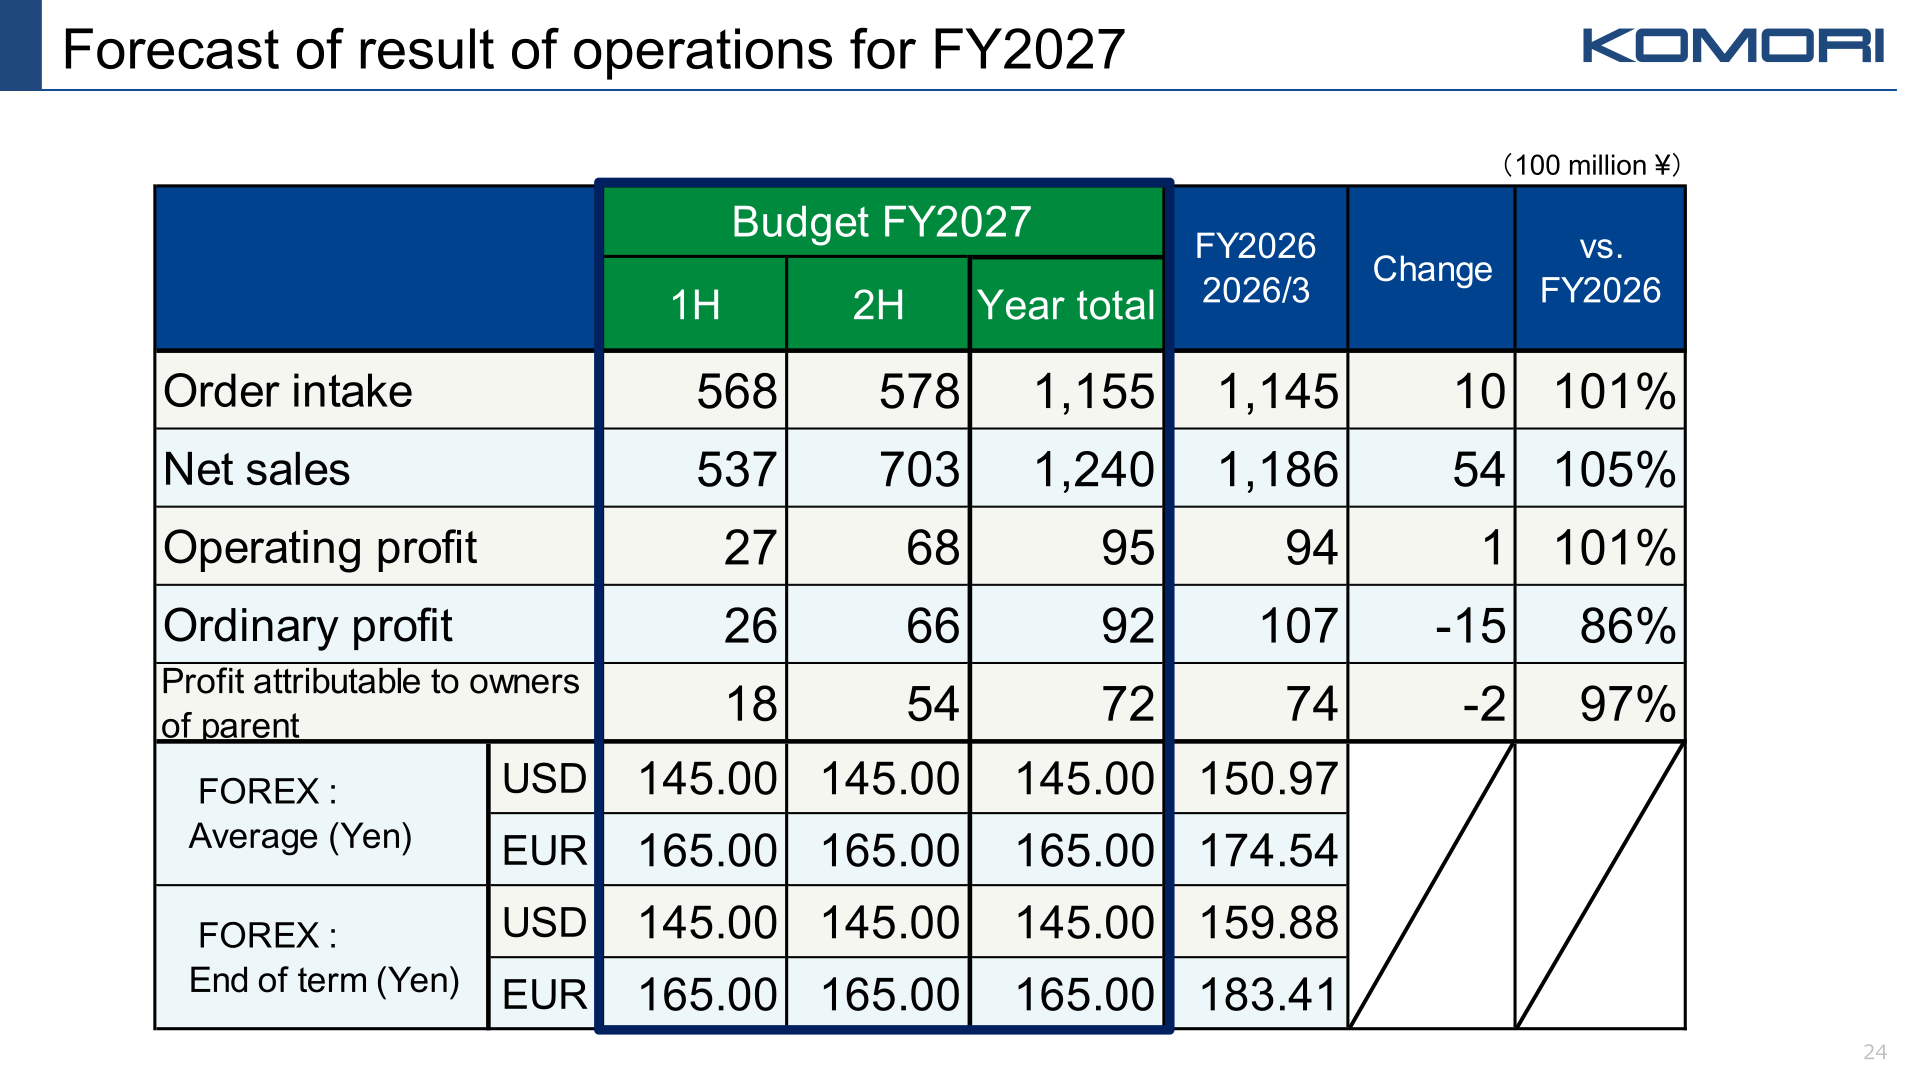
For FY2027, the fiscal year ending March 31, 2027, Komori budgets order intake of 1,155, net sales of 1,240, operating profit of 95, ordinary profit of 92 and profit attributable to owners of parent of 72. The presentation states that the company assumes an exchange rate of JPY 145 to the U.S. dollar, and that the Securities Printing business is based on a conservative plan that excludes multiple bid projects currently outside the budget. Assumed rates in the budget are USD 145.00 and EUR 165.00 for both average and end-of-term. By region, net sales are budgeted at 360 in Japan, 142 in North-America, 317 in Europe, 165 in Greater China and 257 in Other Regions; by model, 599 for Sheet-fed offset presses, 178 for Web offset presses & Security presses, 251 for Maintenance & Repair and 213 for DPS, PE & Others.
| Item (100 million yen) | Budget FY2027 (Year total) | FY2026 (2026/3) | Change | vs. FY2026 |
|---|---|---|---|---|
| Order intake | 1,155 | 1,145 | 10 | 101% |
| Net sales | 1,240 | 1,186 | 54 | 105% |
| Operating profit | 95 | 94 | 1 | 101% |
| Ordinary profit | 92 | 107 | -15 | 86% |
| Profit attributable to owners of parent | 72 | 74 | -2 | 97% |
Shareholder Returns
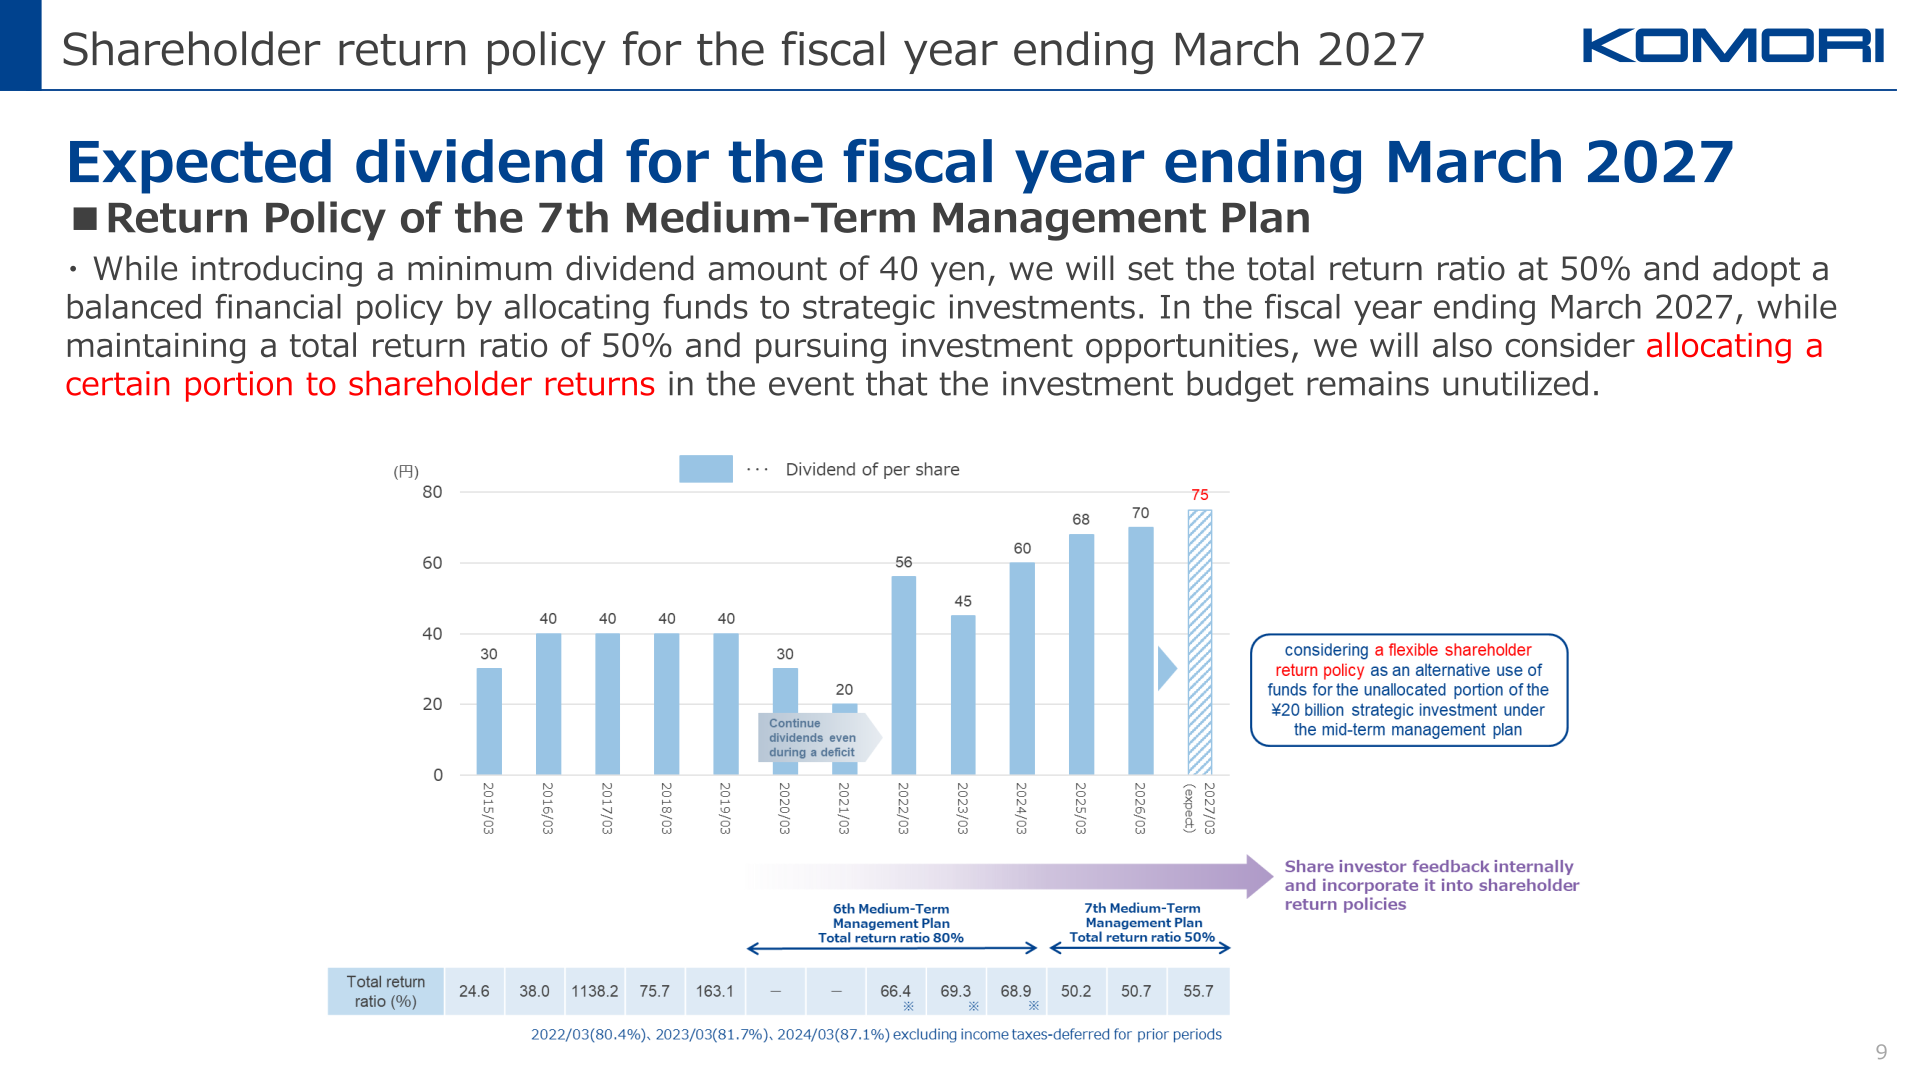
Under the return policy of the 7th Medium-Term Management Plan, Komori states that while introducing a minimum dividend amount of 40 yen, it will set the total return ratio at 50% and adopt a balanced financial policy by allocating funds to strategic investments; in the fiscal year ending March 2027, while maintaining a total return ratio of 50% and pursuing investment opportunities, it will also consider allocating a certain portion to shareholder returns in the event that the investment budget remains unutilized. The dividend per share was 70 yen for 2026/03, with a total return ratio of 50.7%, after 68 yen for 2025/03 (50.2%); the expected dividend for 2027/03 is 75 yen, with a total return ratio of 55.7%. The slide also notes that the company is considering a flexible shareholder return policy as an alternative use of funds for the unallocated portion of the 20 billion yen strategic investment under the mid-term management plan.
Balance Sheet, Cash Flows and Investment
Total assets stood at 1,782 (100 million yen) at March 31, 2026, up 52 from 1,729 a year earlier, and net assets at 1,229, up 74 from 1,155. Cash, deposits and securities were 544 against 595, inventories 446 against 425, and total liabilities 553 against 574. Capital expenditures were 4,900 million yen in FY2026 against 2,601 million yen in FY2025, depreciation and amortization 2,278 million yen against 2,298 million yen, and R&D expenses 4,634 million yen (3.9% to net sales) against 4,044 million yen (3.6%). The number of employees was 2,622. For FY2027 the company forecasts capital expenditures of 4,200 million yen, depreciation and amortization of 2,400 million yen, R&D expenses of 4,600 million yen (3.7% to net sales) and 2,660 employees.
| Cash Flows (100 million yen) | FY2025 (2025/3) | FY2026 (2026/3) | Change |
|---|---|---|---|
| Net cash provided by (used in) operating activities | 170 | 35 | -135 |
| Net cash provided by (used in) investing activities | -48 | -29 | 19 |
| Net cash provided by (used in) financing activities | -43 | -61 | -18 |
| Cash and cash equivalents at end of period | 574 | 529 | -45 |
Medium-Term Management Plan
The presentation compares the funding plan under the 7th Medium-Term Management Plan with progress through the final year (the FY ending March 2027 plan). The plan assumed net income of 160, reduction of cash of 70 and depreciation of 50 on the cash outflow plan side, against shareholder returns of 80 at a total return ratio of 50%, regular investments of 50 and new strategic investments of 150 on the cash inflow plan side. Progress shows net income of 218, cash surplus and changes in working capital etc. of 23 and depreciation of 70, against shareholder returns of 114, regular investments of 117, new investments of 30 and 50 unused. Komori states that net income, depreciation, shareholder returns and regular investments have generally progressed in line with the plan, exceeding initial assumptions, and that while it will continue selecting new strategic investment opportunities, including M&A, it will consider allocating a certain portion to shareholder returns if such investments are not fully executed.
This article is an analysis based on publicly available information and is not a recommendation to buy or sell any specific securities. Investment decisions are your own responsibility.
![[Obayashi] Investors’ Guide 2026 — The Complete 24-Article Breakdown](https://japan-equity.com/wp-content/uploads/2026/07/hub_cover-1024x1024.png)
![[Obayashi] IR & SR Policy — Feeding Dialogue Back into Management](https://japan-equity.com/wp-content/uploads/2026/07/p32_sq-1024x1024.jpg)
![[Obayashi] Domestic Civil Engineering — Resilience Spending Supports 9.6% Margin](https://japan-equity.com/wp-content/uploads/2026/07/p11_sq-1024x1024.jpg)
![[Obayashi] Overseas Construction — Orders Reach ¥1.2tn](https://japan-equity.com/wp-content/uploads/2026/07/p15_sq-1024x1024.jpg)
![[Obayashi] Share Price & External Ratings — vs TOPIX, ESG Index Inclusion](https://japan-equity.com/wp-content/uploads/2026/07/p40_sq-1024x1024.jpg)
![[Construction] ¥75.5tn Investment, Shrinking Workforce — Big-5 Market Share](https://japan-equity.com/wp-content/uploads/2026/07/p12_sq-1024x1024.jpg)



![[Obayashi] Capital Policy & Shareholder Returns — ROE 10%+, DOE ~5%, ¥100bn Buyback](https://japan-equity.com/wp-content/uploads/2026/07/p27_sq-1024x1024.jpg)
![[Obayashi] Reducing Cross-Shareholdings — ¥285.2bn Sold in Five Years](https://japan-equity.com/wp-content/uploads/2026/07/p29_sq-1024x1024.jpg)
![[Obayashi] ¥750bn Investment Plan — ¥300bn to Development, ¥190bn to Tech/DX](https://japan-equity.com/wp-content/uploads/2026/07/p30_sq-1024x1024.jpg)
![[Obayashi] MTP2022 KPIs — Operating Profit ~2x Target, ROE 14.4%](https://japan-equity.com/wp-content/uploads/2026/07/p25_sq-1024x1024.jpg)
![[Obayashi] Cash Allocation — ¥420bn Investment CF Over Five Years](https://japan-equity.com/wp-content/uploads/2026/07/p26_sq-1024x1024.jpg)
![[Obayashi] Green Energy — 44 Plants, 344MW, and the Green Hydrogen Challenge](https://japan-equity.com/wp-content/uploads/2026/07/p21_sq-1024x1024.jpg)
![[Obayashi] Tackling the Labor Shortage — Robotics Construction®](https://japan-equity.com/wp-content/uploads/2026/07/p14_sq-1024x1024.jpg)
