
This article is based on publicly available IR materials and is not a recommendation to buy or sell any specific securities.
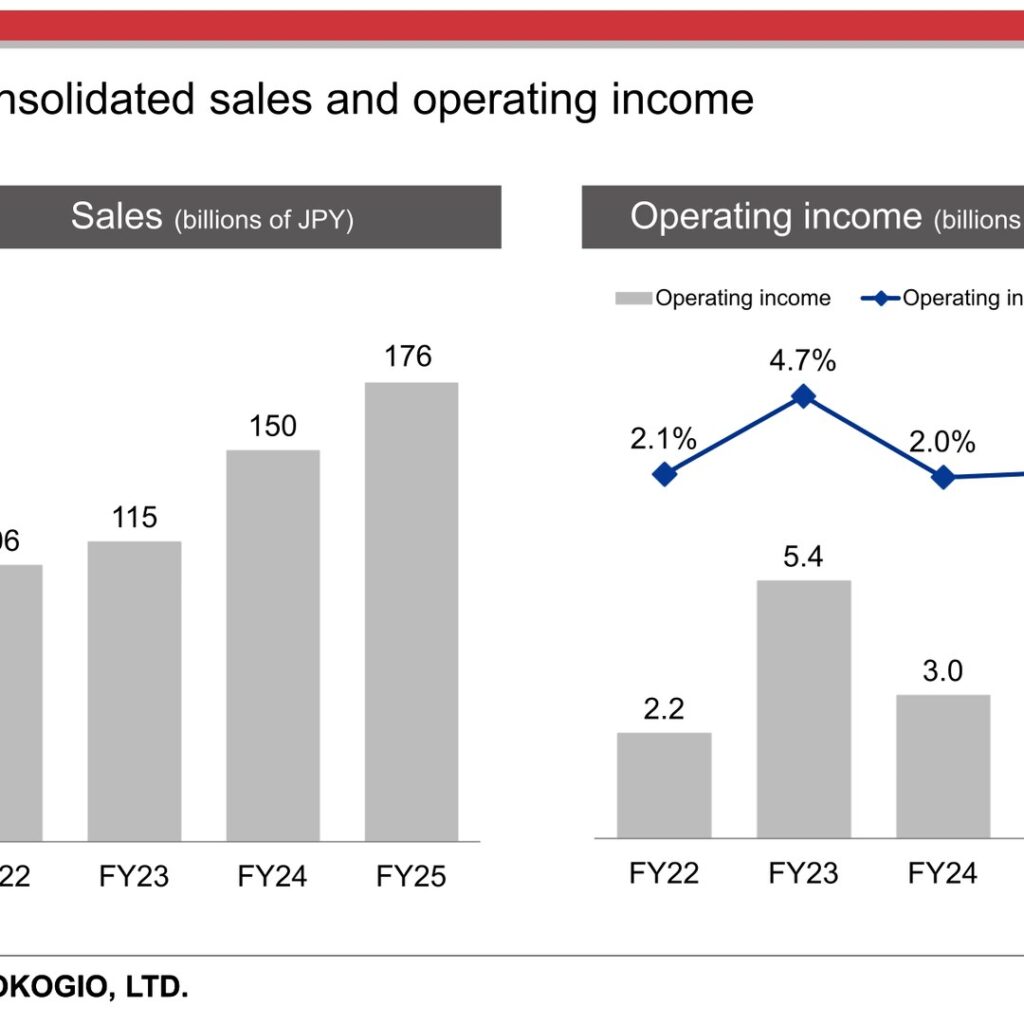
SINTOKOGIO, LTD. (securities code 6339) released its “Supplementary Materials for Summary of Consolidated Financial Results for the Fiscal Year Ended March 31, 2026” on May 13, 2026. Consolidated sales came to 176 billions of JPY in FY25, up from 150 billions of JPY in FY24, while operating income was 3.8 billions of JPY against 3.0 billions of JPY a year earlier, for an operating income ratio of 2.2%. Orders received rose to 159 billions of JPY, but the order backlog fell to 49 billions of JPY from 66 billions of JPY. Note: the materials label the fiscal year ended March 31, 2026 as “FY25”; the deck states that “FY” in this material indicates the fiscal year ending March 31 of the succeeding year. The labels in the tables below are kept exactly as reported.
Consolidated Results (Full-Year Actual)
The materials present consolidated sales and operating income as a four-year bar chart covering FY22 through FY25. Sales expanded in each of the four years shown, reaching 176 billions of JPY in FY25. Operating income of 3.8 billions of JPY in FY25 was above the 3.0 billions of JPY recorded in FY24, though still below the 5.4 billions of JPY of FY23. The operating income ratio was 2.2% in FY25, against 2.0% in FY24, 4.7% in FY23 and 2.1% in FY22.
| Item (billions of JPY) | FY22 | FY23 | FY24 | FY25 |
|---|---|---|---|---|
| Sales | 106 | 115 | 150 | 176 |
| Operating income | 2.2 | 5.4 | 3.0 | 3.8 |
| Operating income ratio | 2.1% | 4.7% | 2.0% | 2.2% |
Orders Received and Order Backlog
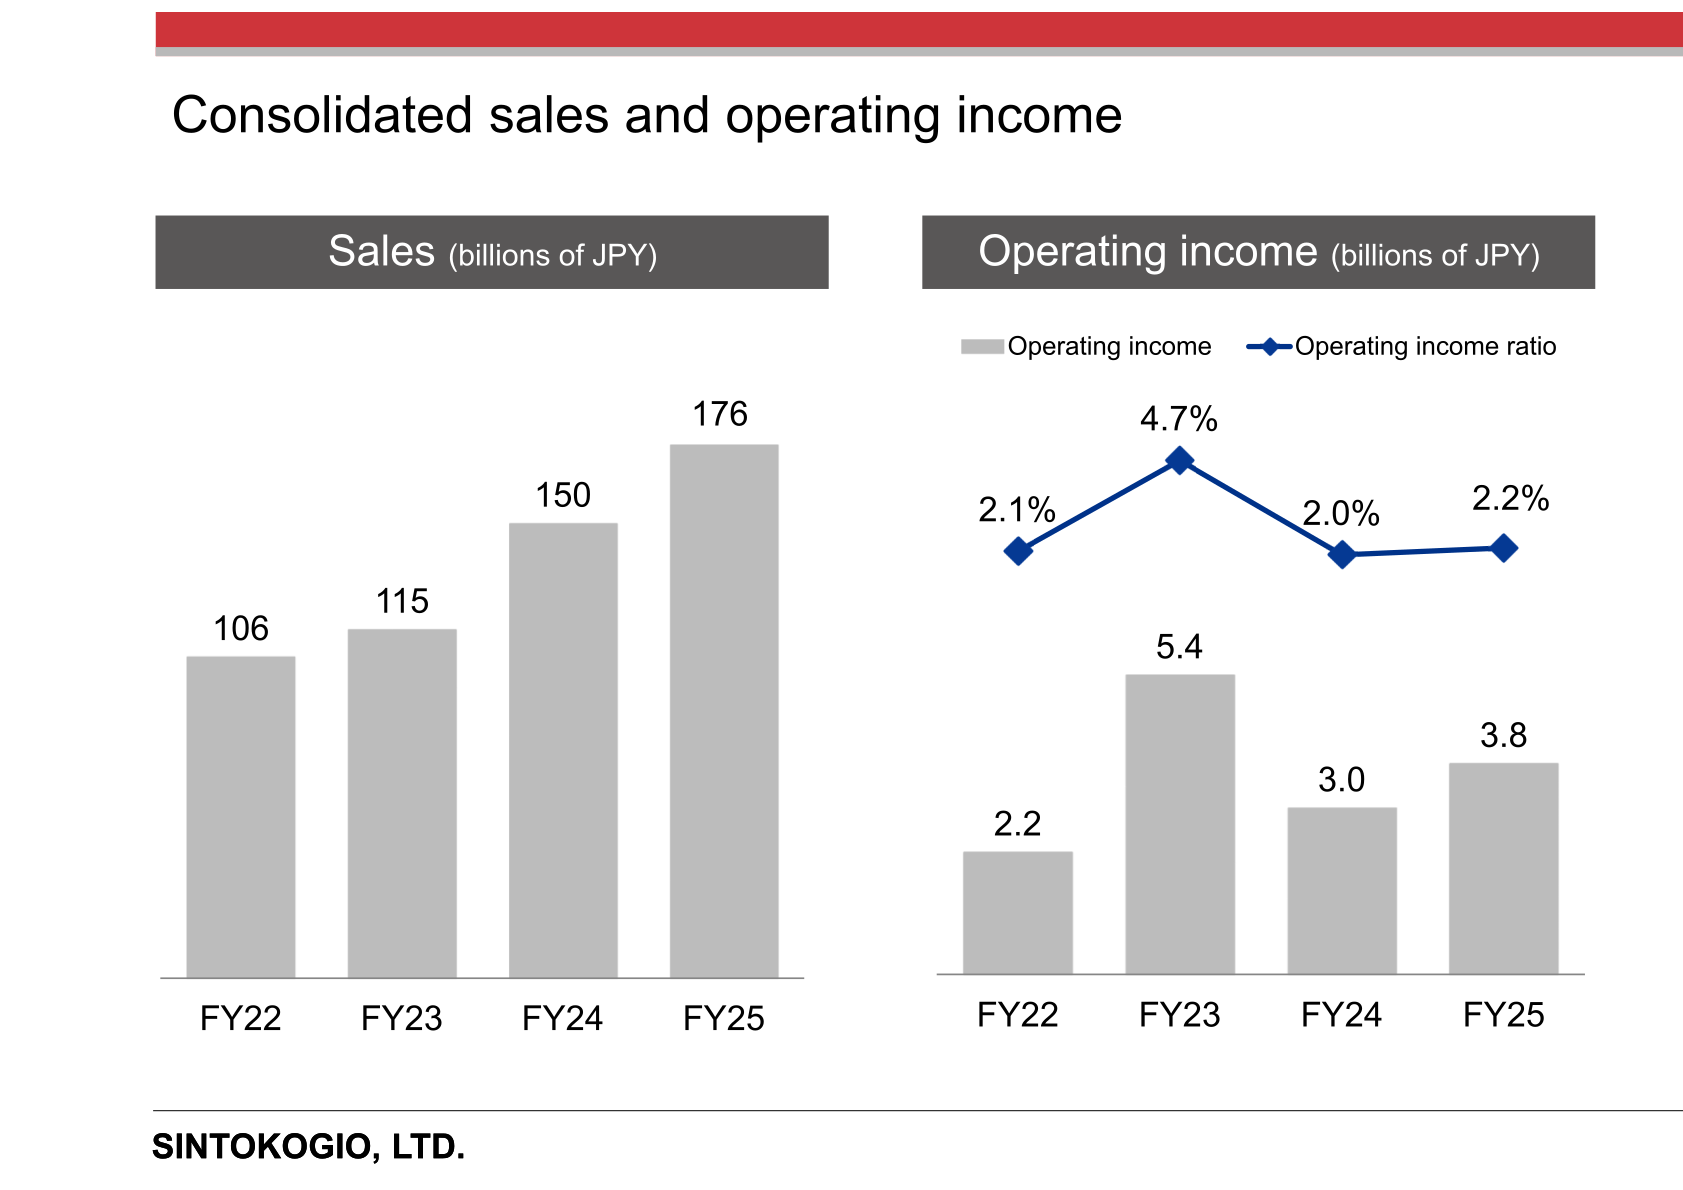
Orders received and the order backlog are disclosed as a separate indicator from sales. Orders received were 159 billions of JPY in FY25, following 156 billions of JPY in FY24, 123 billions of JPY in FY23 and 114 billions of JPY in FY22. The order backlog stood at 49 billions of JPY at the end of FY25, down from 66 billions of JPY at the end of FY24, after having risen from 52 billions of JPY in FY22 and 60 billions of JPY in FY23.
| Item (billions of JPY) | FY22 | FY23 | FY24 | FY25 |
|---|---|---|---|---|
| Orders received | 114 | 123 | 156 | 159 |
| Order backlog | 52 | 60 | 66 | 49 |
Segment Results
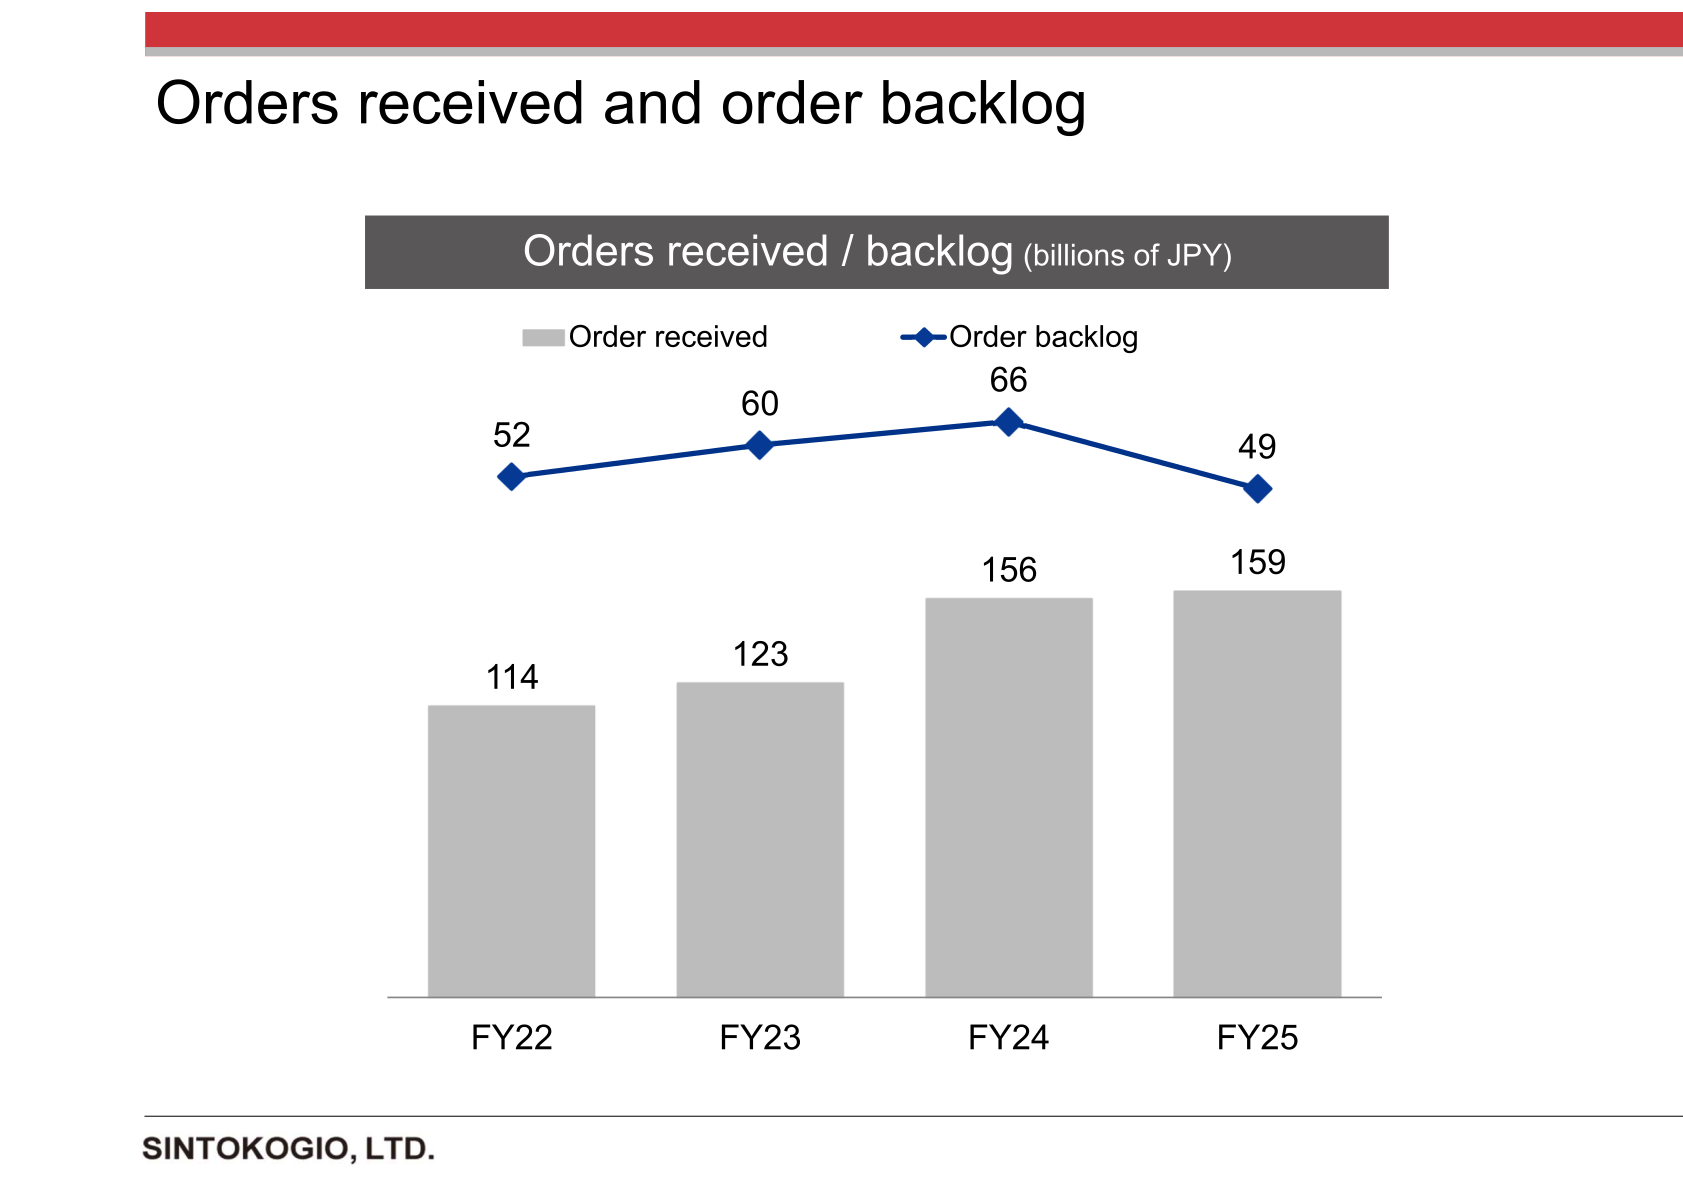
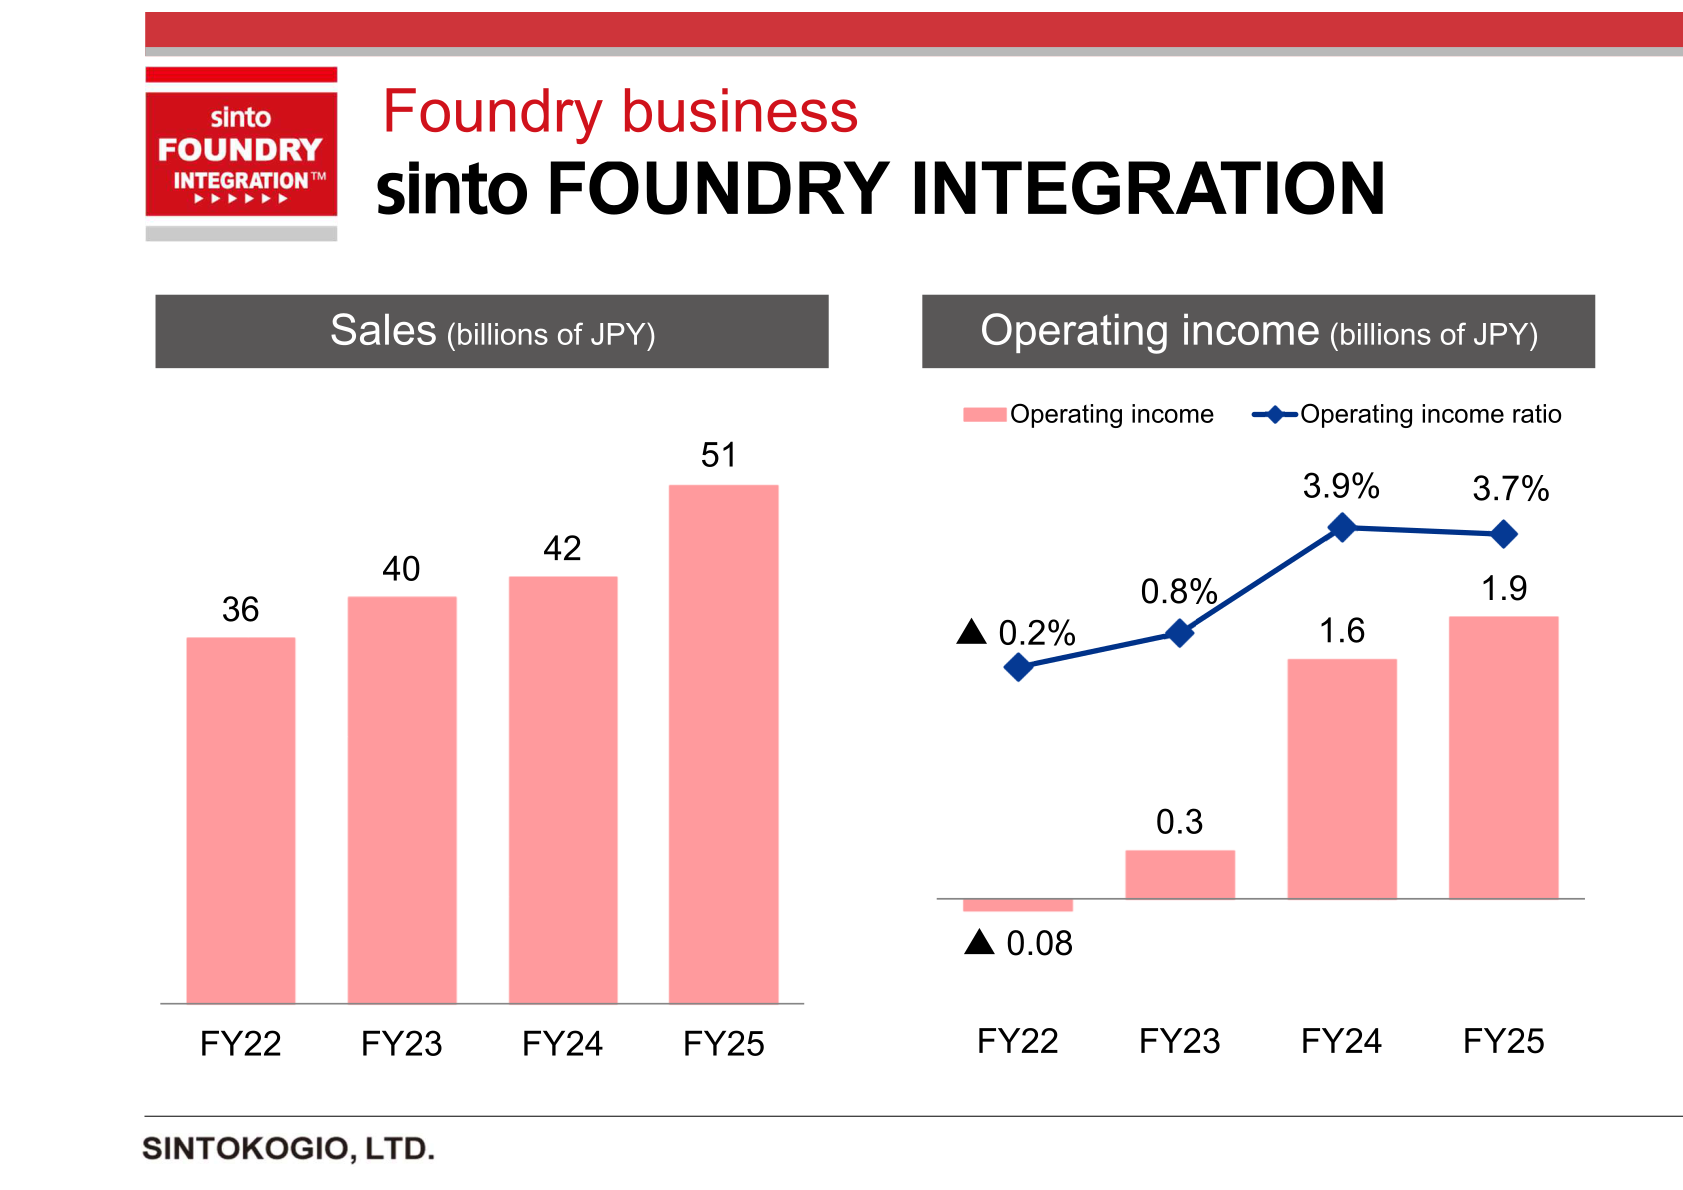
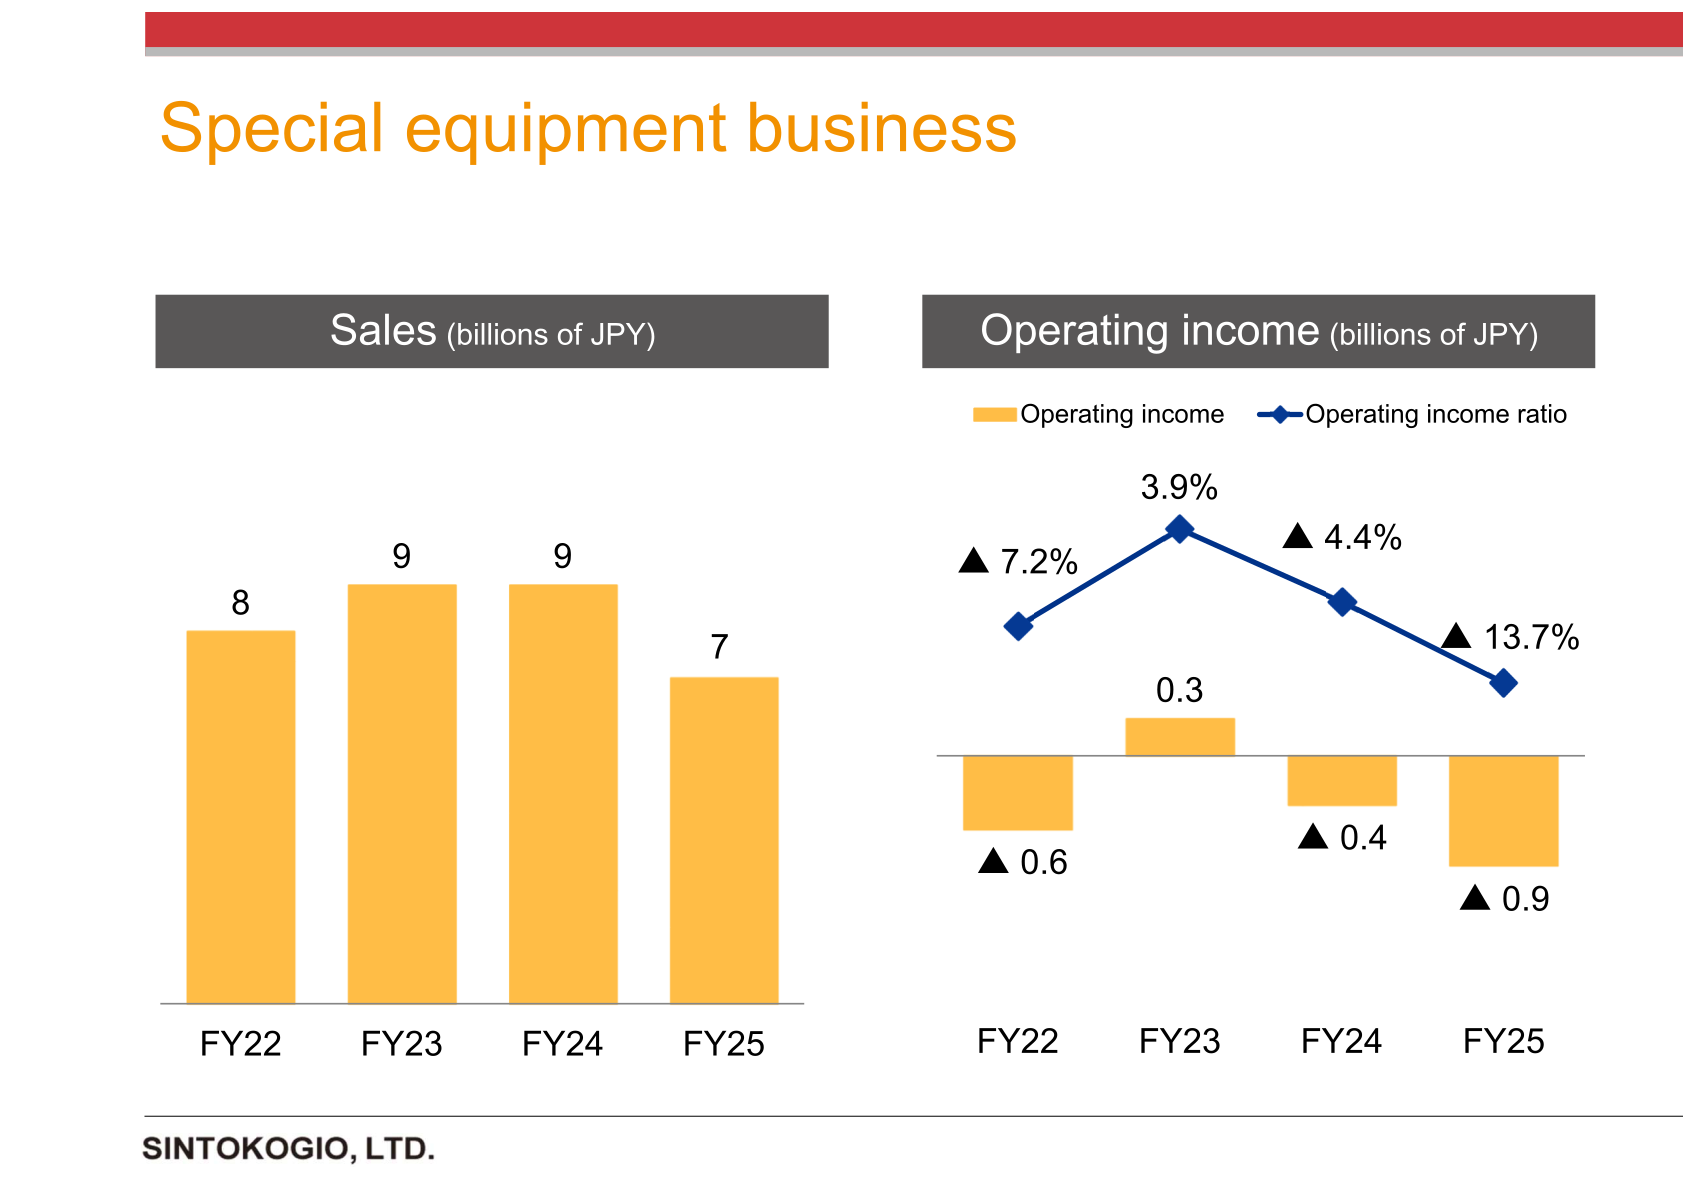
The materials break the group down into five businesses, each presented on its own slide with sales, operating income and the operating income ratio for FY22 through FY25. The Surface treatment business (sinto SURFACE TECMART) was the largest, with sales of 96 billions of JPY in FY25 versus 77 billions of JPY in FY24, and operating income of 1.0 billions of JPY against 0.18 billions of JPY. The Foundry business (sinto FOUNDRY INTEGRATION) posted sales of 51 billions of JPY and operating income of 1.9 billions of JPY. The Environment business (sinto WELLNESS CREATION) recorded sales of 13 billions of JPY and operating income of 1.7 billions of JPY, the highest operating income ratio of the five at 13.0%. The Special equipment business had sales of 7 billions of JPY and an operating loss of ▲ 0.9 billions of JPY, a ratio of ▲ 13.7%. The Material handling business had sales of 8 billions of JPY and operating income of 0.8 billions of JPY.
| Segment | Sales FY24 | Sales FY25 | Operating income FY24 | Operating income FY25 | Operating income ratio FY25 |
|---|---|---|---|---|---|
| Surface treatment business (sinto SURFACE TECMART) | 77 | 96 | 0.18 | 1.0 | 1.1% |
| Foundry business (sinto FOUNDRY INTEGRATION) | 42 | 51 | 1.6 | 1.9 | 3.7% |
| Environment business (sinto WELLNESS CREATION) | 12 | 13 | 1.6 | 1.7 | 13.0% |
| Special equipment business | 9 | 7 | ▲ 0.4 | ▲ 0.9 | ▲ 13.7% |
| Material handling business | 9 | 8 | 0.9 | 0.8 | 10.9% |
Segment Trends over Four Years
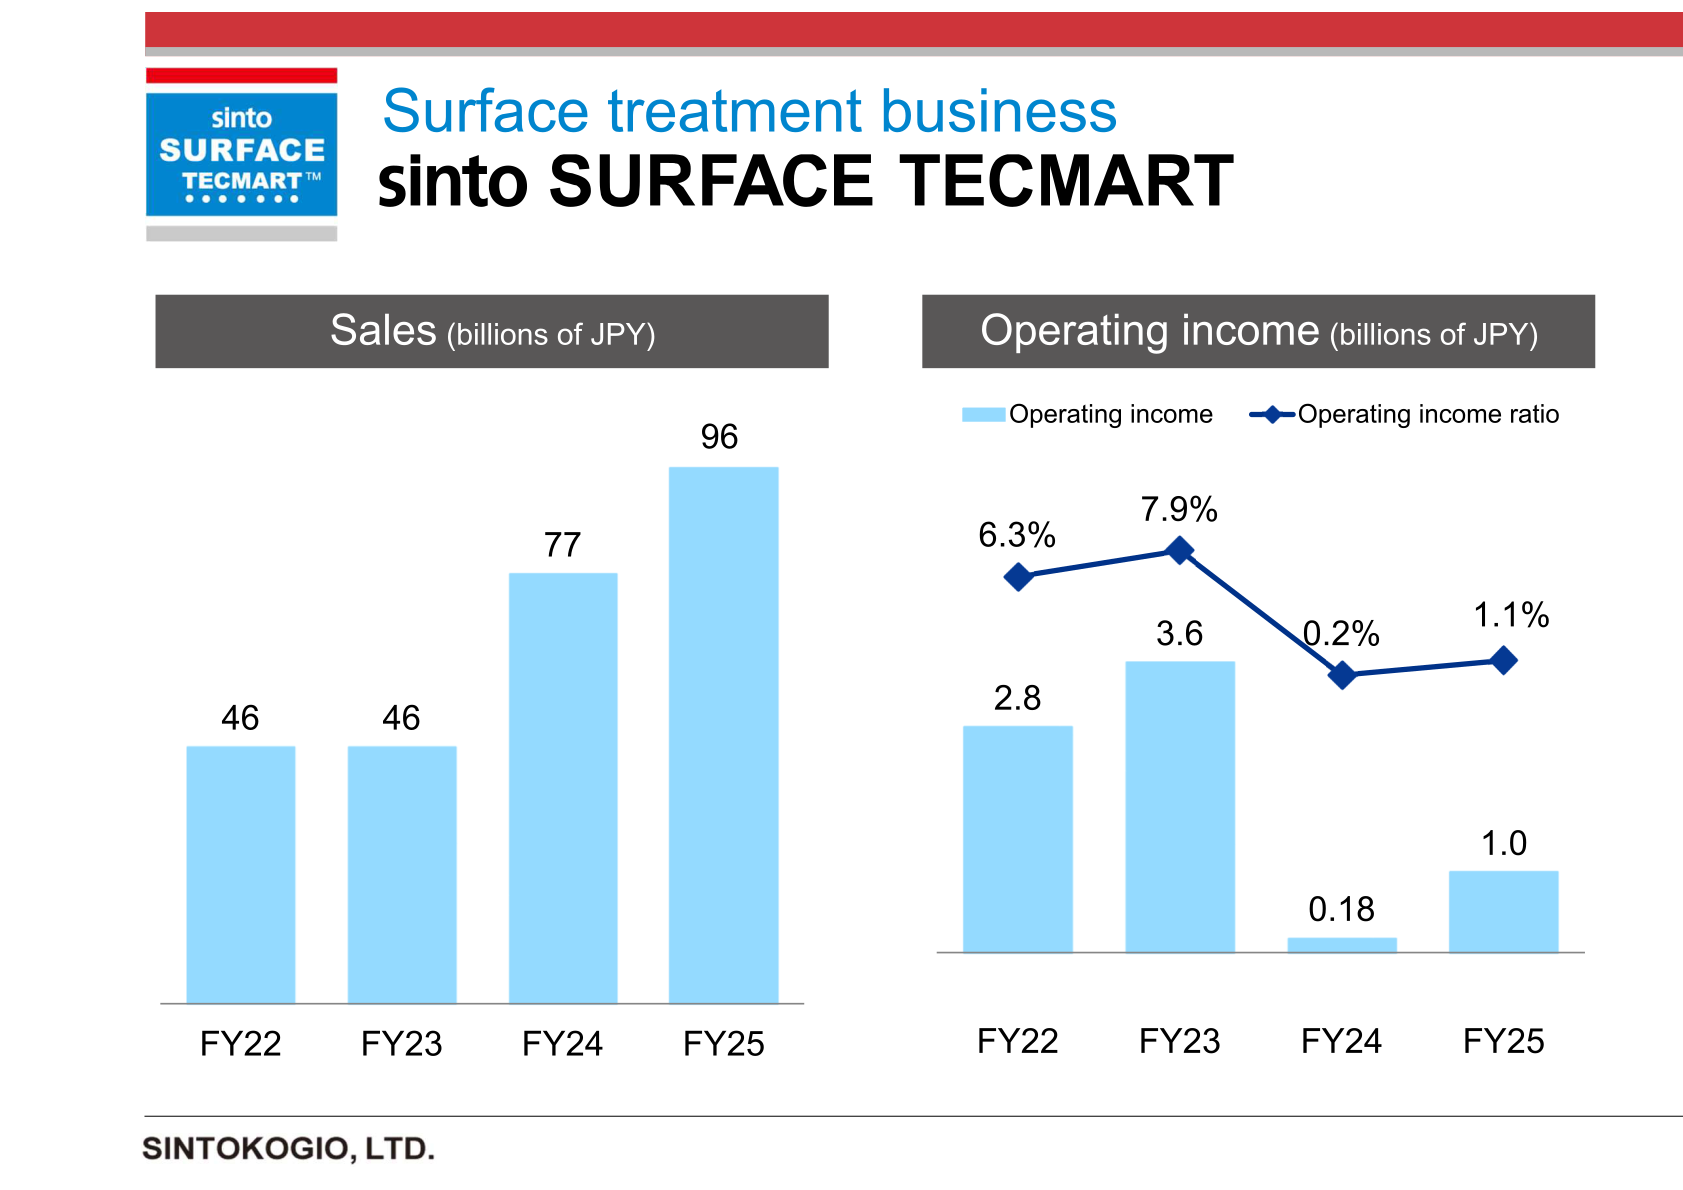
Across the four years shown, the Surface treatment business moved from 46 billions of JPY of sales in both FY22 and FY23 to 77 billions of JPY in FY24 and 96 billions of JPY in FY25, while its operating income ratio fell from 6.3% in FY22 and 7.9% in FY23 to 0.2% in FY24 and 1.1% in FY25. The Foundry business grew from 36 billions of JPY to 51 billions of JPY of sales over the same span, with its operating income moving from ▲ 0.08 billions of JPY in FY22 to 1.9 billions of JPY in FY25. The Environment business rose from 10 billions of JPY to 13 billions of JPY of sales with operating income of 0.7, 1.1, 1.6 and 1.7 billions of JPY. The Special equipment business recorded operating losses in three of the four years, at ▲ 0.6, 0.3, ▲ 0.4 and ▲ 0.9 billions of JPY. The Material handling business reported sales of 6, 8, 9 and 8 billions of JPY and operating income of 0.4, 1.2, 0.9 and 0.8 billions of JPY.
Full-Year Forecast and Shareholder Returns
The materials consist of eight pages covering consolidated sales and operating income, orders received and order backlog, and the five business segments. They contain no earnings forecast for the following fiscal year and no dividend or share buyback information. This cannot be confirmed from the materials.
This article is an analysis based on publicly available information and is not a recommendation to buy or sell any specific securities. Investment decisions are your own responsibility.
![[Obayashi] Investors’ Guide 2026 — The Complete 24-Article Breakdown](https://japan-equity.com/wp-content/uploads/2026/07/hub_cover-1024x1024.png)
![[Obayashi] IR & SR Policy — Feeding Dialogue Back into Management](https://japan-equity.com/wp-content/uploads/2026/07/p32_sq-1024x1024.jpg)
![[Obayashi] Real Estate Development — 18.7% Margin, ¥287.7bn Unrealized Gains](https://japan-equity.com/wp-content/uploads/2026/07/p20_sq-1024x1024.jpg)
![[Obayashi] Domestic Civil Engineering — Resilience Spending Supports 9.6% Margin](https://japan-equity.com/wp-content/uploads/2026/07/p11_sq-1024x1024.jpg)
![[Obayashi] Share Price & External Ratings — vs TOPIX, ESG Index Inclusion](https://japan-equity.com/wp-content/uploads/2026/07/p40_sq-1024x1024.jpg)
![[Construction] ¥75.5tn Investment, Shrinking Workforce — Big-5 Market Share](https://japan-equity.com/wp-content/uploads/2026/07/p12_sq-1024x1024.jpg)



![[Obayashi] Capital Policy & Shareholder Returns — ROE 10%+, DOE ~5%, ¥100bn Buyback](https://japan-equity.com/wp-content/uploads/2026/07/p27_sq-1024x1024.jpg)
![[Obayashi] Reducing Cross-Shareholdings — ¥285.2bn Sold in Five Years](https://japan-equity.com/wp-content/uploads/2026/07/p29_sq-1024x1024.jpg)
![[Obayashi] ¥750bn Investment Plan — ¥300bn to Development, ¥190bn to Tech/DX](https://japan-equity.com/wp-content/uploads/2026/07/p30_sq-1024x1024.jpg)
![[Obayashi] MTP2022 KPIs — Operating Profit ~2x Target, ROE 14.4%](https://japan-equity.com/wp-content/uploads/2026/07/p25_sq-1024x1024.jpg)
![[Obayashi] Cash Allocation — ¥420bn Investment CF Over Five Years](https://japan-equity.com/wp-content/uploads/2026/07/p26_sq-1024x1024.jpg)
![[Obayashi] Green Energy — 44 Plants, 344MW, and the Green Hydrogen Challenge](https://japan-equity.com/wp-content/uploads/2026/07/p21_sq-1024x1024.jpg)
![[Obayashi] Tackling the Labor Shortage — Robotics Construction®](https://japan-equity.com/wp-content/uploads/2026/07/p14_sq-1024x1024.jpg)
