
This article is based on publicly available IR materials and is not a recommendation to buy or sell any specific securities.
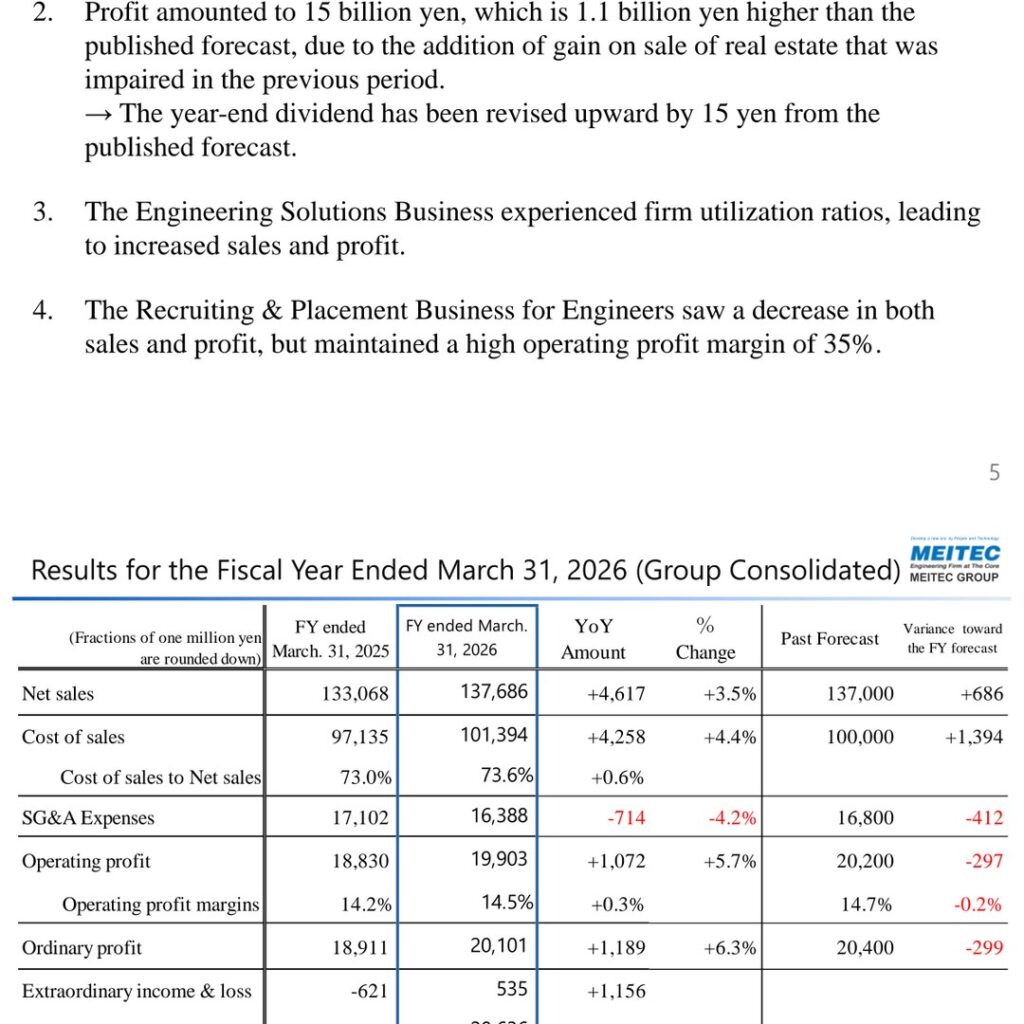
MEITEC Group Holdings Inc. reported record-high results for the fiscal year ended March 31, 2026. Consolidated net sales rose 3.5% year on year to 137,686 million yen, operating profit rose 5.7% to 19,903 million yen, and profit attributable to owners of parent rose 18.1% to 15,051 million yen. The company comments that main clients continued investment in technological development, so that both sales and profit increased and reached record highs, and that profit amounted to 15 billion yen, which is 1.1 billion yen higher than the published forecast, due to the addition of gain on sale of real estate that was impaired in the previous period. The materials carry a cautionary note that, as disclosed on May 11, 2026 in “Notice Concerning Interim Dividend Paid in Excess of Distributable Amount,” audit procedures were still ongoing as of the announcement on May 12, 2026, and that the information presented may differ materially from the latest information.
Consolidated Results (Full-Year Actual)
Net sales came in 686 million yen above the published forecast of 137,000 million yen, while operating profit of 19,903 million yen fell 297 million yen short of the 20,200 million yen forecast. SG&A expenses declined 4.2% year on year to 16,388 million yen. Extraordinary income and loss swung to a positive 535 million yen from a negative 621 million yen, lifting profit before income taxes 12.8% to 20,636 million yen. Return on equity (ROE) improved to 30.9% from 26.4%. Figures are in millions of yen, with fractions of one million yen rounded down.
| Item | FY ended March 31, 2025 | FY ended March 31, 2026 | YoY Amount | % Change | Past Forecast | Variance toward the FY forecast |
|---|---|---|---|---|---|---|
| Net sales | 133,068 | 137,686 | +4,617 | +3.5% | 137,000 | +686 |
| Cost of sales | 97,135 | 101,394 | +4,258 | +4.4% | 100,000 | +1,394 |
| Cost of sales to Net sales | 73.0% | 73.6% | +0.6% | — | — | — |
| SG&A Expenses | 17,102 | 16,388 | -714 | -4.2% | 16,800 | -412 |
| Operating profit | 18,830 | 19,903 | +1,072 | +5.7% | 20,200 | -297 |
| Operating profit margins | 14.2% | 14.5% | +0.3% | — | 14.7% | -0.2% |
| Ordinary profit | 18,911 | 20,101 | +1,189 | +6.3% | 20,400 | -299 |
| Extraordinary income & loss | -621 | 535 | +1,156 | — | — | — |
| Profit before income taxes | 18,290 | 20,636 | +2,345 | +12.8% | — | — |
| Income taxes | 5,550 | 5,584 | +34 | +0.6% | — | — |
| Profit attributable to owners of parent | 12,740 | 15,051 | +2,311 | +18.1% | 13,900 | +1,151 |
| Profit margins | 9.6% | 10.9% | +1.4% | — | — | — |
| Return on Equity (ROE) | 26.4% | 30.9% | +4.5% | — | — | — |
Results by Operating Company
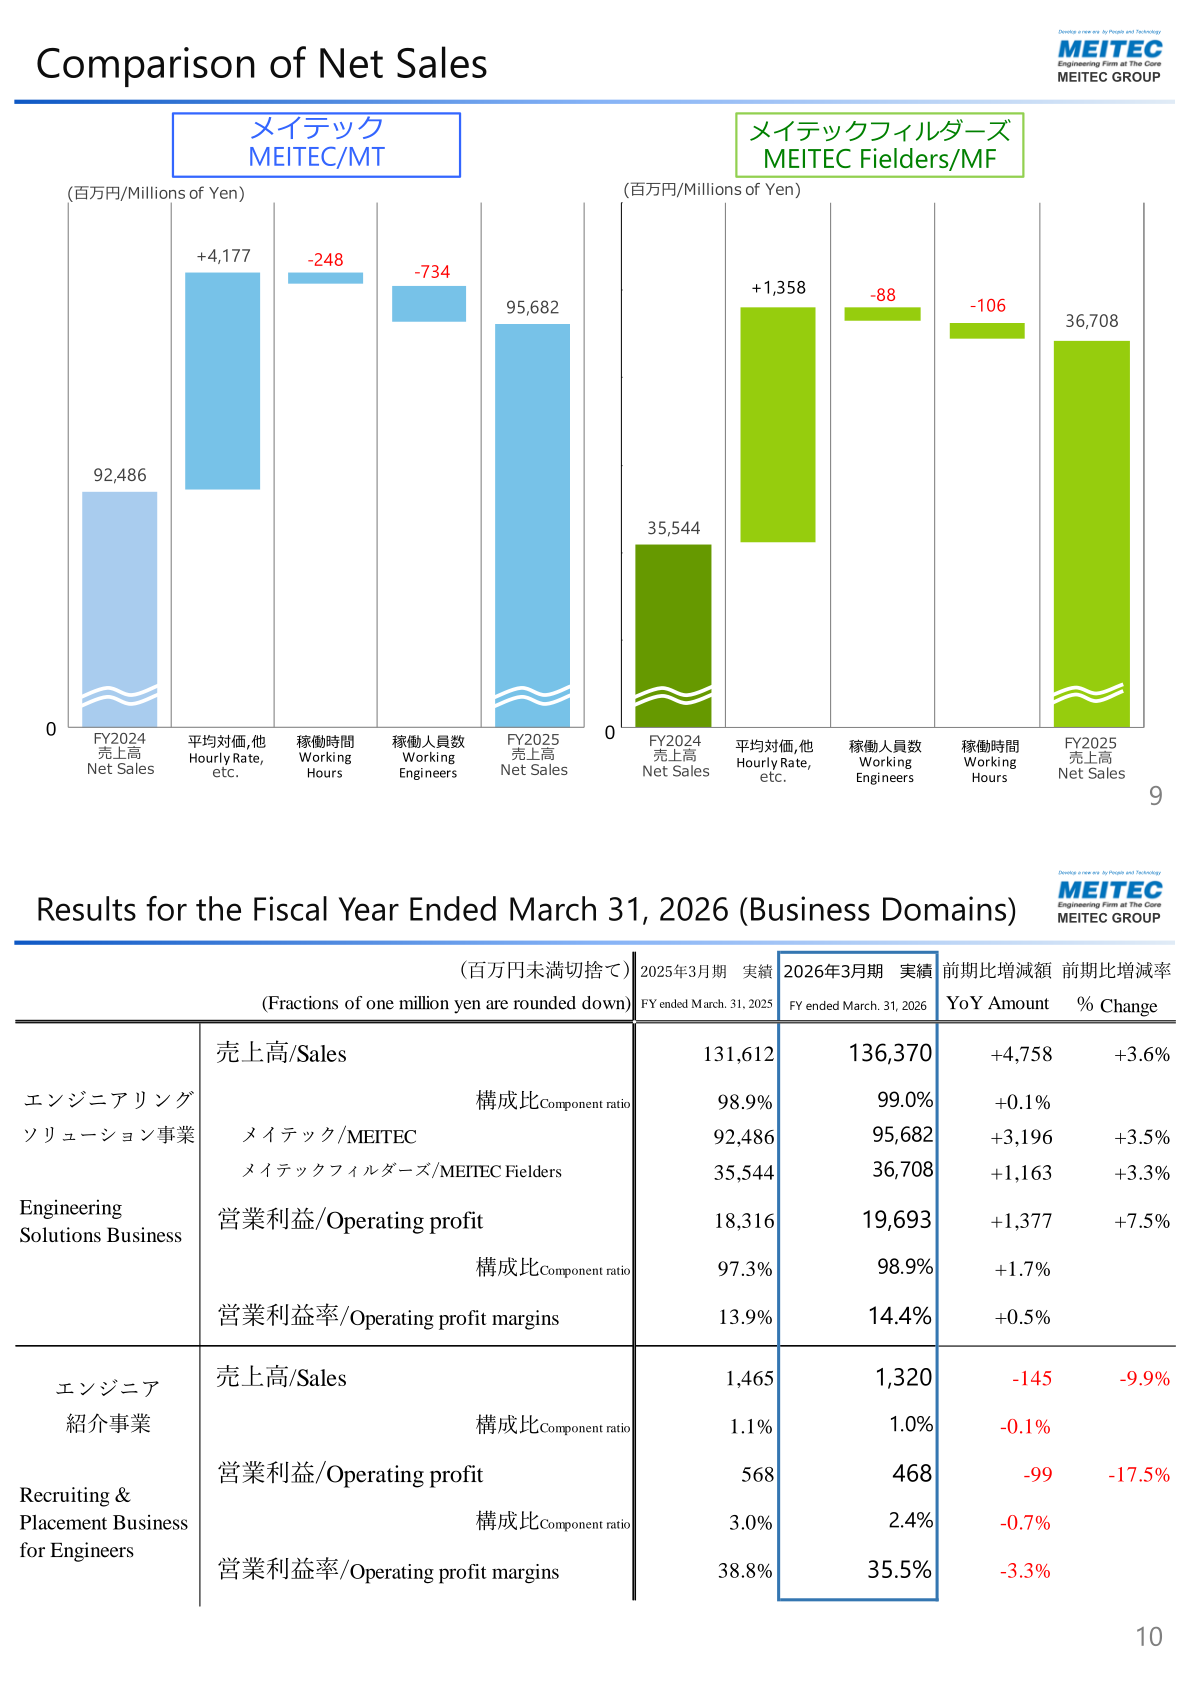
At MEITEC, net sales rose 3.5% to 95,682 million yen and operating profit rose 9.1% to 15,933 million yen, with the operating profit margin improving to 16.7%. At MEITEC Fielders, net sales rose 3.3% to 36,708 million yen but operating profit edged down 0.5% to 3,499 million yen and the margin slipped to 9.5%. The company’s breakdown of MEITEC’s sales change shows Hourly Rate, etc. contributing +4,177 million yen, Working Hours -248 million yen and Working Engineers -734 million yen.
| Item | MEITEC FY ended March 31, 2025 | MEITEC FY ended March 31, 2026 | MEITEC Fielders FY ended March 31, 2025 | MEITEC Fielders FY ended March 31, 2026 |
|---|---|---|---|---|
| Net sales | 92,486 | 95,682 | 35,544 | 36,708 |
| Cost of sales | 66,257 | 68,872 | 27,928 | 29,243 |
| SG&A Expenses | 11,629 | 10,875 | 4,097 | 3,964 |
| Operating profit | 14,599 | 15,933 | 3,518 | 3,499 |
| Operating profit margins | 15.8% | 16.7% | 9.9% | 9.5% |
| Ordinary profit | 14,614 | 15,985 | 3,522 | 3,516 |
| Profit | 10,253 | 11,381 | 2,629 | 2,680 |
| Utilization ratio (Company-wide) | 98.3% | 98.5% | 97.1% | 97.2% |
| Working Hours〈h/day〉 | 8.38 | 8.36 | 8.24 | 8.22 |
| Number of Recruitment | 438 | 404 | 589 | 559 |
| Turnover Ratio | 6.1% | 6.1% | 14.3% | 11.8% |
| Number of Engineers | 7,824 | 7,754 | 4,323 | 4,349 |
Segment Results
The Engineering Solutions Business, which accounts for 99.0% of group sales, grew sales 3.6% to 136,370 million yen and operating profit 7.5% to 19,693 million yen, with the margin rising to 14.4%. The Recruiting & Placement Business for Engineers saw sales fall 9.9% to 1,320 million yen and operating profit fall 17.5% to 468 million yen, though the company notes it maintained a high operating profit margin of 35%. Within MEITEC’s sales by industrial segment, Automobile/Transportation was the largest category at 27,923 million yen (29.2% of net sales, +3.0% year on year), while Aircraft/Aerospace grew 20.3% to 7,890 million yen.
| Segment | Item | FY ended March 31, 2025 | FY ended March 31, 2026 | YoY Amount | % Change |
|---|---|---|---|---|---|
| Engineering Solutions Business | Sales | 131,612 | 136,370 | +4,758 | +3.6% |
| Engineering Solutions Business | Component ratio | 98.9% | 99.0% | +0.1% | — |
| Engineering Solutions Business | MEITEC | 92,486 | 95,682 | +3,196 | +3.5% |
| Engineering Solutions Business | MEITEC Fielders | 35,544 | 36,708 | +1,163 | +3.3% |
| Engineering Solutions Business | Operating profit | 18,316 | 19,693 | +1,377 | +7.5% |
| Engineering Solutions Business | Operating profit margins | 13.9% | 14.4% | +0.5% | — |
| Recruiting & Placement Business for Engineers | Sales | 1,465 | 1,320 | -145 | -9.9% |
| Recruiting & Placement Business for Engineers | Component ratio | 1.1% | 1.0% | -0.1% | — |
| Recruiting & Placement Business for Engineers | Operating profit | 568 | 468 | -99 | -17.5% |
| Recruiting & Placement Business for Engineers | Operating profit margins | 38.8% | 35.5% | -3.3% | — |
Engineers, Utilization and Recruitment
As of April 1, 2026, the group had 12,529 engineers, of which MEITEC accounted for 7,932 and MEITEC Fielders for 4,597. MEITEC’s company-wide utilization ratio was 98.5% (up 0.2 points) and MEITEC Fielders’ was 97.2% (up 0.1 points); working hours were 8.36 and 8.22 hours per day respectively, both down 0.02.
Recruitment fell short of plan at both companies. MEITEC hired 404 people (308 new graduates and 96 mid-career), 34 fewer than the prior year, while MEITEC Fielders hired 559 (337 new graduates and 222 mid-career), 30 fewer than the prior year. The company states that April 2026 new graduate hiring at MEITEC was down 83 year on year and 175 lower than target, and at MEITEC Fielders was down 60 year on year and 173 lower than target. For April 2027, MEITEC targets 400 new graduates (up 175) and MEITEC Fielders targets 450 (up 173); mid-career targets for the year ending March 31, 2027 are 150 at MEITEC (up 54) and 400 at MEITEC Fielders (up 178).
FY2026 Forecast
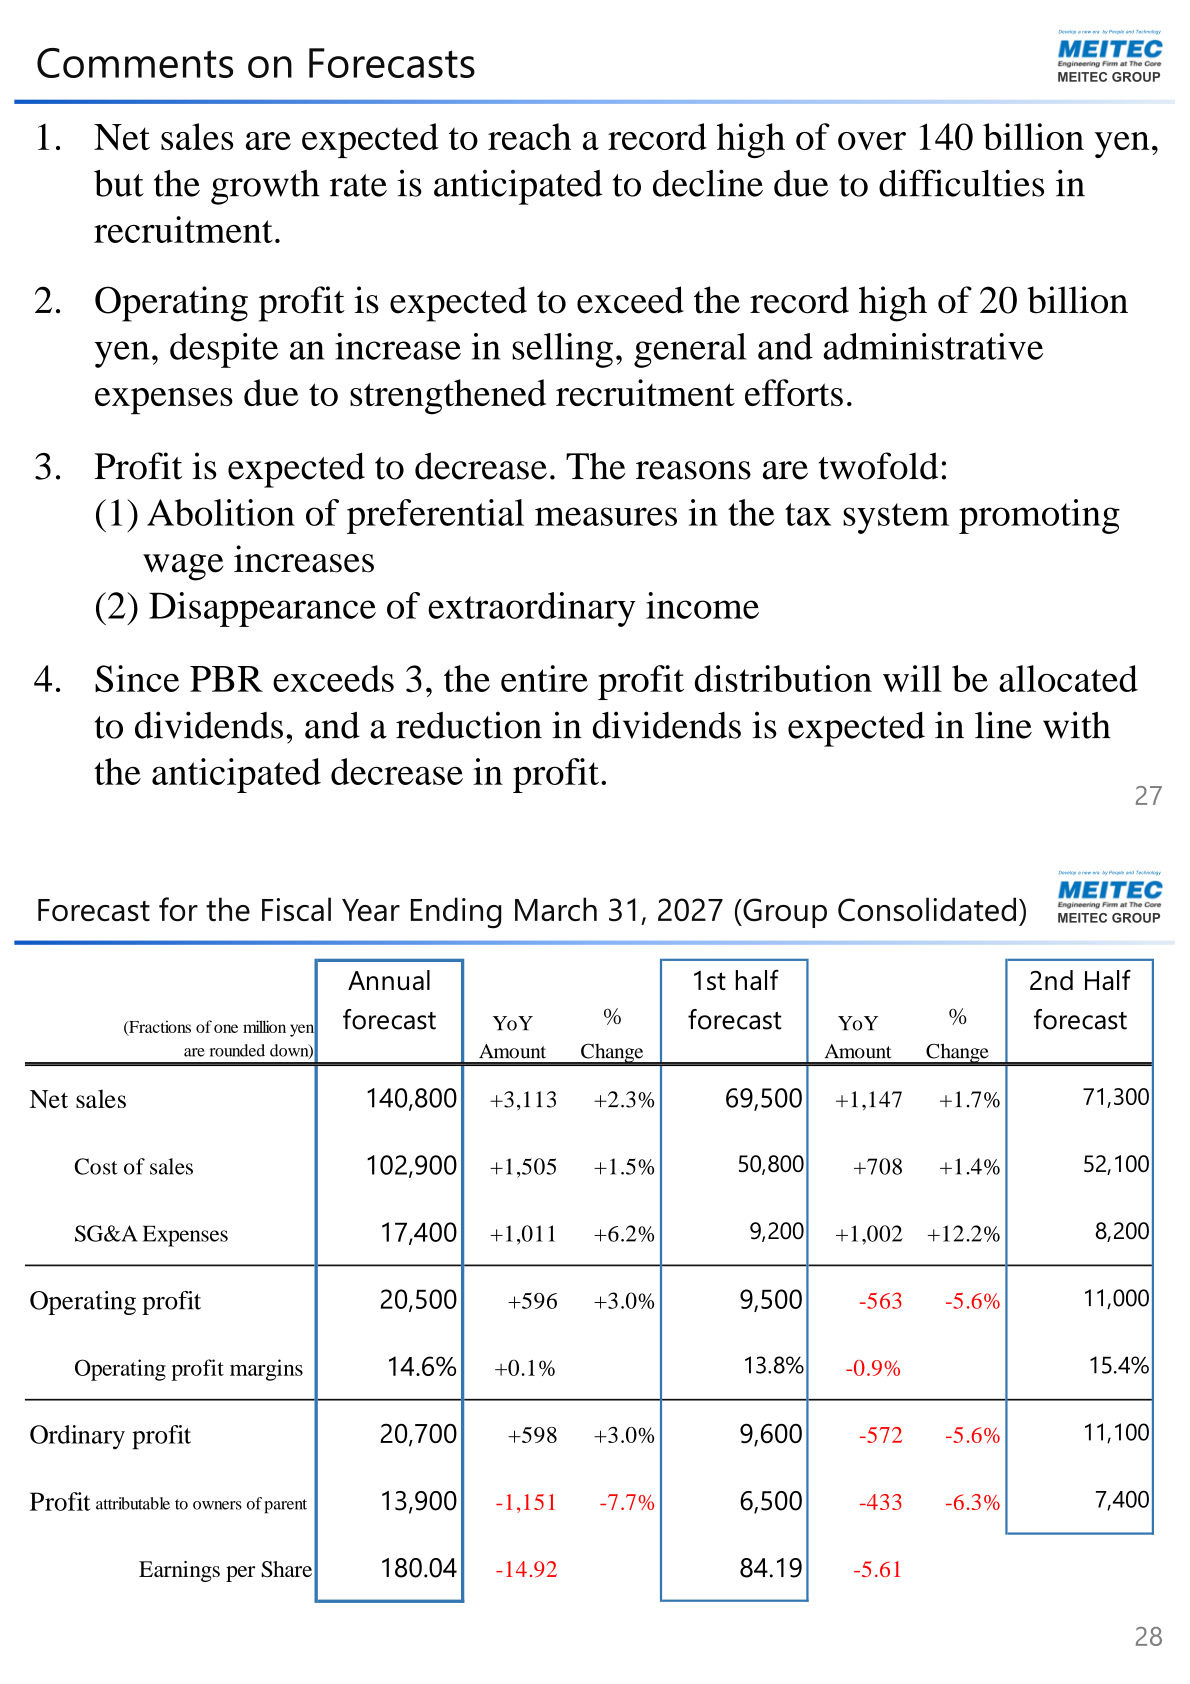
For the fiscal year ending March 31, 2027, the company forecasts net sales of 140,800 million yen (up 2.3%) and operating profit of 20,500 million yen (up 3.0%), but profit attributable to owners of parent of 13,900 million yen, down 7.7%. Management explains that net sales are expected to reach a record high of over 140 billion yen while the growth rate declines due to difficulties in recruitment, that operating profit is expected to exceed the record high of 20 billion yen despite higher SG&A expenses from strengthened recruitment efforts, and that profit is expected to decrease because of the abolition of preferential measures in the tax system promoting wage increases and the disappearance of extraordinary income. By operating company, forecasts are net sales of 97,000 million yen and operating profit of 16,500 million yen at Meitec, 38,200 million yen and 3,440 million yen at Meitec Fielders, 4,390 million yen and 320 million yen at Meitec Cast, and 1,470 million yen and 500 million yen at Meitec Next.
| Item | Annual forecast | YoY Amount | % Change | 1st half forecast | 2nd Half forecast |
|---|---|---|---|---|---|
| Net sales | 140,800 | +3,113 | +2.3% | 69,500 | 71,300 |
| Cost of sales | 102,900 | +1,505 | +1.5% | 50,800 | 52,100 |
| SG&A Expenses | 17,400 | +1,011 | +6.2% | 9,200 | 8,200 |
| Operating profit | 20,500 | +596 | +3.0% | 9,500 | 11,000 |
| Operating profit margins | 14.6% | +0.1% | — | 13.8% | 15.4% |
| Ordinary profit | 20,700 | +598 | +3.0% | 9,600 | 11,100 |
| Profit attributable to owners of parent | 13,900 | -1,151 | -7.7% | 6,500 | 7,400 |
| Earnings per Share | 180.04 | -14.92 | — | 84.19 | — |
Shareholder Returns
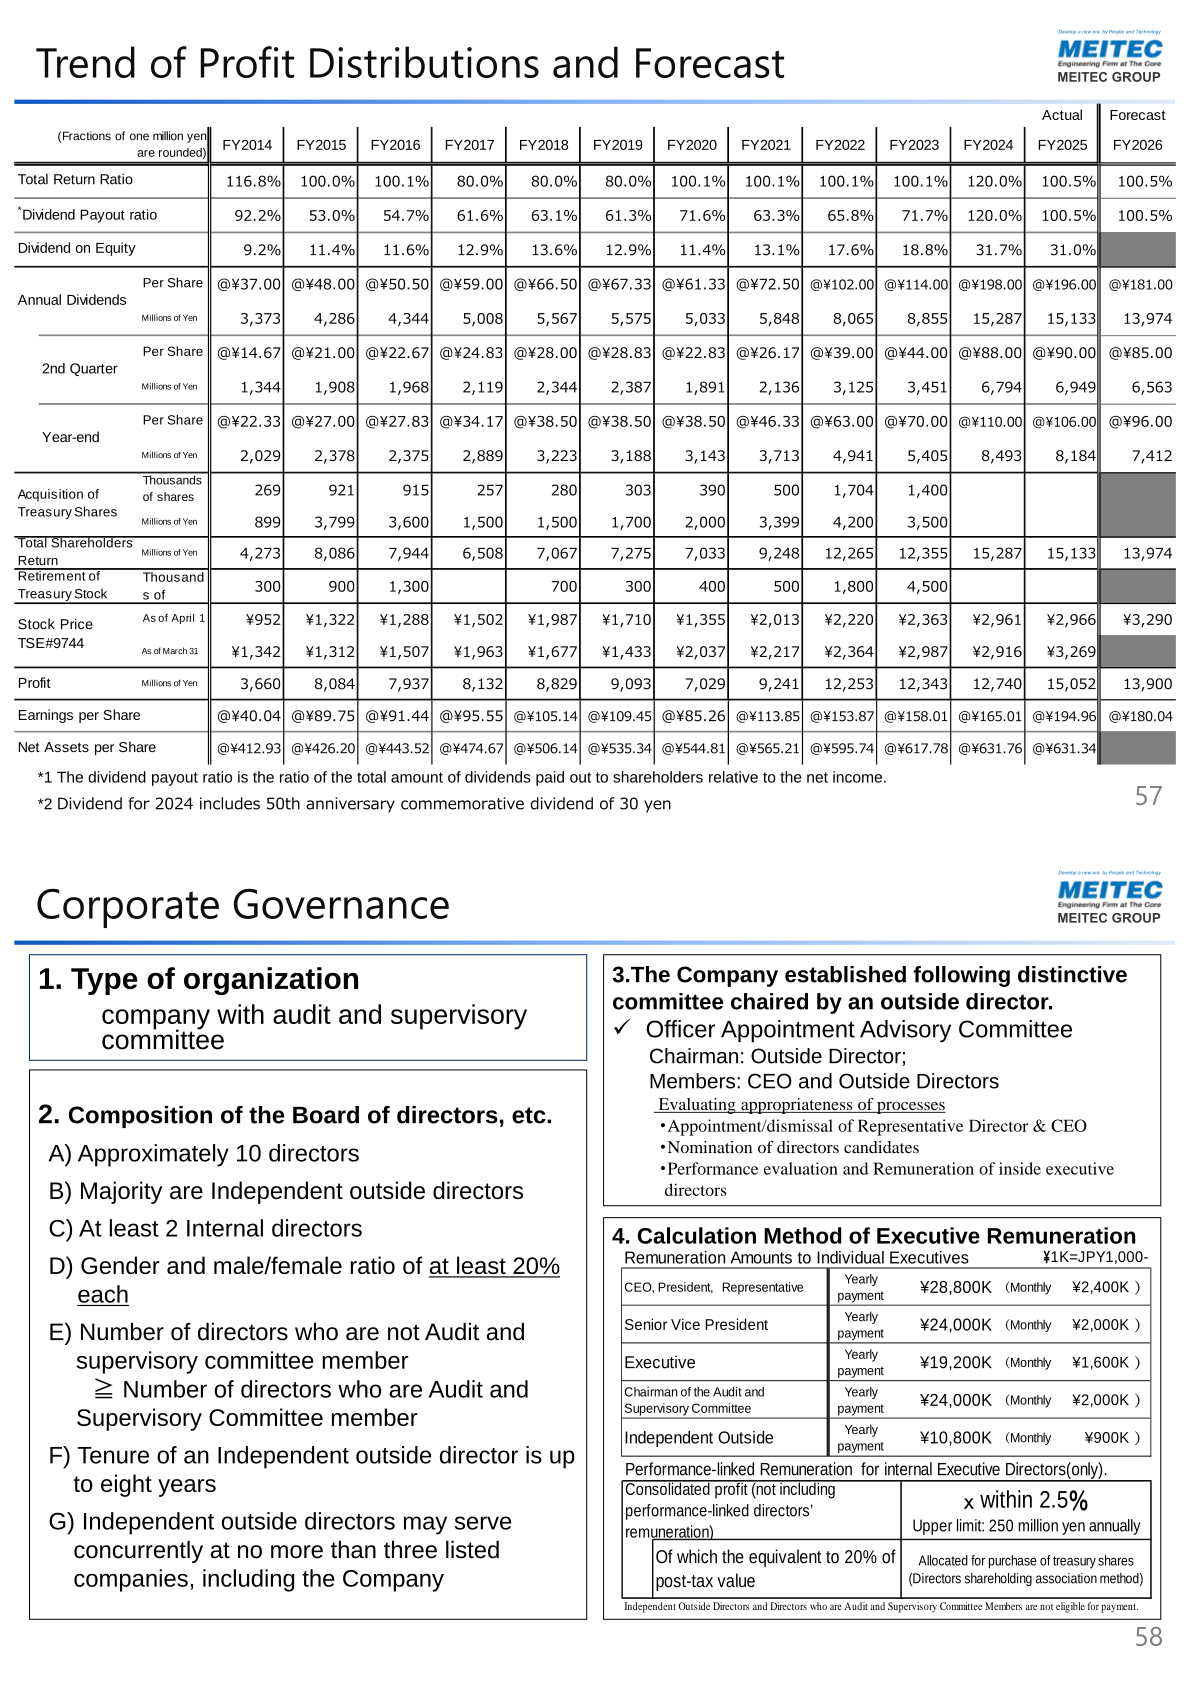
The company’s basic policy on profit distribution sets a total payout ratio of 100% or less in principle, a minimum dividend payout equal to a dividend on equity ratio of 5%, dividends as the basis of the distribution method, consideration of treasury share acquisition when PBR falls below 3, and a maximum of 5% of total shares issued for treasury shares. The year-end dividend per share for FY2025 is 106 yen, 15 yen higher than the announced forecast, bringing the annual dividend to 196 yen, a 2 yen decrease compared with FY2024; excluding the 30 yen commemorative dividend included in FY2024, the company says this effectively represents a 28 yen increase. For FY2026, the entire forecasted profit of 13.9 billion yen is expected to be distributed as dividends, giving a projected annual dividend per share of 181 yen, a decrease of 15 yen.
| Item | FY2024 | FY2025 | FY2026 (Forecast) |
|---|---|---|---|
| Annual Dividends per Share | @¥198.00 | @¥196.00 | @¥181.00 |
| 2nd Quarter per Share | @¥88.00 | @¥90.00 | @¥85.00 |
| Year-end per Share | @¥110.00 | @¥106.00 | @¥96.00 |
| Annual Dividends (Millions of Yen) | 15,287 | 15,133 | 13,974 |
| Total Return Ratio | 120.0% | 100.5% | 100.5% |
| Dividend Payout ratio | 120.0% | 100.5% | 100.5% |
| Dividend on Equity | 31.7% | 31.0% | — |
| Earnings per Share | @¥165.01 | @¥194.96 | @¥180.04 |
Medium-Term Plan 2028
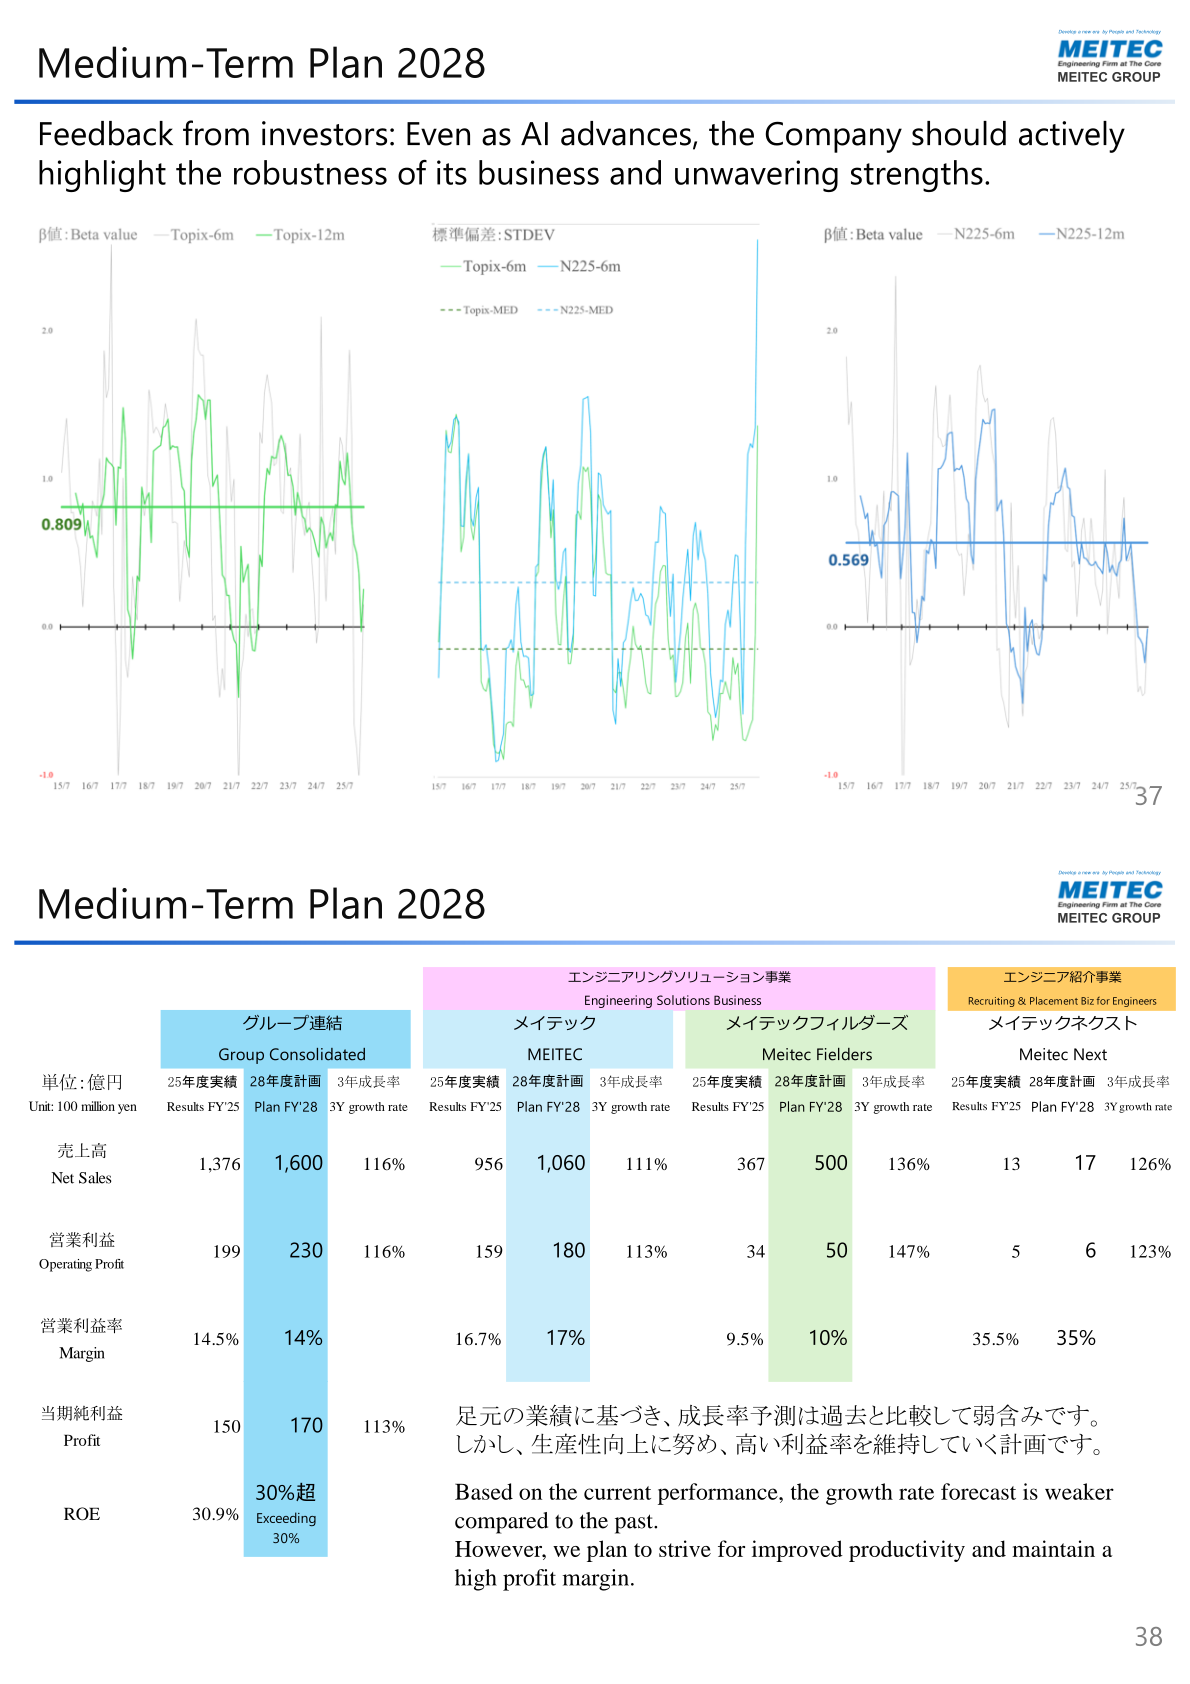
Reviewing the previous medium-term plan covering the three years to FY2025, the company states that results for FY2025 were the highest in its history and that profit met the plan’s targets, while net sales fell short. Under Medium-Term Plan 2028, group consolidated net sales are targeted at 1,600 (100 million yen) in FY2028 against 1,376 in FY2025, a three-year growth rate of 116%, with operating profit of 230 against 199, profit of 170 against 150 and ROE exceeding 30%. The company notes that, based on current performance, the growth rate forecast is weaker compared with the past, but that it plans to strive for improved productivity and maintain a high profit margin. It also states that the quantitative targets in the plan differ from the earnings forecasts.
| Unit: 100 million yen | Group Consolidated Results FY’25 | Group Consolidated Plan FY’28 | 3Y growth rate | MEITEC Results FY’25 | MEITEC Plan FY’28 | Meitec Fielders Results FY’25 | Meitec Fielders Plan FY’28 | Meitec Next Results FY’25 | Meitec Next Plan FY’28 |
|---|---|---|---|---|---|---|---|---|---|
| Net Sales | 1,376 | 1,600 | 116% | 956 | 1,060 | 367 | 500 | 13 | 17 |
| Operating Profit | 199 | 230 | 116% | 159 | 180 | 34 | 50 | 5 | 6 |
| Margin | 14.5% | 14% | — | 16.7% | 17% | 9.5% | 10% | 35.5% | 35% |
| Profit | 150 | 170 | 113% | — | — | — | — | — | — |
| ROE | 30.9% | Exceeding 30% | — | — | — | — | — | — | — |
This article is an analysis based on publicly available information and is not a recommendation to buy or sell any specific securities. Investment decisions are your own responsibility.
![[Obayashi] Investors’ Guide 2026 — The Complete 24-Article Breakdown](https://japan-equity.com/wp-content/uploads/2026/07/hub_cover-1024x1024.png)
![[Obayashi] IR & SR Policy — Feeding Dialogue Back into Management](https://japan-equity.com/wp-content/uploads/2026/07/p32_sq-1024x1024.jpg)
![[Obayashi] Real Estate Development — 18.7% Margin, ¥287.7bn Unrealized Gains](https://japan-equity.com/wp-content/uploads/2026/07/p20_sq-1024x1024.jpg)
![[Obayashi] Domestic Civil Engineering — Resilience Spending Supports 9.6% Margin](https://japan-equity.com/wp-content/uploads/2026/07/p11_sq-1024x1024.jpg)
![[Obayashi] Share Price & External Ratings — vs TOPIX, ESG Index Inclusion](https://japan-equity.com/wp-content/uploads/2026/07/p40_sq-1024x1024.jpg)
![[Construction] ¥75.5tn Investment, Shrinking Workforce — Big-5 Market Share](https://japan-equity.com/wp-content/uploads/2026/07/p12_sq-1024x1024.jpg)



![[Obayashi] Capital Policy & Shareholder Returns — ROE 10%+, DOE ~5%, ¥100bn Buyback](https://japan-equity.com/wp-content/uploads/2026/07/p27_sq-1024x1024.jpg)
![[Obayashi] Reducing Cross-Shareholdings — ¥285.2bn Sold in Five Years](https://japan-equity.com/wp-content/uploads/2026/07/p29_sq-1024x1024.jpg)
![[Obayashi] ¥750bn Investment Plan — ¥300bn to Development, ¥190bn to Tech/DX](https://japan-equity.com/wp-content/uploads/2026/07/p30_sq-1024x1024.jpg)
![[Obayashi] MTP2022 KPIs — Operating Profit ~2x Target, ROE 14.4%](https://japan-equity.com/wp-content/uploads/2026/07/p25_sq-1024x1024.jpg)
![[Obayashi] Cash Allocation — ¥420bn Investment CF Over Five Years](https://japan-equity.com/wp-content/uploads/2026/07/p26_sq-1024x1024.jpg)
![[Obayashi] Green Energy — 44 Plants, 344MW, and the Green Hydrogen Challenge](https://japan-equity.com/wp-content/uploads/2026/07/p21_sq-1024x1024.jpg)
![[Obayashi] Tackling the Labor Shortage — Robotics Construction®](https://japan-equity.com/wp-content/uploads/2026/07/p14_sq-1024x1024.jpg)
