
This article is based on publicly available IR materials and is not a recommendation to buy or sell any specific securities.
Note: SQUARE ENIX HOLDINGS labels the fiscal year covered here as “FY2026/3” (the fiscal year ended March 31, 2026); this article follows our site convention of classifying the most recently completed fiscal year as FY2025, while all figures, tables and year labels below are kept exactly as they appear in the company’s materials.
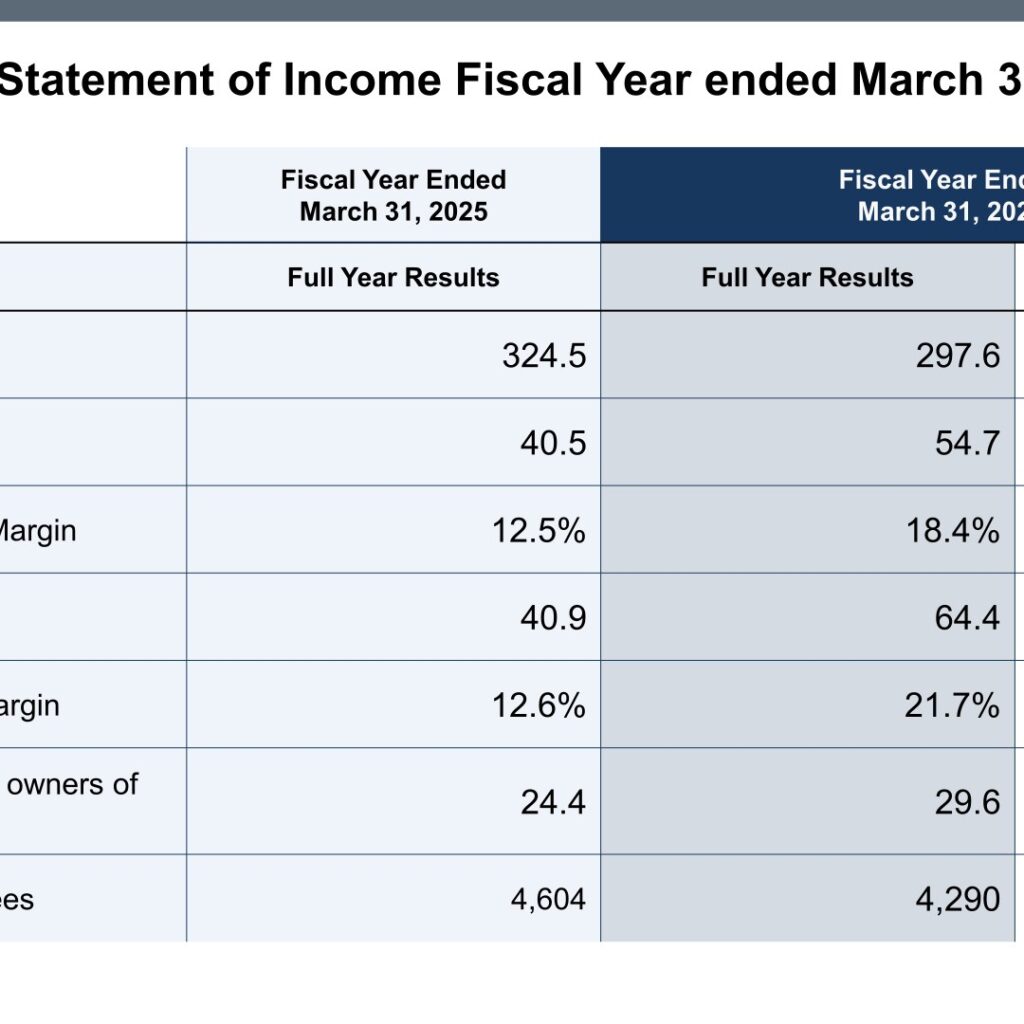
SQUARE ENIX HOLDINGS reported net sales of ¥297.6 billion for the fiscal year ended March 31, 2026, down ¥26.9 billion year on year, while operating income rose ¥14.2 billion to ¥54.7 billion. The company states that operating income increased on improved profitability in the Digital Entertainment segment despite lower net sales year on year. Ordinary income was ¥64.4 billion and profit attributable to owners of parent was ¥29.6 billion. Figures are presented in billions of yen, with amounts under one hundred million yen rounded down.
Consolidated Results (Full-Year Actual)
The operating income margin improved 5.9pt to 18.4% and the ordinary income margin improved 9.1pt to 21.7%. The number of employees declined by 314 to 4,290.
| Item (Billions of Yen) | FY Ended March 31, 2026 | FY Ended March 31, 2025 | Changes |
|---|---|---|---|
| Net Sales | 297.6 | 324.5 | (26.9) |
| Operating Income | 54.7 | 40.5 | 14.2 |
| Operating Income Margin | 18.4% | 12.5% | 5.9pt |
| Ordinary Income | 64.4 | 40.9 | 23.5 |
| Ordinary Income Margin | 21.7% | 12.6% | 9.1pt |
| Profit attributable to owners of parent | 29.6 | 24.4 | 5.2 |
| Number of Employees | 4,290 | 4,604 | (314) |
On a three-year view the materials show net sales of 356.3 in FY2024/3, 324.5 in FY2025/3 and 297.6 in FY2026/3, with operating income of 32.5, 40.5 and 54.7 and profit attributable to owners of parent of 14.9, 24.4 and 29.6 over the same periods (billions of yen).
Segment Results
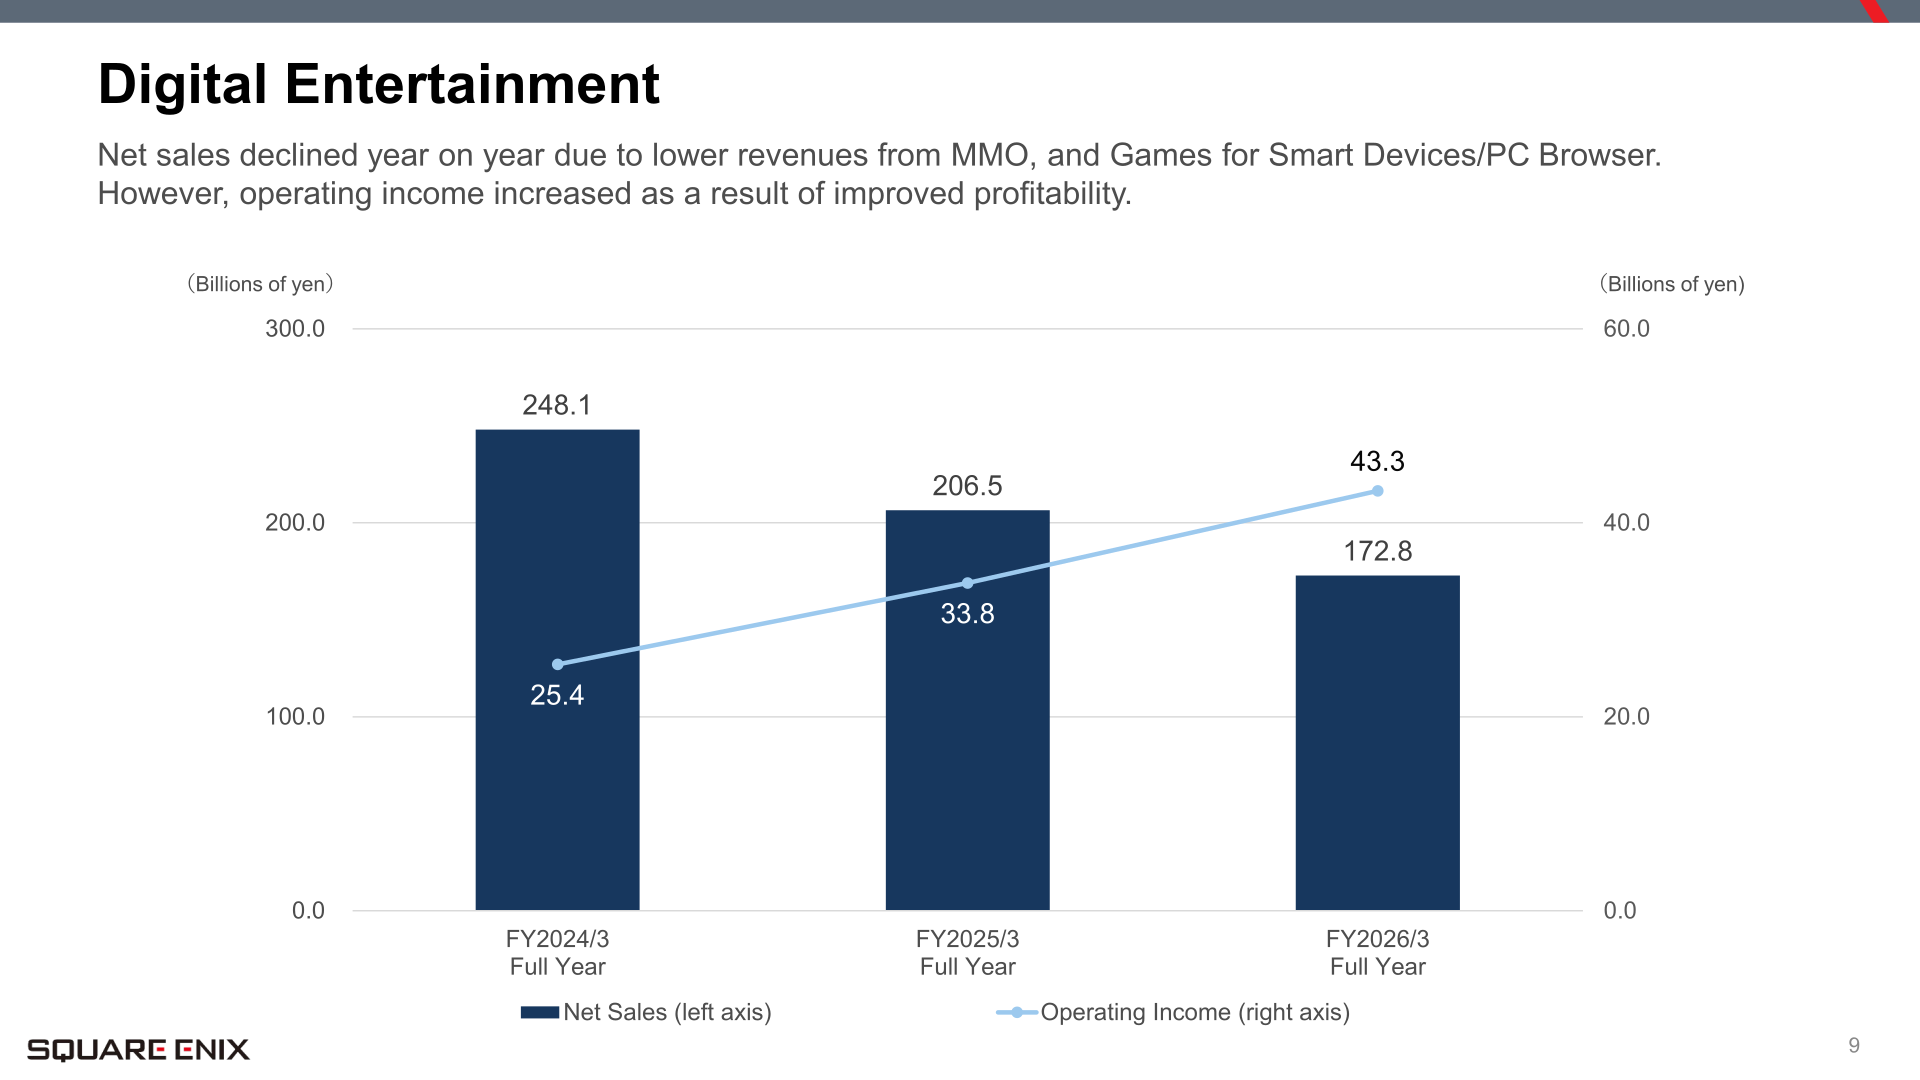
Digital Entertainment net sales fell ¥33.7 billion to ¥172.8 billion while its operating income rose ¥9.5 billion to ¥43.3 billion, lifting the segment’s operating income margin by 8.7pt to 25.1%. Amusement, Merchandising and the eliminations line are shown alongside below.
| Segment (Billions of Yen) | Metric | FY Ended March 31, 2026 | FY Ended March 31, 2025 | Changes |
|---|---|---|---|---|
| Digital Entertainment | Net sales | 172.8 | 206.5 | (33.7) |
| Amusement | Net sales | 72.1 | 71.2 | 0.9 |
| Publication | Net sales | 29.7 | 30.7 | (1.0) |
| Merchandising | Net sales | 25.0 | 19.0 | 6.0 |
| Eliminations or unallocated | Net sales | (2.1) | (3.0) | 0.9 |
| Digital Entertainment | Operating income | 43.3 | 33.8 | 9.5 |
| Amusement | Operating income | 8.8 | 7.8 | 1.0 |
| Publication | Operating income | 9.8 | 10.9 | (1.1) |
| Merchandising | Operating income | 11.2 | 6.0 | 5.2 |
| Eliminations or unallocated | Operating income | (18.5) | (18.1) | (0.4) |
| Digital Entertainment | Operating income margin | 25.1% | 16.4% | 8.7pt |
| Amusement | Operating income margin | 12.3% | 11.0% | 1.3pt |
| Publication | Operating income margin | 33.2% | 35.7% | (2.5pt) |
| Merchandising | Operating income margin | 44.8% | 31.8% | 13.0pt |
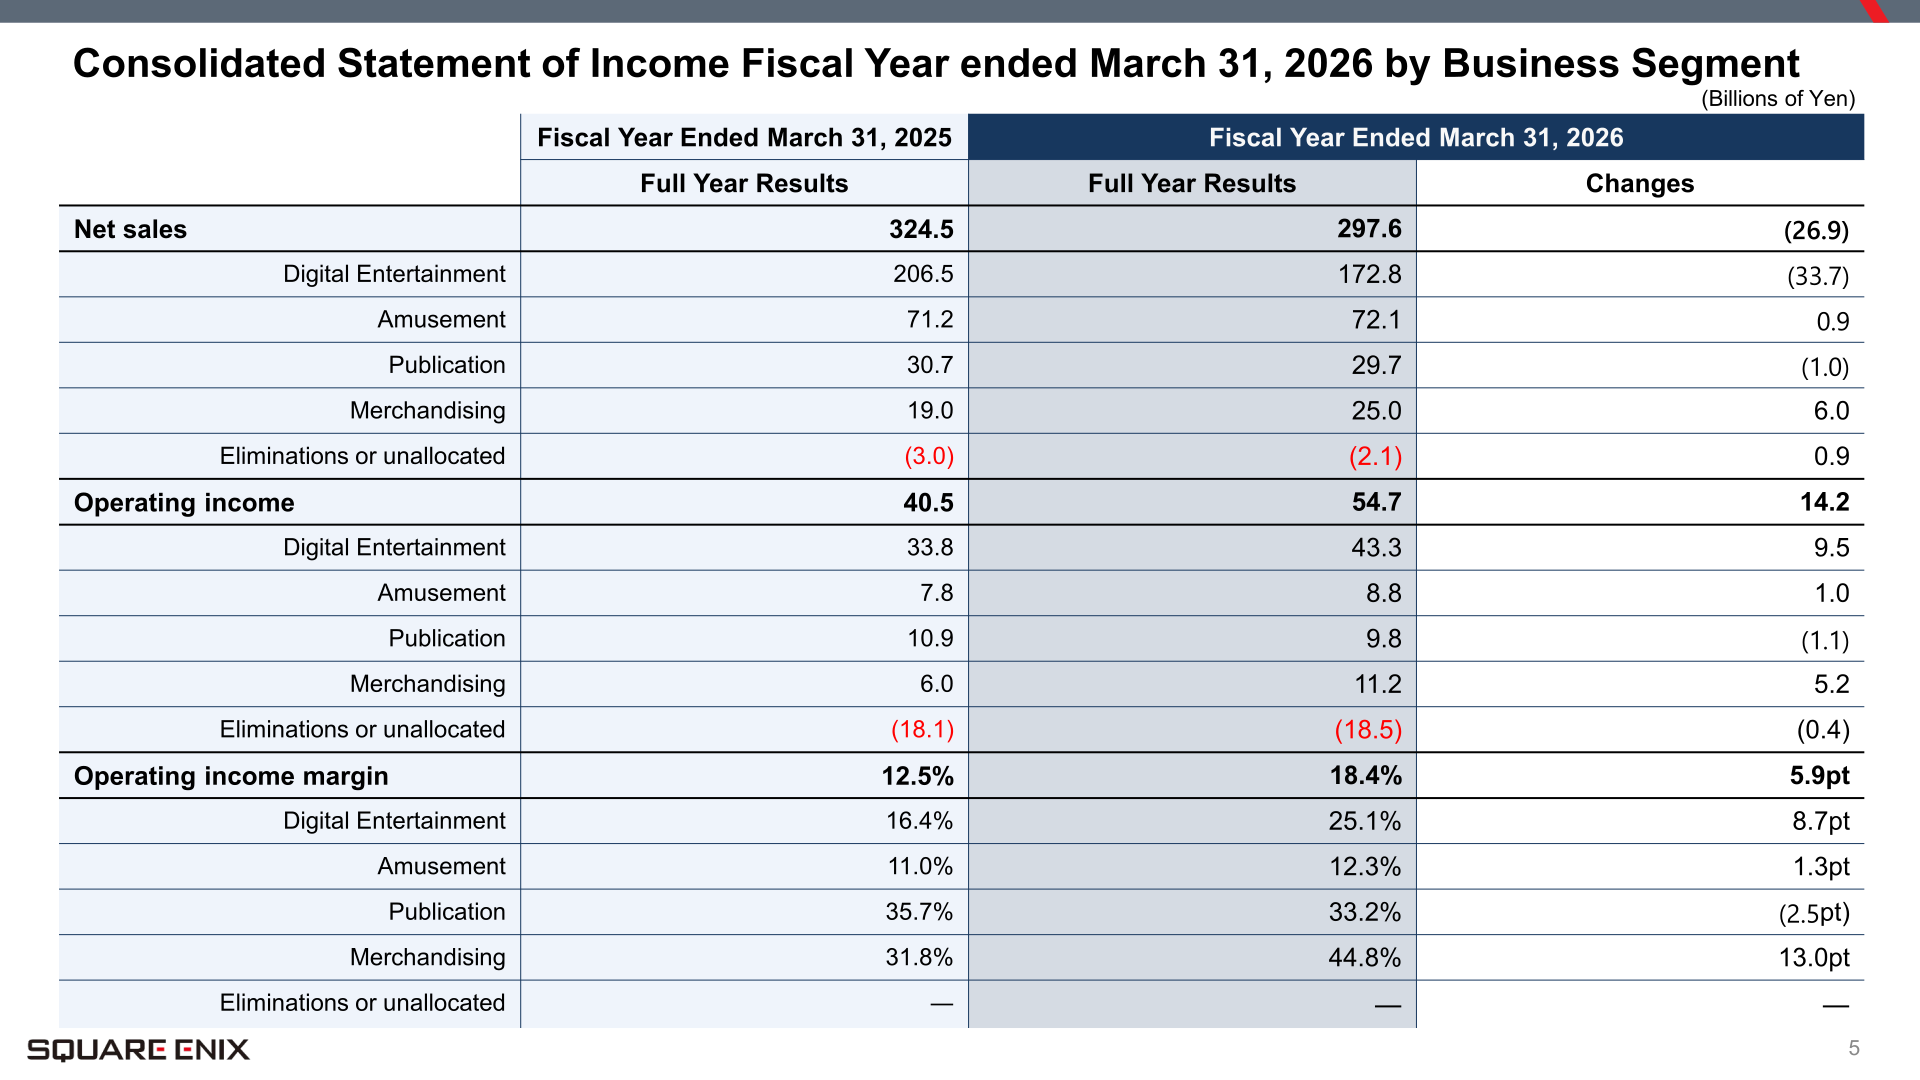
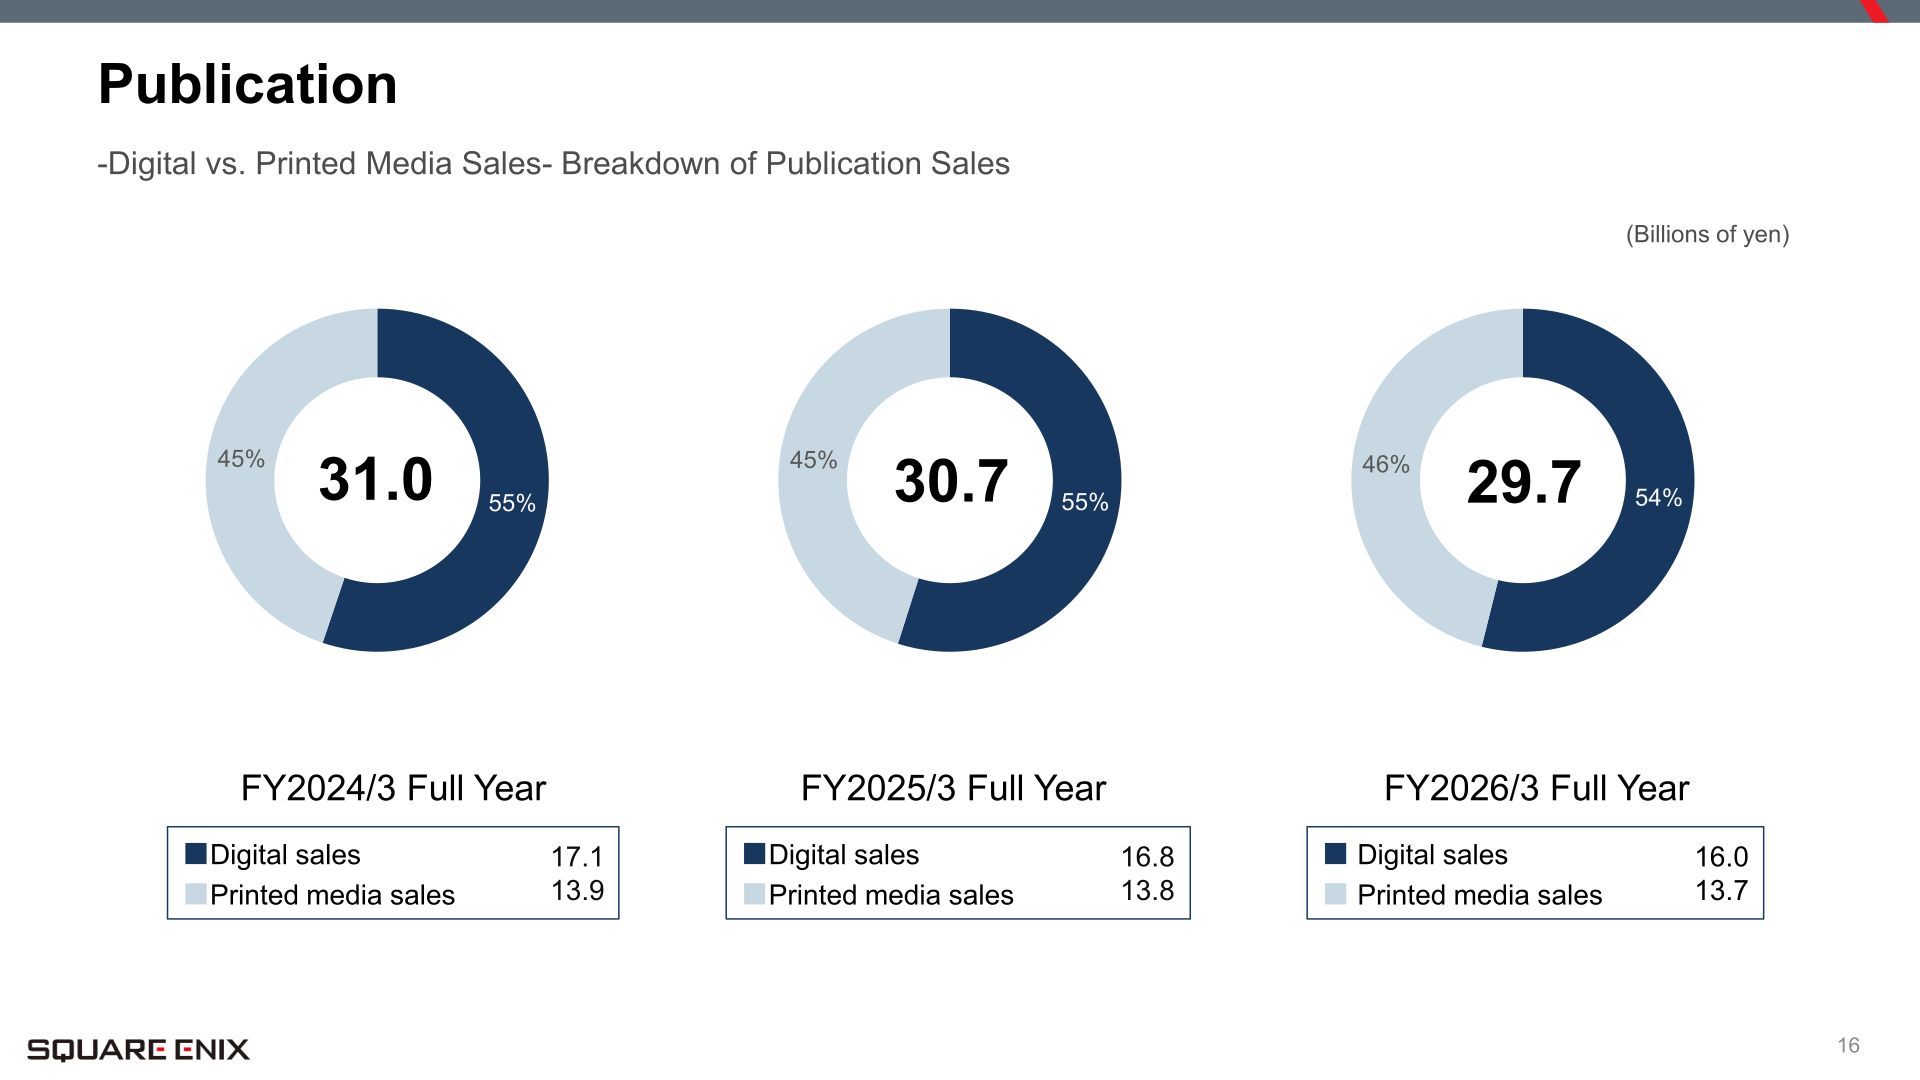
In Amusement, although sales of amusement machines fell year on year, both net sales and operating income increased, driven by higher same-store sales and increased sales of prize items to amusement facilities. Publication net sales and operating income decreased year on year due to a decline in comic book sales; within Publication, digital sales were 16.0 (54%) and printed media sales were 13.7 (46%) in FY2026/3, against 16.8 (55%) and 13.8 (45%) in FY2025/3 (billions of yen). Merchandising net sales and operating income increased year on year, driven by the recognition of royalty income from key IP.
Digital Entertainment: Sub-Business Performance
HD Games profit increased, supported by steady sales of new titles and higher sales of catalogue titles year on year. In MMO, both net sales and operating income decreased year on year due to the release of the “FINAL FANTASY XIV” expansion pack in the previous year. In Games for Smart Devices/PC Browser, operating income increased year on year, driven by improved profitability through diversification of payment methods and optimization of operating costs.
| Sub-business | Net Sales (FY2026/3) | Net Sales (Prior FY) | Change | Operating Income / Profit (FY2026/3) | Operating Income / Profit (Prior FY) | Change |
|---|---|---|---|---|---|---|
| HD Games | ¥76.5 billion | ¥75.1 billion | up ¥1.4 billion YoY | ¥14.1 billion | ¥3.3 billion | up ¥10.8 billion YoY |
| MMO | ¥41.0 billion | ¥55.5 billion | down ¥14.5 billion YoY | ¥15.1 billion | ¥21.9 billion | down ¥6.8 billion YoY |
| Games for Smart Devices/PC Browser | ¥55.2 billion | ¥75.8 billion | down ¥20.6 billion YoY | ¥14.0 billion | ¥8.5 billion | up ¥5.5 billion YoY |
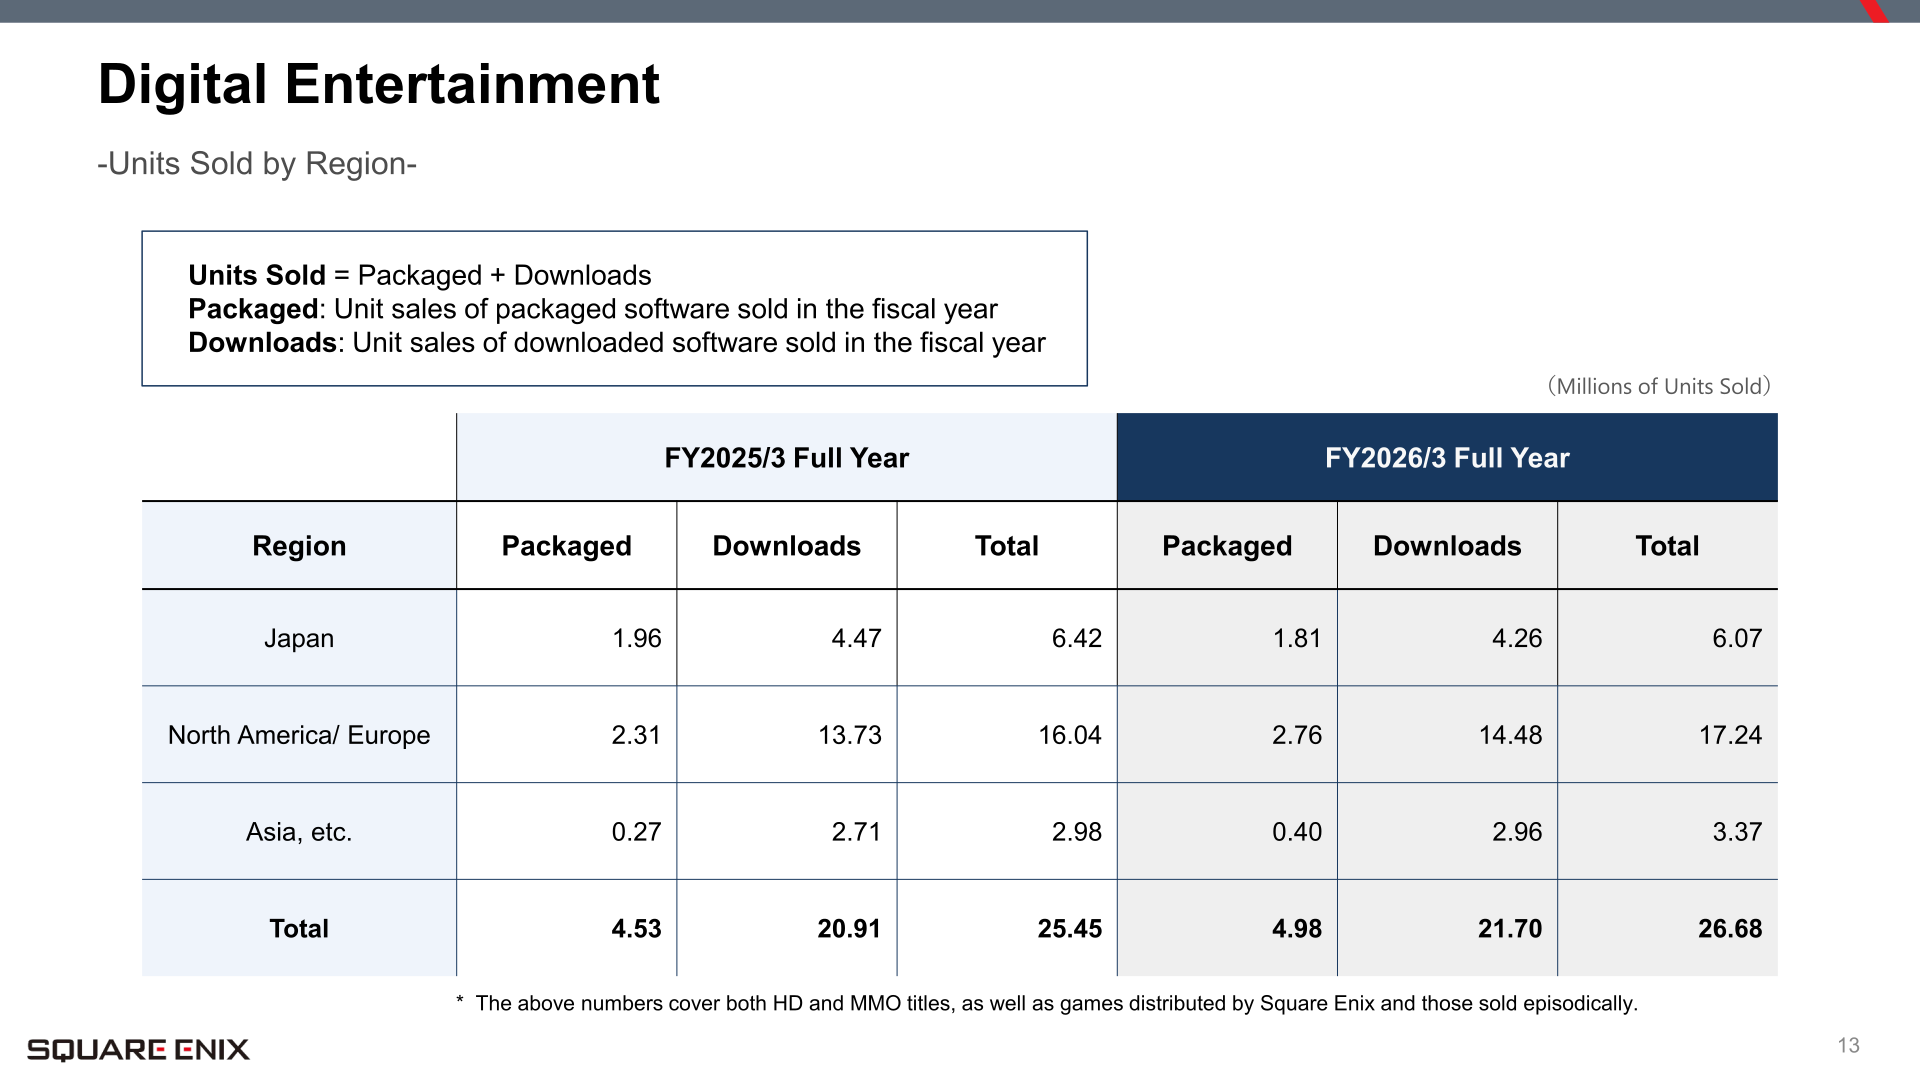
Digital Entertainment: Units Sold by Region
Total units sold rose to 26.68 million from 25.45 million, with North America/Europe accounting for 17.24 million. Units Sold is defined in the materials as Packaged plus Downloads, and the figures cover both HD and MMO titles, as well as games distributed by Square Enix and those sold episodically.
| Region (Millions of Units Sold) | Packaged (FY2026/3) | Downloads (FY2026/3) | Total (FY2026/3) | Total (FY2025/3) |
|---|---|---|---|---|
| Japan | 1.81 | 4.26 | 6.07 | 6.42 |
| North America/ Europe | 2.76 | 14.48 | 17.24 | 16.04 |
| Asia, etc. | 0.40 | 2.96 | 3.37 | 2.98 |
| Total | 4.98 | 21.70 | 26.68 | 25.45 |
Financial Position
Total assets stood at ¥438.0 billion as of March 31, 2026, up ¥21.9 billion from a year earlier. Cash and deposits increased ¥28.3 billion to ¥276.0 billion and the content production account was ¥46.2 billion, down ¥0.7 billion. Total liabilities were ¥88.7 billion, including income taxes payable of ¥16.1 billion (up ¥13.6 billion), and total net assets were ¥349.2 billion, up ¥12.9 billion.
Full-Year Forecast
The Financial Results Briefing Session materials for the fiscal year ended March 31, 2026 do not present an earnings forecast for the following fiscal year. This cannot be confirmed from the materials.
Shareholder Returns
The Financial Results Briefing Session materials for the fiscal year ended March 31, 2026 do not present dividends or other shareholder return measures. This cannot be confirmed from the materials.
This article is an analysis based on publicly available information and is not a recommendation to buy or sell any specific securities. Investment decisions are your own responsibility.
![[Obayashi] Investors’ Guide 2026 — The Complete 24-Article Breakdown](https://japan-equity.com/wp-content/uploads/2026/07/hub_cover-1024x1024.png)
![[Obayashi] IR & SR Policy — Feeding Dialogue Back into Management](https://japan-equity.com/wp-content/uploads/2026/07/p32_sq-1024x1024.jpg)
![[Obayashi] Real Estate Development — 18.7% Margin, ¥287.7bn Unrealized Gains](https://japan-equity.com/wp-content/uploads/2026/07/p20_sq-1024x1024.jpg)
![[Obayashi] Domestic Civil Engineering — Resilience Spending Supports 9.6% Margin](https://japan-equity.com/wp-content/uploads/2026/07/p11_sq-1024x1024.jpg)
![[Obayashi] Share Price & External Ratings — vs TOPIX, ESG Index Inclusion](https://japan-equity.com/wp-content/uploads/2026/07/p40_sq-1024x1024.jpg)
![[Construction] ¥75.5tn Investment, Shrinking Workforce — Big-5 Market Share](https://japan-equity.com/wp-content/uploads/2026/07/p12_sq-1024x1024.jpg)



![[Obayashi] Capital Policy & Shareholder Returns — ROE 10%+, DOE ~5%, ¥100bn Buyback](https://japan-equity.com/wp-content/uploads/2026/07/p27_sq-1024x1024.jpg)
![[Obayashi] Reducing Cross-Shareholdings — ¥285.2bn Sold in Five Years](https://japan-equity.com/wp-content/uploads/2026/07/p29_sq-1024x1024.jpg)
![[Obayashi] ¥750bn Investment Plan — ¥300bn to Development, ¥190bn to Tech/DX](https://japan-equity.com/wp-content/uploads/2026/07/p30_sq-1024x1024.jpg)
![[Obayashi] MTP2022 KPIs — Operating Profit ~2x Target, ROE 14.4%](https://japan-equity.com/wp-content/uploads/2026/07/p25_sq-1024x1024.jpg)
![[Obayashi] Cash Allocation — ¥420bn Investment CF Over Five Years](https://japan-equity.com/wp-content/uploads/2026/07/p26_sq-1024x1024.jpg)
![[Obayashi] Green Energy — 44 Plants, 344MW, and the Green Hydrogen Challenge](https://japan-equity.com/wp-content/uploads/2026/07/p21_sq-1024x1024.jpg)
![[Obayashi] Tackling the Labor Shortage — Robotics Construction®](https://japan-equity.com/wp-content/uploads/2026/07/p14_sq-1024x1024.jpg)
