
This article is based on publicly available IR materials and is not a recommendation to buy or sell any specific securities.
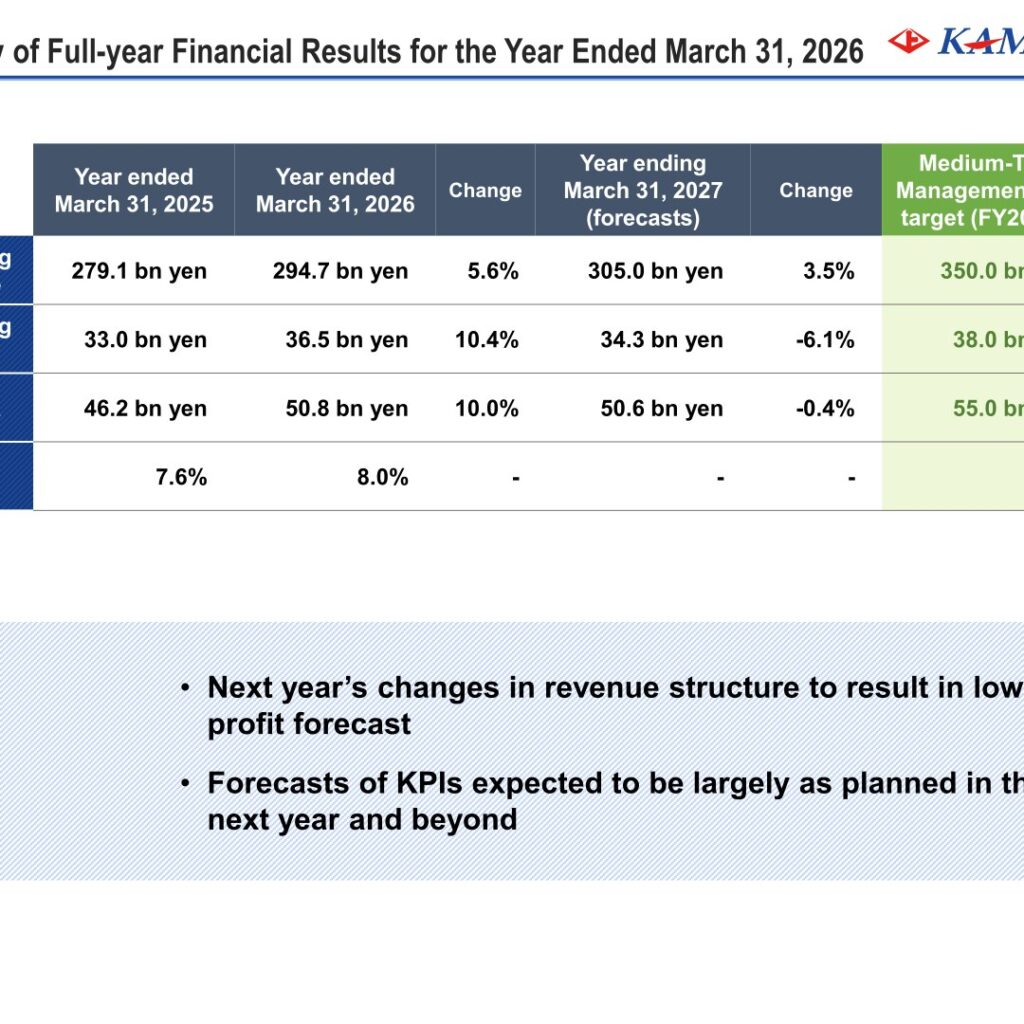
Note: Kamigumi’s presentation materials label the fiscal year ended March 31, 2026 as “FY2026/3”; this article follows this site’s convention of using “FY2025” in the title and slug for the most recently completed fiscal year, while all tables, charts and text below keep the labels used in the materials. Kamigumi Co., Ltd. reported operating revenue of 294,758 million yen for the year ended March 31, 2026, up 5.6% year on year, with operating profit of 36,544 million yen (up 10.4%), ordinary profit of 40,685 million yen (up 11.0%) and profit attributable to owners of parent of 31,262 million yen (up 16.1%). EBITDA came to 50,801 million yen and ROE improved to 8.0% from 7.6%. For the year ending March 31, 2027 the company forecasts operating revenue of 305,000 million yen but lower profits, with operating profit of 34,300 million yen and profit attributable to owners of parent of 27,340 million yen.
Consolidated Results (Full-Year Actual)
Operating revenue rose 5.6% year on year due to an increase in consolidated subsidiaries and higher container handling volumes, while operating profit was up 10.4% on improved profitability from increased revenue. Ordinary profit gained 11.0% on higher gains on equity method investments, and profit attributable to owners of parent advanced 16.1% on gains from the sale of leased real estate and cross-shareholdings. In the company’s own analysis of the ordinary profit bridge, cost increases were absorbed by the receipt of appropriate unit prices, and the profit increase was driven by temporary factors.
| Item (Millions of yen) | Year ended March 31, 2025 | Year ended March 31, 2026 | Change (%) | Progress (%) |
|---|---|---|---|---|
| Operating revenue | 279,182 | 294,758 | 5.6 | 102.7 |
| Operating costs | 223,646 | 232,627 | 4.0 | – |
| Selling, general, and administrative expenses | 22,440 | 25,586 | 14.0 | – |
| Operating profit | 33,095 | 36,544 | 10.4 | 104.4 |
| EBITDA | 46,286 | 50,801 | 9.8 | 105.4 |
| Ordinary profit | 36,655 | 40,685 | 11.0 | 103.8 |
| Profit attributable to owners of parent | 26,935 | 31,262 | 16.1 | 106.3 |
On the balance sheet, total assets increased 9.6% to 538,407 million yen, with non-current assets up 16.2% to 388,872 million yen and intangible assets up 286.9% to 25,865 million yen. Total net assets rose 3.5% to 397,859 million yen. Cash flows from operating activities were 35,717 million yen, while cash flows from investing activities were -60,608 million yen, producing free cash flow of -24,890 million yen; cash and cash equivalents at the end of the period stood at 69,189 million yen. Capital investment measured as the increase in non-current assets (based on completed construction) totaled 14,852 million yen, of which 13,958 million yen was in the Distribution Business, and included the Harumi Logistics Center, a new warehouse in the Port of Tomakomai, Hokkaido, with a floor area of 26,082.30 m2 completed on September 1, 2025.
Segment Results
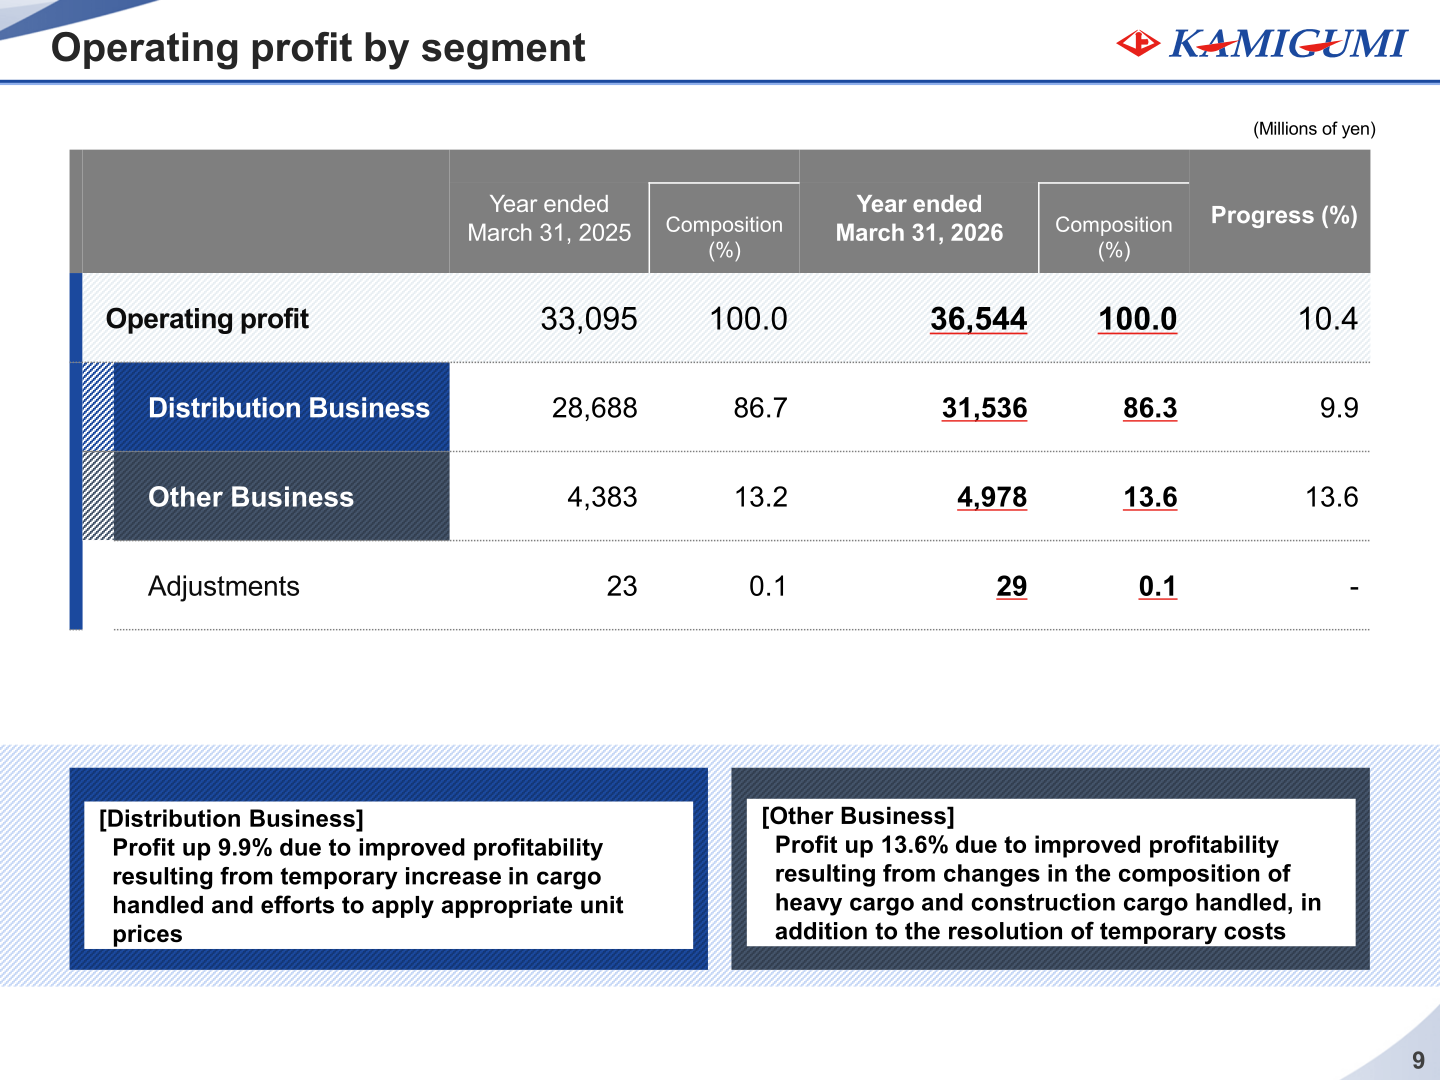
In the Distribution Business, operating revenue was up 7.4% due to growth in volumes handled of grains, feeds, and fruits and in container handling volumes, and profit was up 9.9% due to improved profitability resulting from a temporary increase in cargo handled and efforts to apply appropriate unit prices. In the Other Business, operating revenue was down 4.5% due to lower sales of fuel and other goods, while profit was up 13.6% due to improved profitability resulting from changes in the composition of heavy cargo and construction cargo handled, in addition to the resolution of temporary costs.
| Metric | Segment | Year ended March 31, 2025 | Composition (%) | Year ended March 31, 2026 | Composition (%) | Progress (%) |
|---|---|---|---|---|---|---|
| Operating revenue | Total | 279,182 | 100.0 | 294,758 | 100.0 | 5.6 |
| Operating revenue | Distribution Business | 243,104 | 87.1 | 261,097 | 88.6 | 7.4 |
| Operating revenue | Other Business | 39,229 | 14.0 | 37,451 | 12.7 | -4.5 |
| Operating revenue | Adjustments | -3,151 | -1.1 | -3,790 | -1.3 | – |
| Operating profit | Total | 33,095 | 100.0 | 36,544 | 100.0 | 10.4 |
| Operating profit | Distribution Business | 28,688 | 86.7 | 31,536 | 86.3 | 9.9 |
| Operating profit | Other Business | 4,383 | 13.2 | 4,978 | 13.6 | 13.6 |
| Operating profit | Adjustments | 23 | 0.1 | 29 | 0.1 | – |
Container Handling Volumes
Container volume handled by Kamigumi totaled 2,681,377 TEU, up 260,535 TEU or 10.8% year on year. Growth was led by Hakata (up 55.3%), Osaka (up 27.9%) and Yokohama (up 26.2%), while Nagoya declined 1.0%.
| Port (TEU) | Year ended March 31, 2025 | Year ended March 31, 2026 | Change | Change (%) |
|---|---|---|---|---|
| Tokyo | 417,846 | 441,573 | 23,727 | 5.7 |
| Yokohama | 210,540 | 265,792 | 55,252 | 26.2 |
| Nagoya | 838,108 | 829,479 | -8,629 | -1.0 |
| Osaka | 263,550 | 337,177 | 73,627 | 27.9 |
| Kobe | 471,824 | 511,583 | 39,759 | 8.4 |
| Hakata | 88,865 | 138,009 | 49,144 | 55.3 |
| Other ports | 130,109 | 157,764 | 27,655 | 17.5 |
| Total | 2,420,842 | 2,681,377 | 260,535 | 10.8 |
Forecasts for the Year Ending March 31, 2027
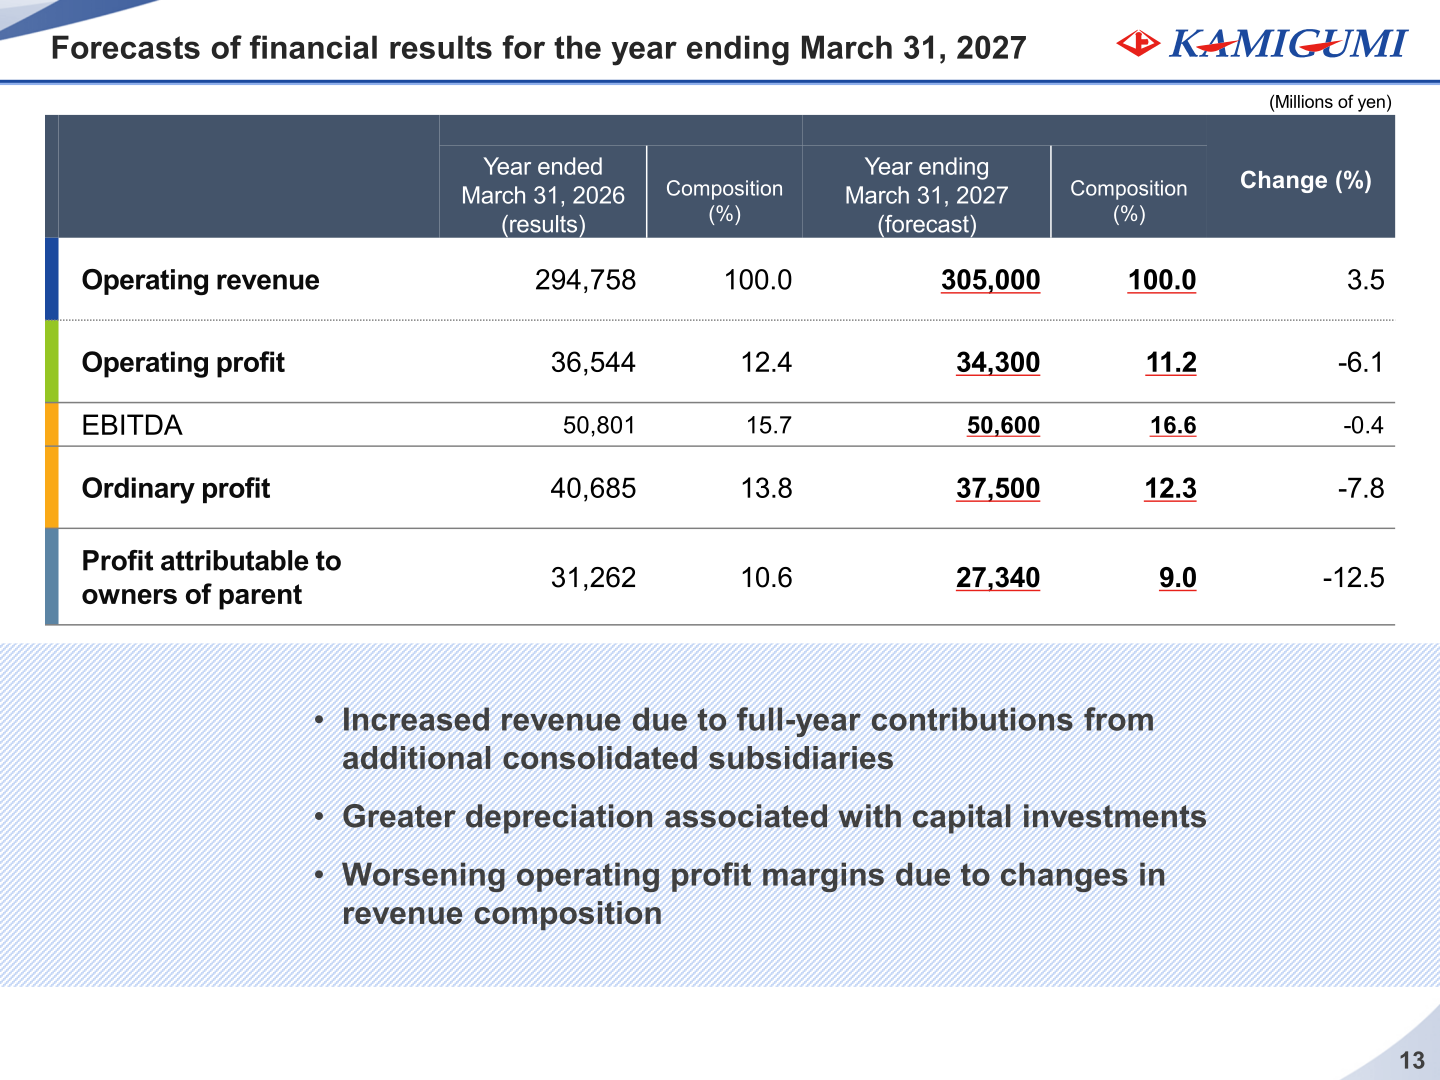
Kamigumi guides for higher revenue but lower profits in the year ending March 31, 2027. The company cites increased revenue due to full-year contributions from additional consolidated subsidiaries, greater depreciation associated with capital investments, and worsening operating profit margins due to changes in revenue composition. In the summary slide the company notes that next year’s changes in revenue structure will result in a lower profit forecast, and that forecasts of KPIs are expected to be largely as planned in the next year and beyond.
| Item (Millions of yen) | Year ended March 31, 2026 (results) | Composition (%) | Year ending March 31, 2027 (forecast) | Composition (%) | Change (%) |
|---|---|---|---|---|---|
| Operating revenue | 294,758 | 100.0 | 305,000 | 100.0 | 3.5 |
| Operating profit | 36,544 | 12.4 | 34,300 | 11.2 | -6.1 |
| EBITDA | 50,801 | 15.7 | 50,600 | 16.6 | -0.4 |
| Ordinary profit | 40,685 | 13.8 | 37,500 | 12.3 | -7.8 |
| Profit attributable to owners of parent | 31,262 | 10.6 | 27,340 | 9.0 | -12.5 |
Shareholder Returns
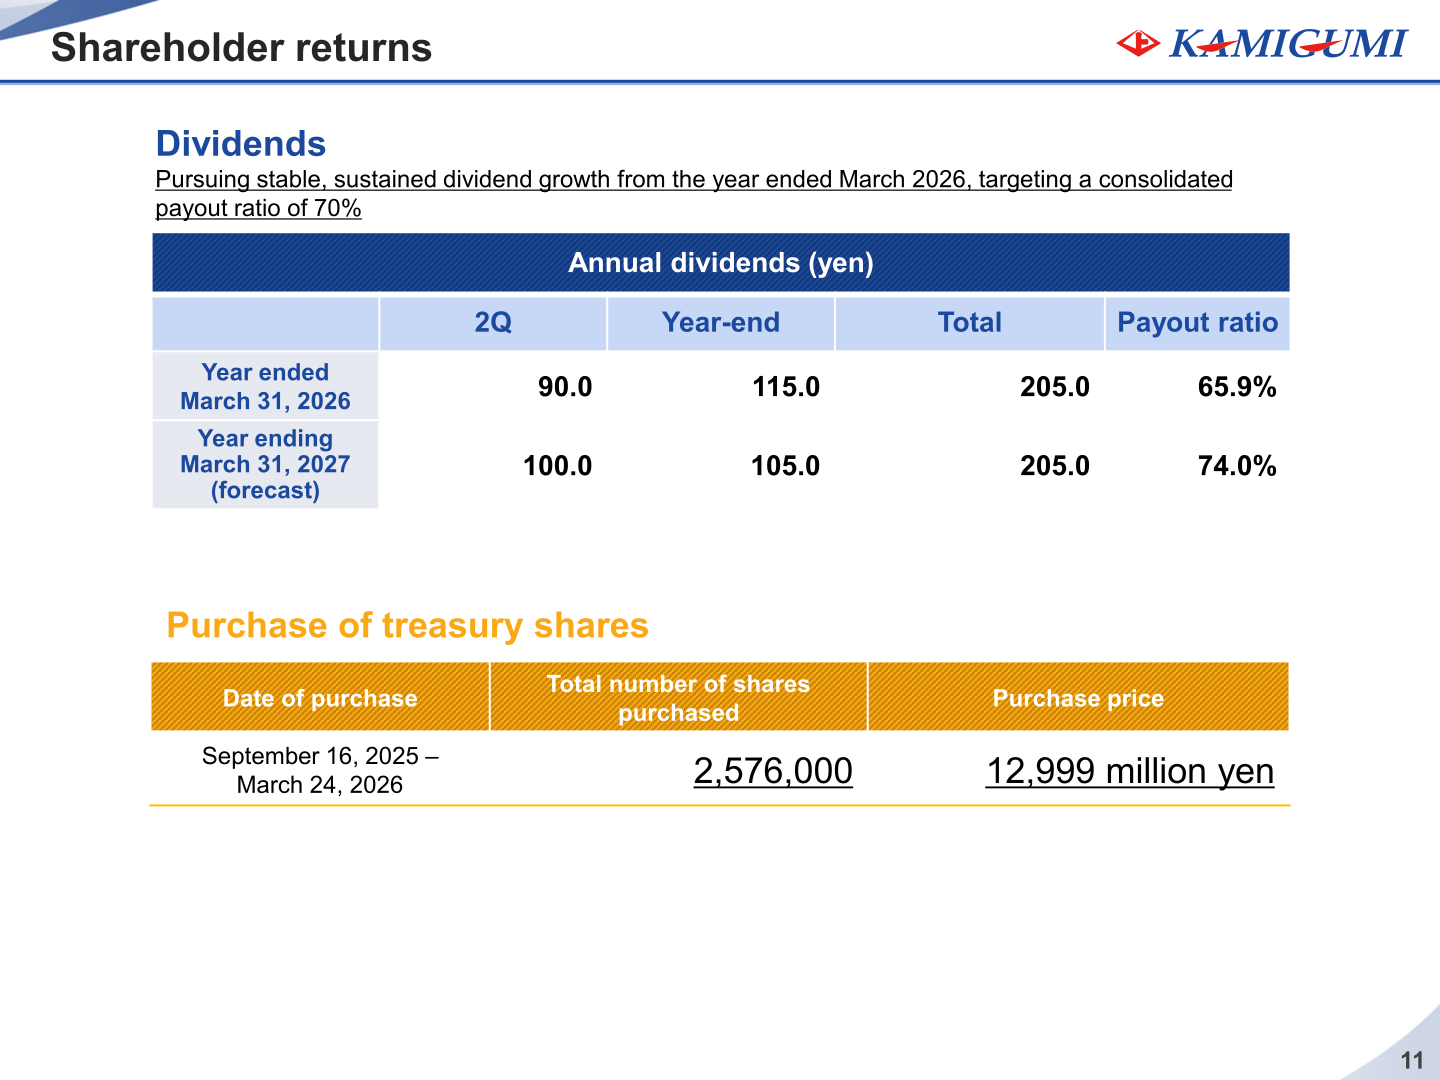
Kamigumi states that it is pursuing stable, sustained dividend growth from the year ended March 2026, targeting a consolidated payout ratio of 70%. The annual dividend for the year ended March 31, 2026 was 205.0 yen (2Q 90.0 yen, year-end 115.0 yen), for a payout ratio of 65.9%, and the forecast for the year ending March 31, 2027 is also 205.0 yen (2Q 100.0 yen, year-end 105.0 yen), for a payout ratio of 74.0%. The company also purchased 2,576,000 treasury shares for 12,999 million yen between September 16, 2025 and March 24, 2026.
| Annual dividends (yen) | 2Q | Year-end | Total | Payout ratio |
|---|---|---|---|---|
| Year ended March 31, 2026 | 90.0 | 115.0 | 205.0 | 65.9% |
| Year ending March 31, 2027 (forecast) | 100.0 | 105.0 | 205.0 | 74.0% |
Medium-Term Management Plan 2030
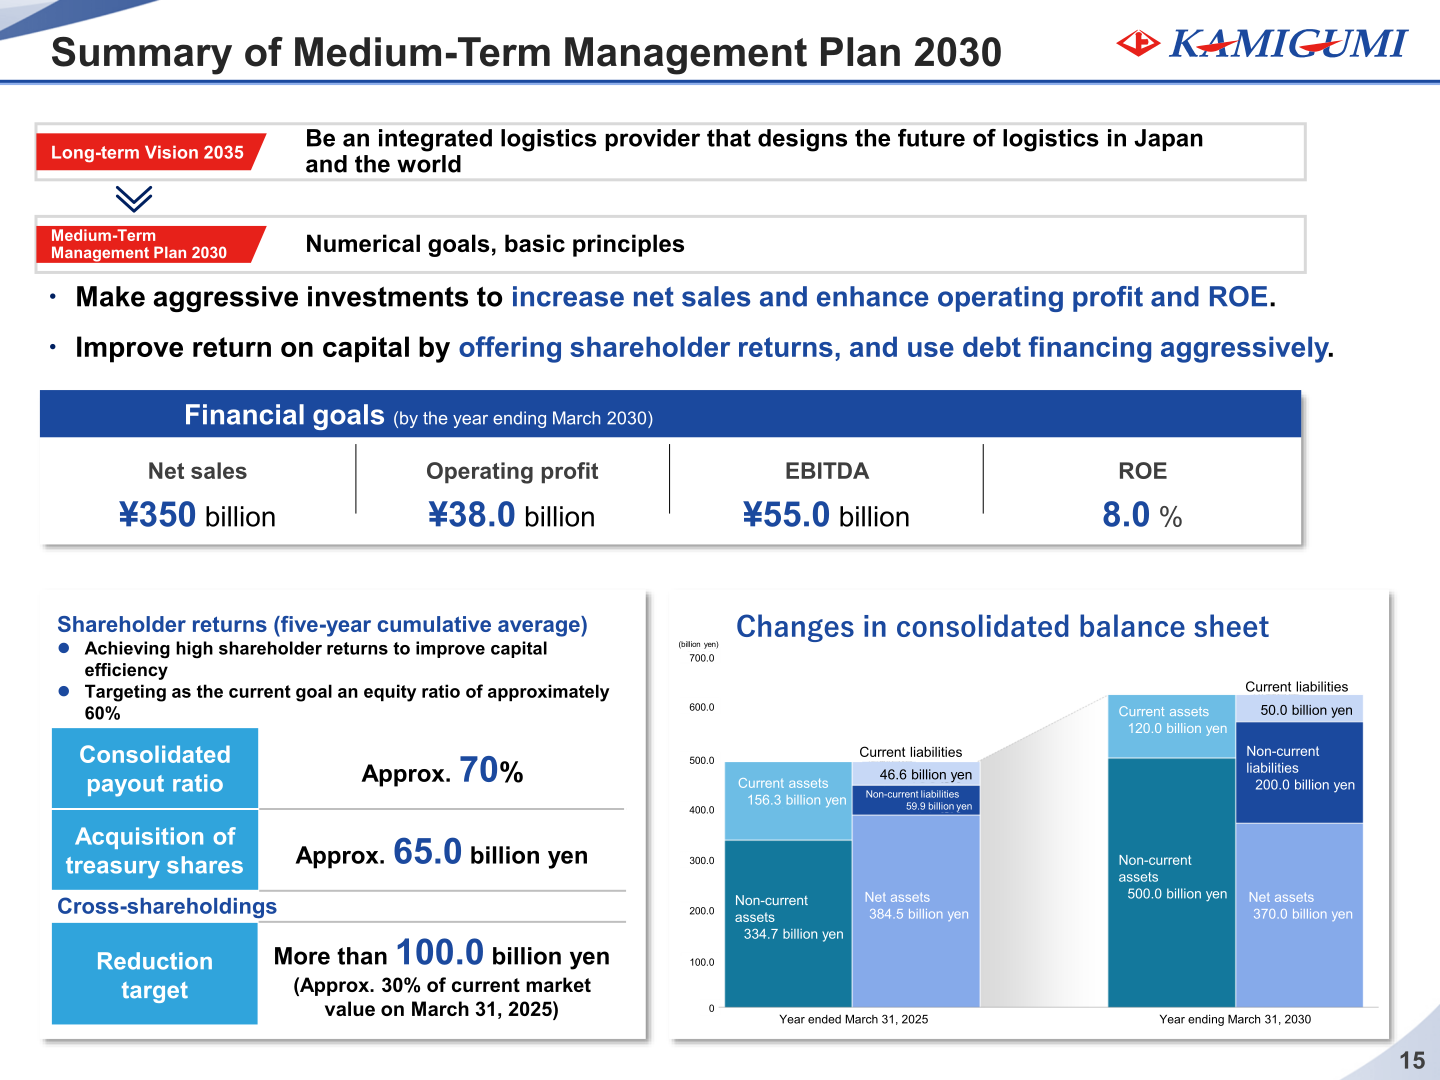
Under Long-term Vision 2035 — “Be an integrated logistics provider that designs the future of logistics in Japan and the world” — the Medium-Term Management Plan 2030 sets financial goals by the year ending March 2030 of net sales of ¥350 billion, operating profit of ¥38.0 billion, EBITDA of ¥55.0 billion and ROE of 8.0%. On shareholder returns (five-year cumulative average), the plan targets a consolidated payout ratio of approximately 70% and acquisition of treasury shares of approximately 65.0 billion yen, with a current goal of an equity ratio of approximately 60%.
The company states that both core businesses and growth businesses are performing largely according to plan and that no revisions of the Medium-Term Management Plan are planned at this time, although it notes that changes in customer production plans and supply chains, including raw materials procurement, could pose downside risks in light of the uncertain impact of the situation in Iran. Against a five-year cumulative fixed asset investment target of 187 billion yen (total plan of 243.0 billion yen including financing/purchases of 56.0 billion yen), results in the year ended March 2026 totaled 120.0 billion yen, comprising approximately 40.0 billion yen of financing/purchases (progress rate 71%) and approximately 80.0 billion yen of fixed asset investment (progress rate 42%). Investment projects included the acquisition of shares in Saurashtra Freight (India) and in KLKG Logistics Holdings, Co., Ltd., and investment in the Uminomori Hydrogen Station in Tokyo.
On cross-shareholdings, the target for the final fiscal year is a 30% reduction versus March 2025. The stated policy is to convert cross-shareholdings to cash corresponding to about 30% of the current market value as of March 31, 2025 (34.0 billion yen). The ending valuation of cross-shareholdings (listed and unlisted shares) was 46,435 million yen in FY2026/3, equivalent to 11.7% of consolidated net assets, and monetization in FY2026/3 amounted to 3,921 million yen.
This article is an analysis based on publicly available information and is not a recommendation to buy or sell any specific securities. Investment decisions are your own responsibility.
![[Obayashi] Investors’ Guide 2026 — The Complete 24-Article Breakdown](https://japan-equity.com/wp-content/uploads/2026/07/hub_cover-1024x1024.png)
![[Obayashi] IR & SR Policy — Feeding Dialogue Back into Management](https://japan-equity.com/wp-content/uploads/2026/07/p32_sq-1024x1024.jpg)
![[Obayashi] Real Estate Development — 18.7% Margin, ¥287.7bn Unrealized Gains](https://japan-equity.com/wp-content/uploads/2026/07/p20_sq-1024x1024.jpg)
![[Obayashi] Domestic Civil Engineering — Resilience Spending Supports 9.6% Margin](https://japan-equity.com/wp-content/uploads/2026/07/p11_sq-1024x1024.jpg)
![[Obayashi] Share Price & External Ratings — vs TOPIX, ESG Index Inclusion](https://japan-equity.com/wp-content/uploads/2026/07/p40_sq-1024x1024.jpg)
![[Construction] ¥75.5tn Investment, Shrinking Workforce — Big-5 Market Share](https://japan-equity.com/wp-content/uploads/2026/07/p12_sq-1024x1024.jpg)



![[Obayashi] Capital Policy & Shareholder Returns — ROE 10%+, DOE ~5%, ¥100bn Buyback](https://japan-equity.com/wp-content/uploads/2026/07/p27_sq-1024x1024.jpg)
![[Obayashi] Reducing Cross-Shareholdings — ¥285.2bn Sold in Five Years](https://japan-equity.com/wp-content/uploads/2026/07/p29_sq-1024x1024.jpg)
![[Obayashi] ¥750bn Investment Plan — ¥300bn to Development, ¥190bn to Tech/DX](https://japan-equity.com/wp-content/uploads/2026/07/p30_sq-1024x1024.jpg)
![[Obayashi] MTP2022 KPIs — Operating Profit ~2x Target, ROE 14.4%](https://japan-equity.com/wp-content/uploads/2026/07/p25_sq-1024x1024.jpg)
![[Obayashi] Cash Allocation — ¥420bn Investment CF Over Five Years](https://japan-equity.com/wp-content/uploads/2026/07/p26_sq-1024x1024.jpg)
![[Obayashi] Green Energy — 44 Plants, 344MW, and the Green Hydrogen Challenge](https://japan-equity.com/wp-content/uploads/2026/07/p21_sq-1024x1024.jpg)
![[Obayashi] Tackling the Labor Shortage — Robotics Construction®](https://japan-equity.com/wp-content/uploads/2026/07/p14_sq-1024x1024.jpg)
