
This article is based on publicly available IR materials and is not a recommendation to buy or sell any specific securities.
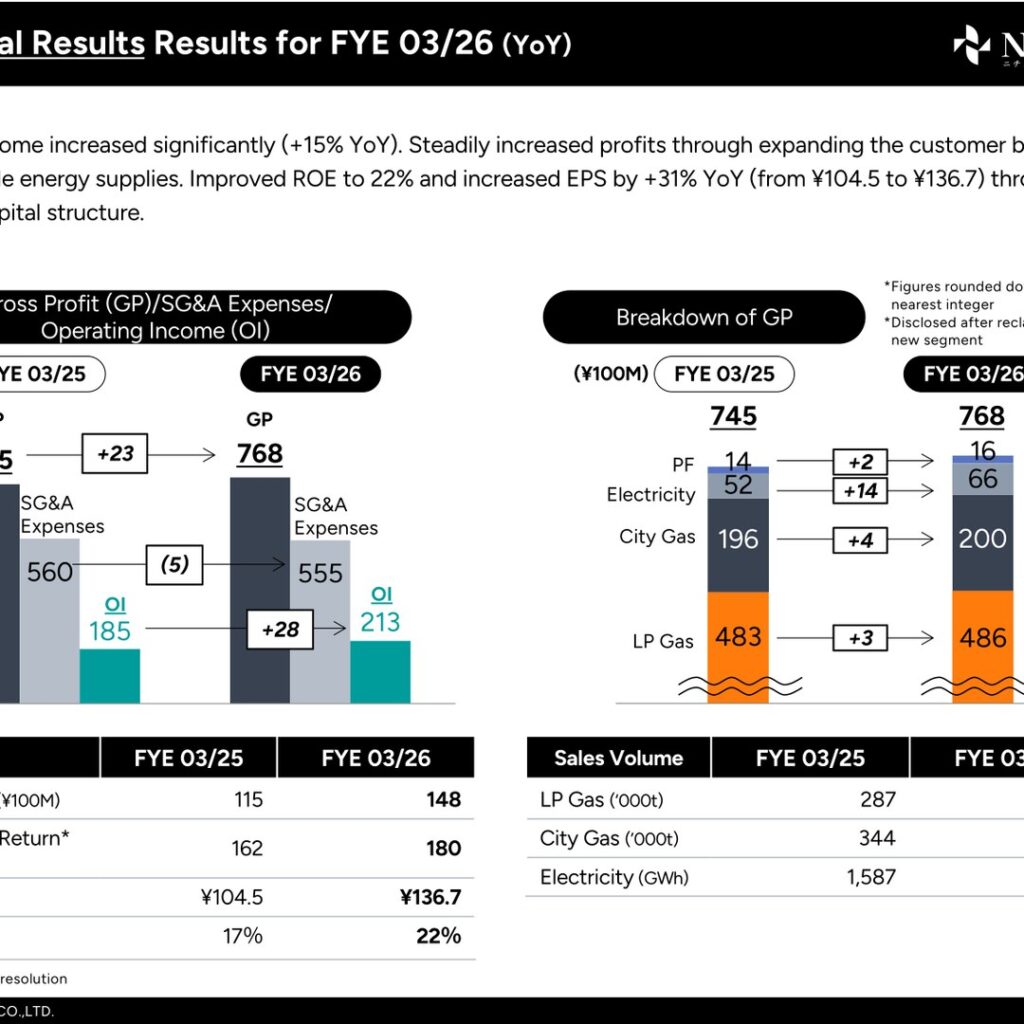
Note: NIPPON GAS CO., LTD. (NICIGAS) labels the fiscal year ended March 31, 2026 as “FYE 03/26,” and this article keeps the company’s labels in all text and tables while classifying the year as FY2025 under this site’s convention. In FYE 03/26 the company posted gross profit of 768 (¥100M) and operating income of 213 (¥100M), which it describes as an increase of +15% YoY, and net income of 148 (¥100M). ROE improved to 22% and EPS rose by +31% YoY from ¥104.5 to ¥136.7. For FYE 03/27 NICIGAS targets operating income of ¥20.0B, factoring in a -¥2.0B impact from rising raw material prices due to escalating tensions in the Mideast.
Consolidated Results (Full-Year Actual)
The company reports its results in units of ¥100M. Gross profit rose to 768 from 745, an increase of +23, while SG&A expenses declined to 555 from 560, a change of (5). Operating income was 213, up +28, and the presentation states operating income increased significantly (+15% YoY). Net income was 148 against 115 in the prior year, and shareholder return, based on board resolution, was 180 against 162. The company notes that net income achieved a record-high for five consecutive periods.
| Item (¥100M unless noted) | FYE 03/25 | FYE 03/26 | Change |
|---|---|---|---|
| Gross Profit (GP) | 745 | 768 | +23 |
| SG&A Expenses | 560 | 555 | (5) |
| Operating Income (OI) | 185 | 213 | +28 |
| Net Income | 115 | 148 | — |
| Shareholder Return (based on board resolution) | 162 | 180 | — |
| EPS | ¥104.5 | ¥136.7 | +31% YoY |
| ROE | 17% | 22% | — |
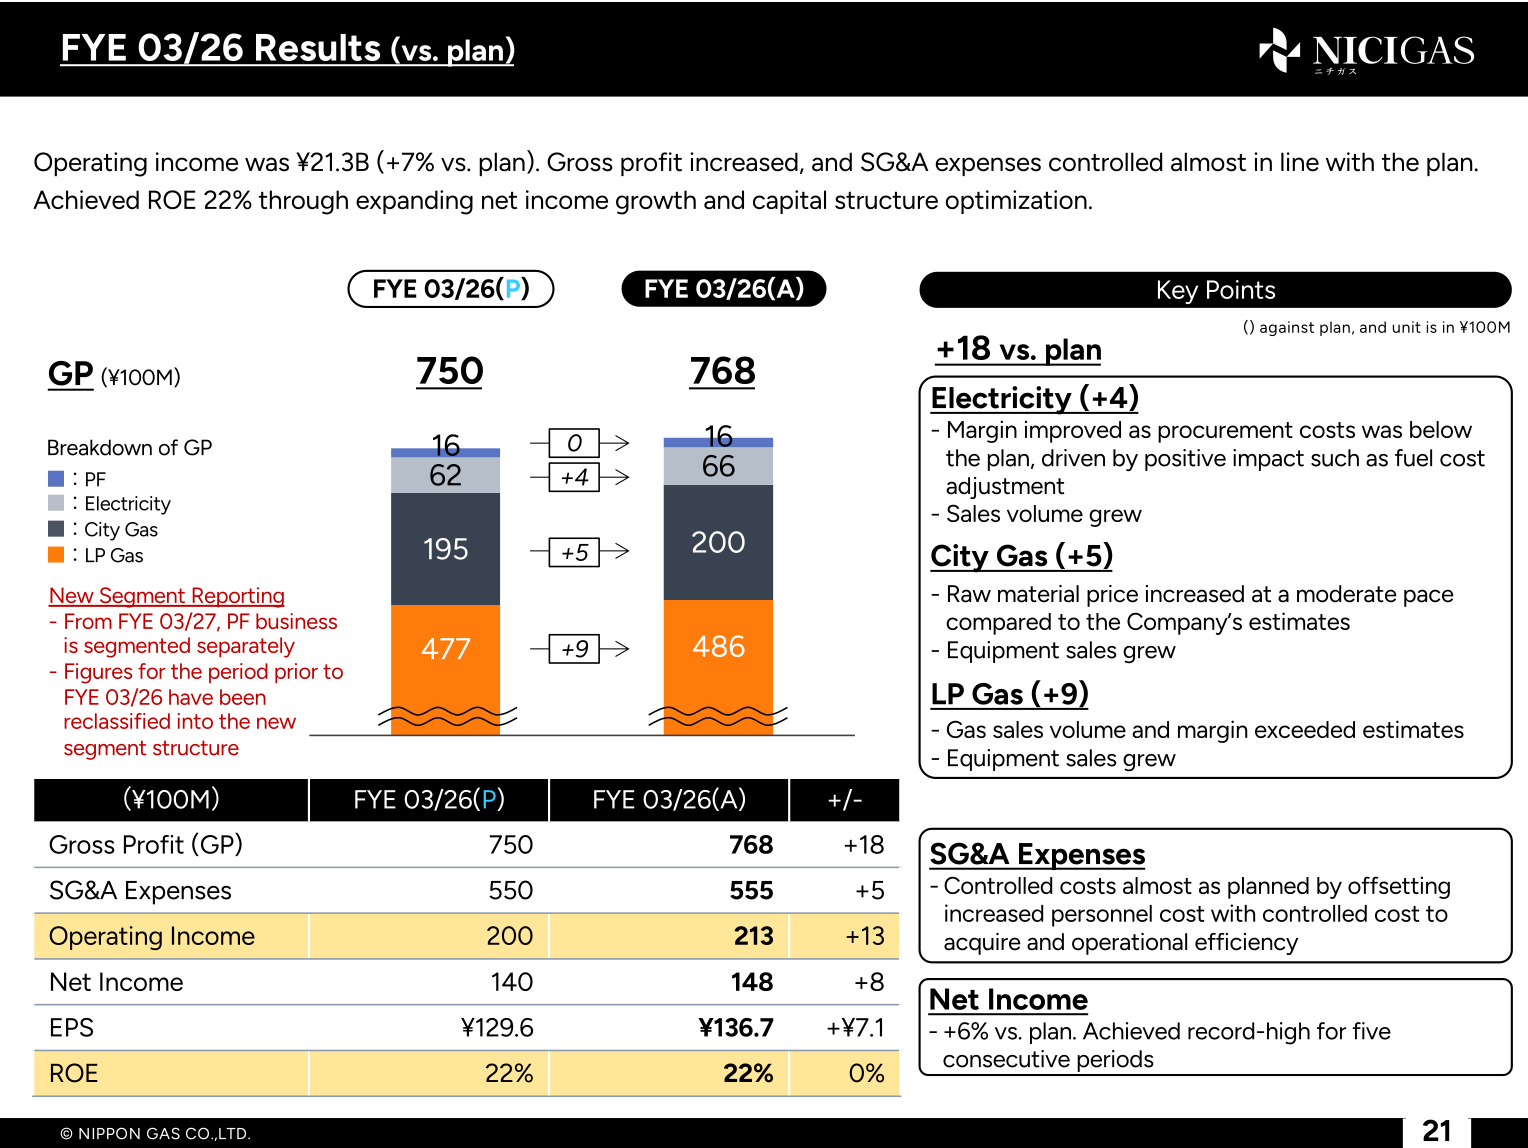
Against the company’s own plan for FYE 03/26, gross profit came in at 768 versus a plan of 750 (+18), SG&A expenses at 555 versus 550 (+5), operating income at 213 versus 200 (+13), and net income at 148 versus 140 (+8). EPS was ¥136.7 versus a planned ¥129.6 (+¥7.1), and ROE was 22% against a planned 22% (0%). The company describes operating income as ¥21.3B, +7% versus plan. By segment against plan, LP Gas contributed +9 as gas sales volume and margin exceeded estimates and equipment sales grew; City Gas +5 as raw material prices increased at a moderate pace compared with the company’s estimates and equipment sales grew; and Electricity +4 as margin improved with procurement costs below plan and sales volume grew.
| Item (¥100M unless noted) | FYE 03/26 (P) | FYE 03/26 (A) | +/- |
|---|---|---|---|
| Gross Profit (GP) | 750 | 768 | +18 |
| SG&A Expenses | 550 | 555 | +5 |
| Operating Income | 200 | 213 | +13 |
| Net Income | 140 | 148 | +8 |
| EPS | ¥129.6 | ¥136.7 | +¥7.1 |
| ROE | 22% | 22% | 0% |
Segment Results
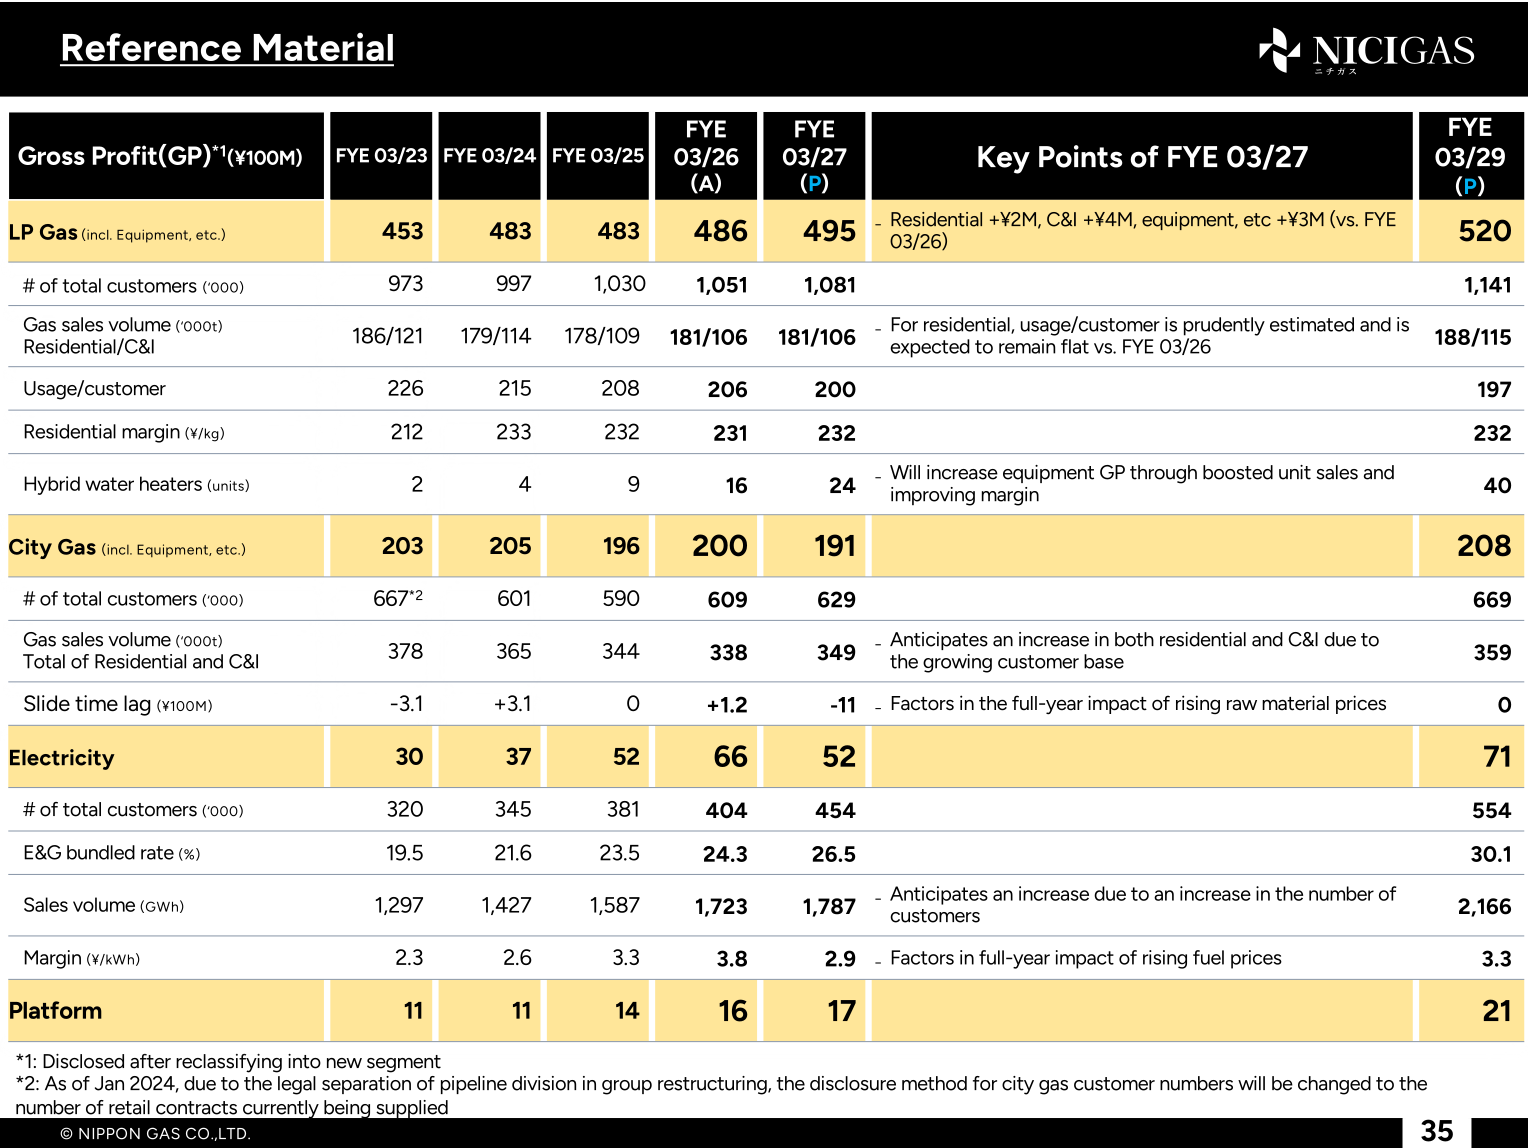
The company discloses gross profit by segment after reclassifying prior-period figures into the new segment structure, under which the Platform (PF) business is segmented separately from FYE 03/27. LP Gas gross profit was 486 (+3 YoY, +1% YoY): residential gas sales volume grew on customer growth with margin flat YoY, C&I gas was -4 as margin shrunk affected by raw material price, and Equipment, etc. was +4 on increased sales of energy-saving gas appliances such as hybrid water heaters. LP Gas total customers reached 1,051 thousand (+21), including M&A of 3.2K customers across 34 companies, and the residential-plus-C&I margin was ¥158/kg versus ¥159/kg.
City Gas gross profit was 200 (+4 YoY, +2% YoY), with Gas +2 and Equipment, etc. +2, and total customers of 609 thousand (+19), which the company states was net customer growth turning positive for the first time since FYE 03/22. Electricity gross profit was 66 (+14 YoY, +27% YoY), with margin at ¥3.8/kWh versus ¥3.3/kWh, sales volume of 1,723 GWh (+136) and total customers of 404 thousand (+23). Platform gross profit was 16 (+2 YoY, +14% YoY), with approximately 60 companies using the Platform as at 31st Mar 2026.
| Segment | Metric | FYE 03/25 | FYE 03/26 | Change |
|---|---|---|---|---|
| LP Gas (incl. Equipment, etc.) | Gross Profit (¥100M) | 483 | 486 | +3 |
| City Gas (incl. Equipment, etc.) | Gross Profit (¥100M) | 196 | 200 | +4 |
| Electricity | Gross Profit (¥100M) | 52 | 66 | +14 |
| Platform (PF) | Gross Profit (¥100M) | 14 | 16 | +2 |
| LP Gas | # of total customers (‘000) | 1,030 | 1,051 | +21 |
| City Gas | # of total customers (‘000) | 590 | 609 | +19 |
| Electricity | # of total customers (‘000) | 381 | 404 | +23 |
| LP Gas | Sales volume (‘000t, Residential/C&I) | 178/109 | 181/106 | +3/(3) |
| City Gas | Sales volume (‘000t, Residential and C&I total) | 344 | 338 | — |
| Electricity | Sales volume (GWh) | 1,587 | 1,723 | +136 |
FYE 03/27 Forecast
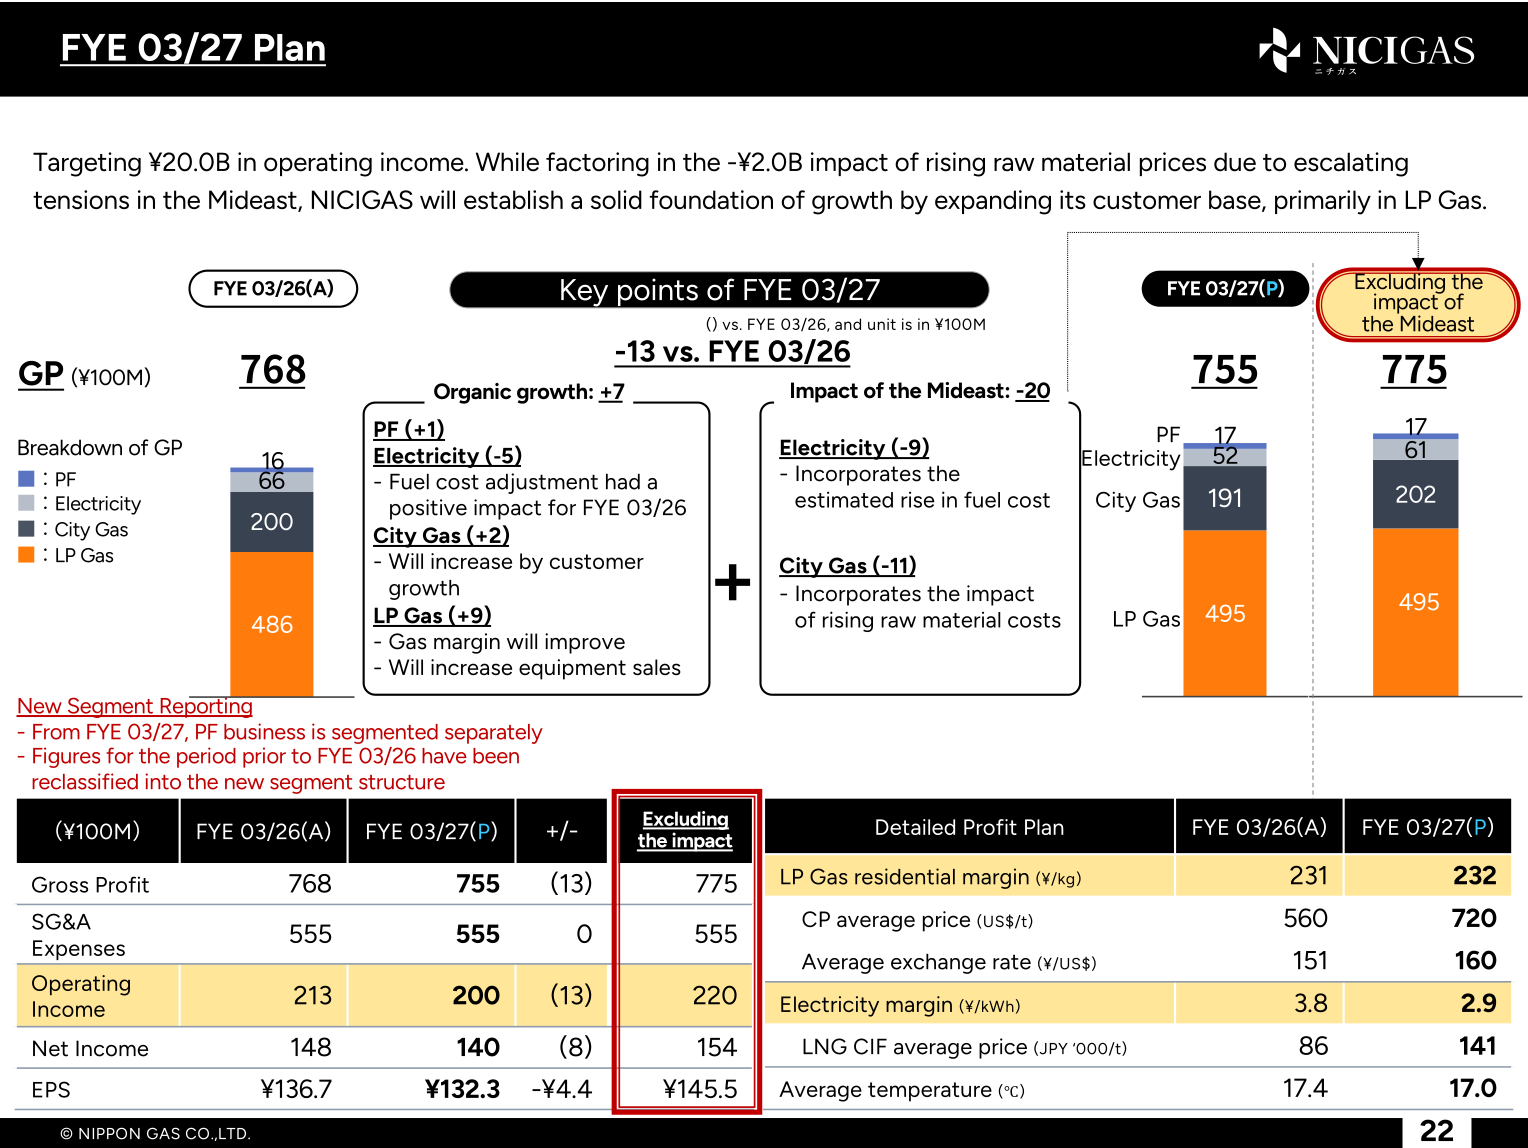
For FYE 03/27 NICIGAS plans gross profit of 755 (13) and operating income of 200 (13), with SG&A expenses flat at 555. Net income is planned at 140 (8) and EPS at ¥132.3 (-¥4.4). The company separately shows figures excluding the impact of the Mideast: gross profit 775, operating income 220, net income 154 and EPS ¥145.5. The -13 gross profit change versus FYE 03/26 is presented as organic growth of +7 combined with an impact of the Mideast of -20. By segment, the FYE 03/27 gross profit plan is LP Gas 495, City Gas 191, Electricity 52 and PF 17. Planning assumptions include an LP Gas residential margin of ¥232/kg, a CP average price of US$720/t, an average exchange rate of ¥160/US$, an electricity margin of ¥2.9/kWh, an LNG CIF average price of JPY 141 thousand/t and an average temperature of 17.0°C.
| Item (¥100M unless noted) | FYE 03/26 (A) | FYE 03/27 (P) | +/- | Excluding the impact |
|---|---|---|---|---|
| Gross Profit | 768 | 755 | (13) | 775 |
| SG&A Expenses | 555 | 555 | 0 | 555 |
| Operating Income | 213 | 200 | (13) | 220 |
| Net Income | 148 | 140 | (8) | 154 |
| EPS | ¥136.7 | ¥132.3 | -¥4.4 | ¥145.5 |
Shareholder Returns
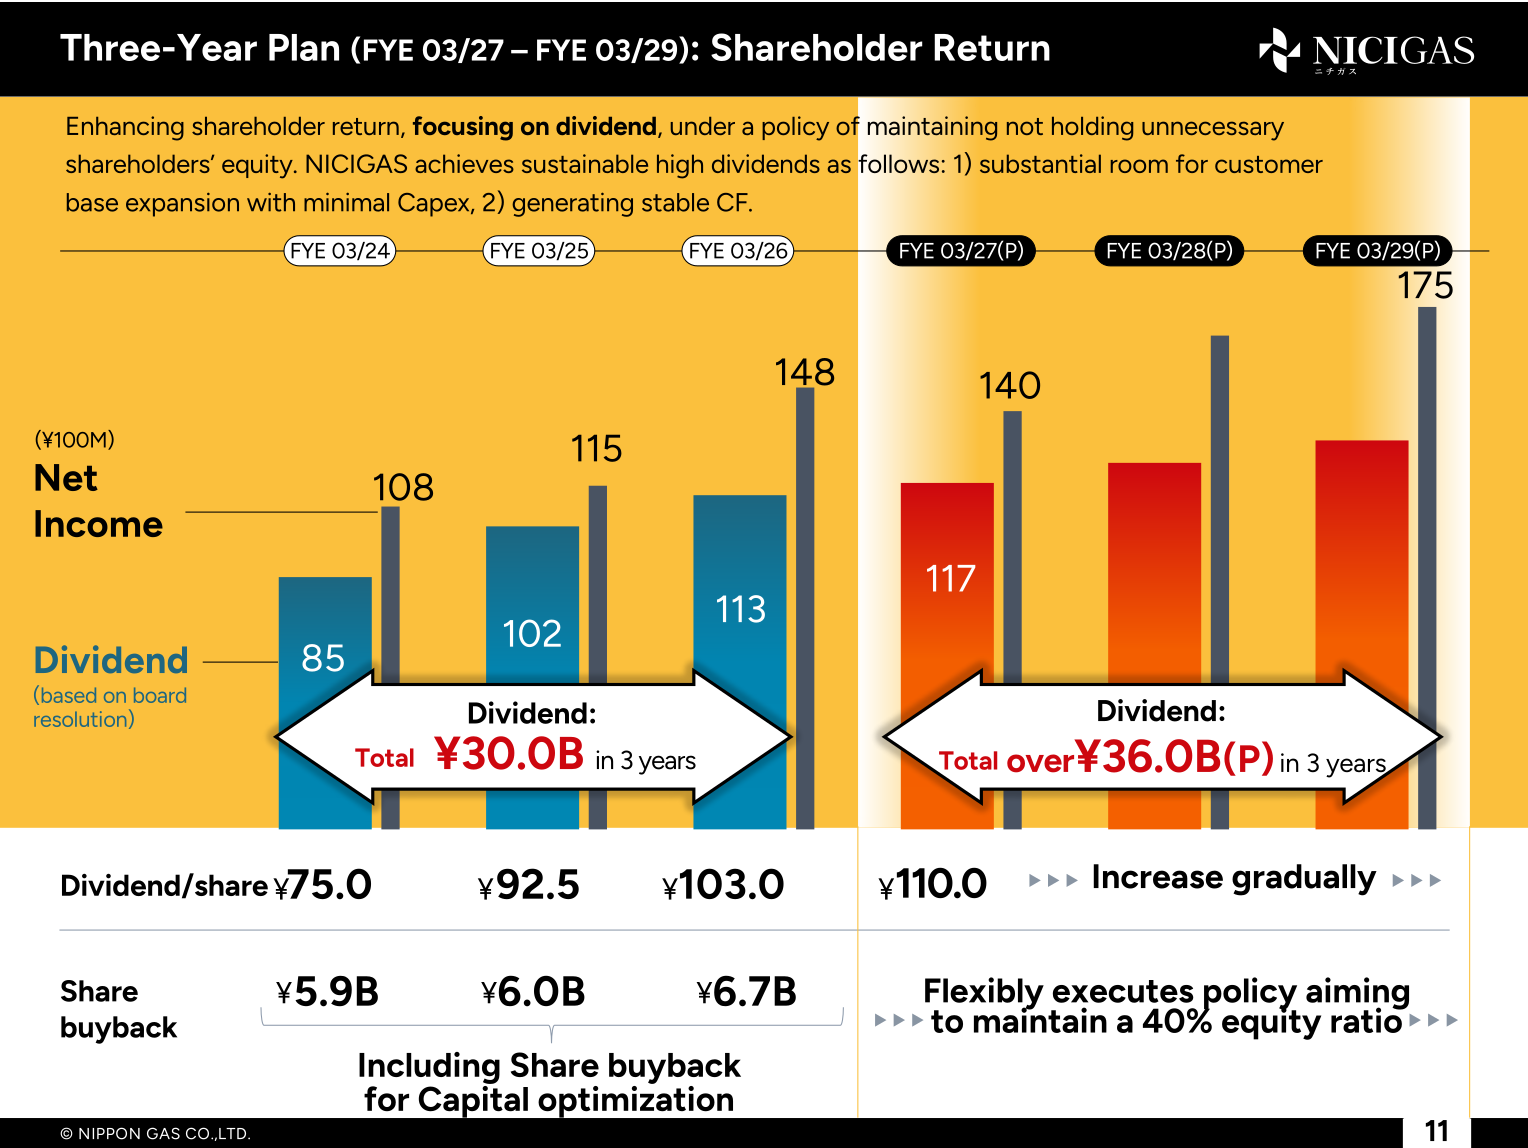
NICIGAS states it is enhancing shareholder return with a focus on dividends, under a policy of not holding unnecessary shareholders’ equity. Dividend per share was ¥103.0 in FYE 03/26, following ¥92.5 in FYE 03/25 and ¥75.0 in FYE 03/24, and the company plans ¥110.0 for FYE 03/27 and to increase it gradually thereafter. On a board-resolution basis the dividend amount was 113 (¥100M) in FYE 03/26 and is planned at 117 (¥100M) for FYE 03/27. Share buybacks were ¥5.9B, ¥6.0B and ¥6.7B in FYE 03/24, FYE 03/25 and FYE 03/26 respectively, including share buyback for capital optimization; from FYE 03/27 the company says it will execute buybacks flexibly under a policy aiming to maintain a 40% equity ratio. Cumulative dividends over FYE 03/24 to FYE 03/26 totalled ¥30.0B, and the company plans over ¥36.0B over FYE 03/27 to FYE 03/29.
| Item | FYE 03/24 | FYE 03/25 | FYE 03/26 | FYE 03/27 (P) |
|---|---|---|---|---|
| Dividend per share | ¥75.0 | ¥92.5 | ¥103.0 | ¥110.0 |
| Dividend, based on board resolution (¥100M) | 85 | 102 | 113 | 117 |
| Share buyback | ¥5.9B | ¥6.0B | ¥6.7B | Flexibly executes policy aiming to maintain a 40% equity ratio |
| Net Income (¥100M) | 108 | 115 | 148 | 140 |
Three-Year Plan (FYE 03/27 – FYE 03/29)
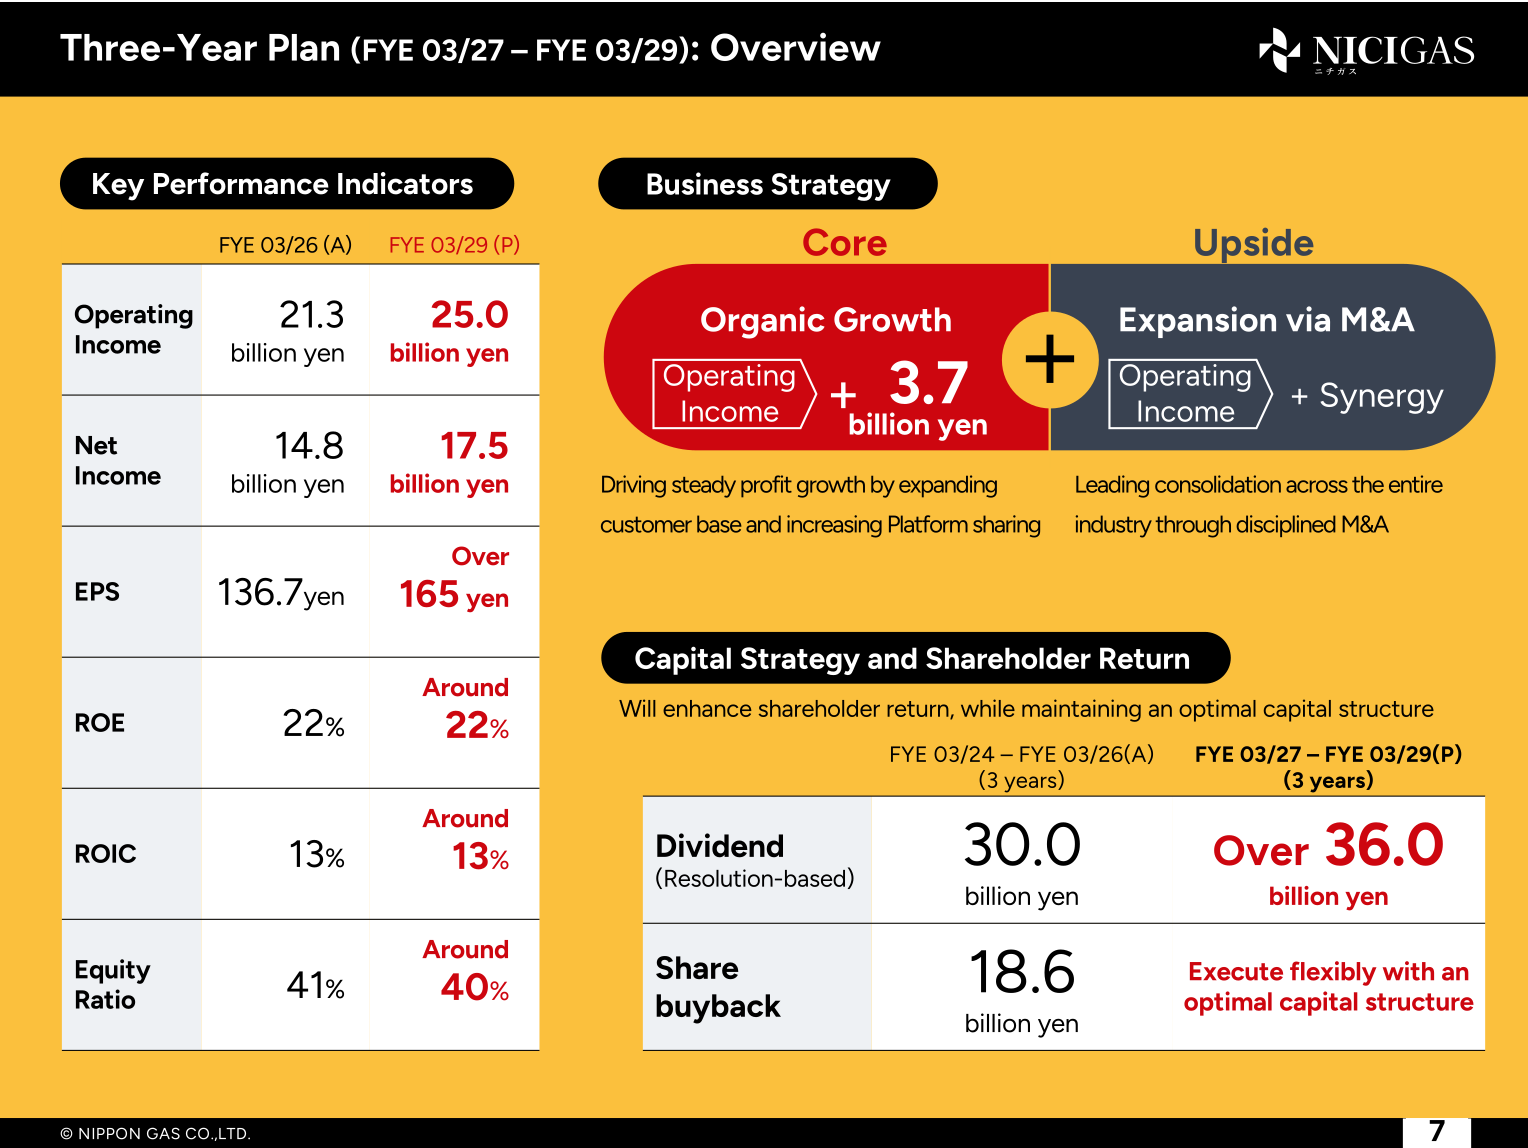
Alongside the results, NICIGAS disclosed a new Three-Year Plan covering FYE 03/27 to FYE 03/29. Against FYE 03/26 actuals of operating income 21.3 billion yen, net income 14.8 billion yen, EPS 136.7 yen, ROE 22%, ROIC 13% and an equity ratio of 41%, the FYE 03/29 plan targets operating income of 25.0 billion yen, net income of 17.5 billion yen, EPS of over 165 yen, ROE of around 22%, ROIC of around 13% and an equity ratio of around 40%. The company positions organic growth of +3.7 billion yen in operating income as the core of the plan, with expansion via M&A as upside. On the profit plan, gross profit is targeted at 820 (¥100M) in FYE 03/29 versus 768 in FYE 03/26, with SG&A expenses of 570 and operating income of 250. For cash allocation over the three years, the company shows CF from operating activities of ¥78.0B, renewal investments of ¥15.0B, growth investments, and dividends of over ¥36.0B.
This article is an analysis based on publicly available information and is not a recommendation to buy or sell any specific securities. Investment decisions are your own responsibility.
![[Obayashi] Investors’ Guide 2026 — The Complete 24-Article Breakdown](https://japan-equity.com/wp-content/uploads/2026/07/hub_cover-1024x1024.png)
![[Obayashi] IR & SR Policy — Feeding Dialogue Back into Management](https://japan-equity.com/wp-content/uploads/2026/07/p32_sq-1024x1024.jpg)
![[Obayashi] Real Estate Development — 18.7% Margin, ¥287.7bn Unrealized Gains](https://japan-equity.com/wp-content/uploads/2026/07/p20_sq-1024x1024.jpg)
![[Obayashi] Domestic Civil Engineering — Resilience Spending Supports 9.6% Margin](https://japan-equity.com/wp-content/uploads/2026/07/p11_sq-1024x1024.jpg)
![[Obayashi] Share Price & External Ratings — vs TOPIX, ESG Index Inclusion](https://japan-equity.com/wp-content/uploads/2026/07/p40_sq-1024x1024.jpg)
![[Construction] ¥75.5tn Investment, Shrinking Workforce — Big-5 Market Share](https://japan-equity.com/wp-content/uploads/2026/07/p12_sq-1024x1024.jpg)



![[Obayashi] Capital Policy & Shareholder Returns — ROE 10%+, DOE ~5%, ¥100bn Buyback](https://japan-equity.com/wp-content/uploads/2026/07/p27_sq-1024x1024.jpg)
![[Obayashi] Reducing Cross-Shareholdings — ¥285.2bn Sold in Five Years](https://japan-equity.com/wp-content/uploads/2026/07/p29_sq-1024x1024.jpg)
![[Obayashi] ¥750bn Investment Plan — ¥300bn to Development, ¥190bn to Tech/DX](https://japan-equity.com/wp-content/uploads/2026/07/p30_sq-1024x1024.jpg)
![[Obayashi] MTP2022 KPIs — Operating Profit ~2x Target, ROE 14.4%](https://japan-equity.com/wp-content/uploads/2026/07/p25_sq-1024x1024.jpg)
![[Obayashi] Cash Allocation — ¥420bn Investment CF Over Five Years](https://japan-equity.com/wp-content/uploads/2026/07/p26_sq-1024x1024.jpg)
![[Obayashi] Green Energy — 44 Plants, 344MW, and the Green Hydrogen Challenge](https://japan-equity.com/wp-content/uploads/2026/07/p21_sq-1024x1024.jpg)
![[Obayashi] Tackling the Labor Shortage — Robotics Construction®](https://japan-equity.com/wp-content/uploads/2026/07/p14_sq-1024x1024.jpg)
