
This article is based on publicly available IR materials and is not a recommendation to buy or sell any specific securities.
Note: Zensho Holdings does not publish an English results presentation; this article is an English translation of the Japanese-language article on our sister site Investalk, which is based on the company’s Japanese-language IR materials, with figures transcribed as reported. This site classifies the most recent completed fiscal year as FY2025, while the company’s materials label the period as the fiscal year ended March 2026 (FY3/2026). On May 12, 2026, Zensho Holdings announced its full-year results for the fiscal year ended March 2026 (FY3/2026). Consolidated net sales were 1.2640 trillion yen (+11.2% year on year), operating profit was 81.4 billion yen (+8.4%), and net income was 45.8 billion yen (+16.6%), for growth in both sales and profit. Operating cash flow expanded to 101.1 billion yen (+28.1% year on year), and the annual dividend was raised from 70.00 yen in the previous year to 75.00 yen. For FY3/2027 the company expects net sales of 1.4240 trillion yen and operating profit of 92.0 billion yen, forecasting further growth in both sales and profit.
Consolidated Results (FY3/2026 Actual)
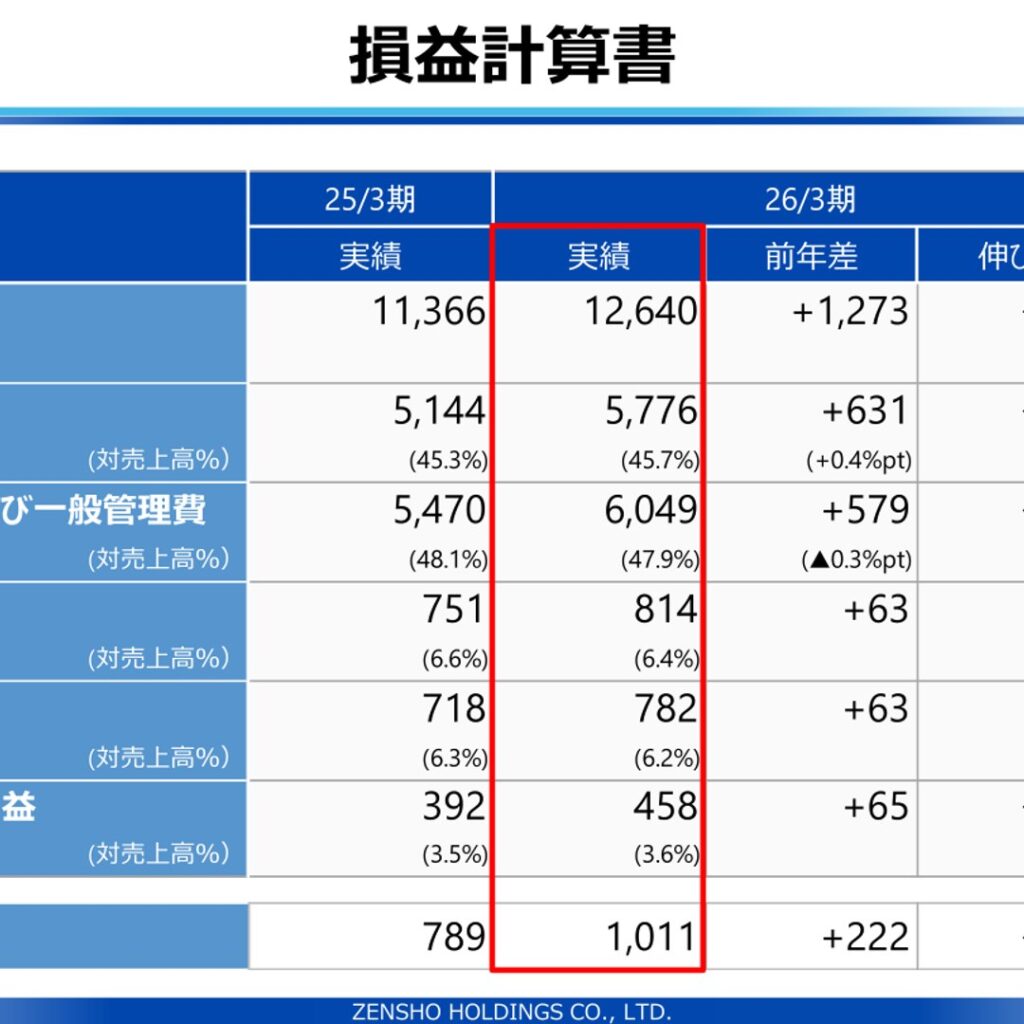
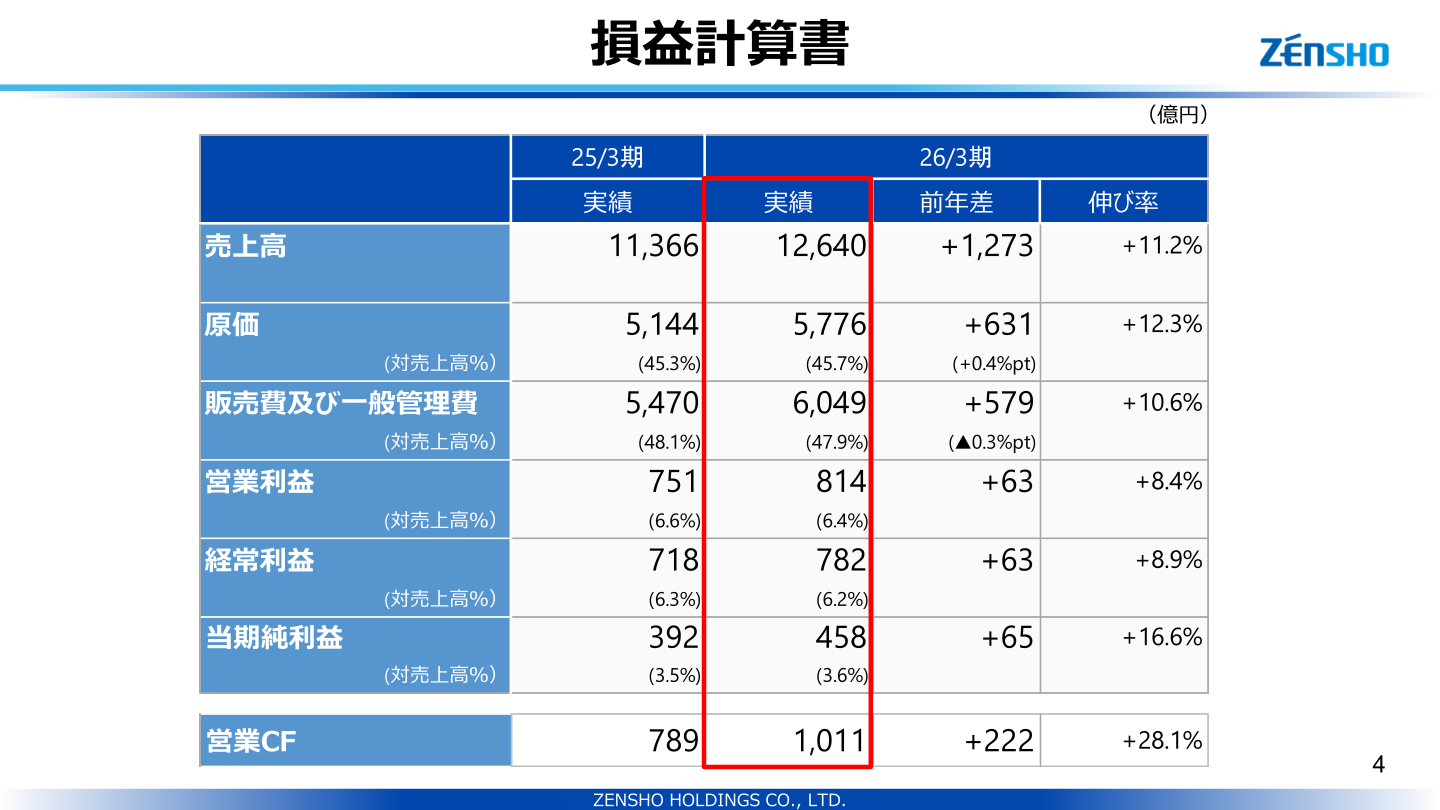
For FY3/2026, consolidated net sales rose 127.3 billion yen (+11.2%) year on year to 1.2640 trillion yen. The cost of sales ratio was 45.7% (45.3% in the previous year, +0.4%pt) and the SG&A expense ratio was 47.9% (48.1% in the previous year, -0.3%pt). Operating profit was 81.4 billion yen (+8.4% year on year), ordinary profit was 78.2 billion yen (+8.9%), and net income was 45.8 billion yen (+16.6%), with every profit line higher.
| Item | FY3/2026 Actual (¥ hundred million) | FY3/2025 Actual (¥ hundred million) | YoY change (¥ hundred million; growth rate) |
|---|---|---|---|
| Net sales | 12,640 | 11,366 | +1,273 (+11.2%) |
| Cost of sales | 5,776 | 5,144 | +631 (+12.3%) |
| Selling, general and administrative expenses | 6,049 | 5,470 | +579 (+10.6%) |
| Operating profit | 814 | 751 | +63 (+8.4%) |
| Ordinary profit | 782 | 718 | +63 (+8.9%) |
| Net income | 458 | 392 | +65 (+16.6%) |
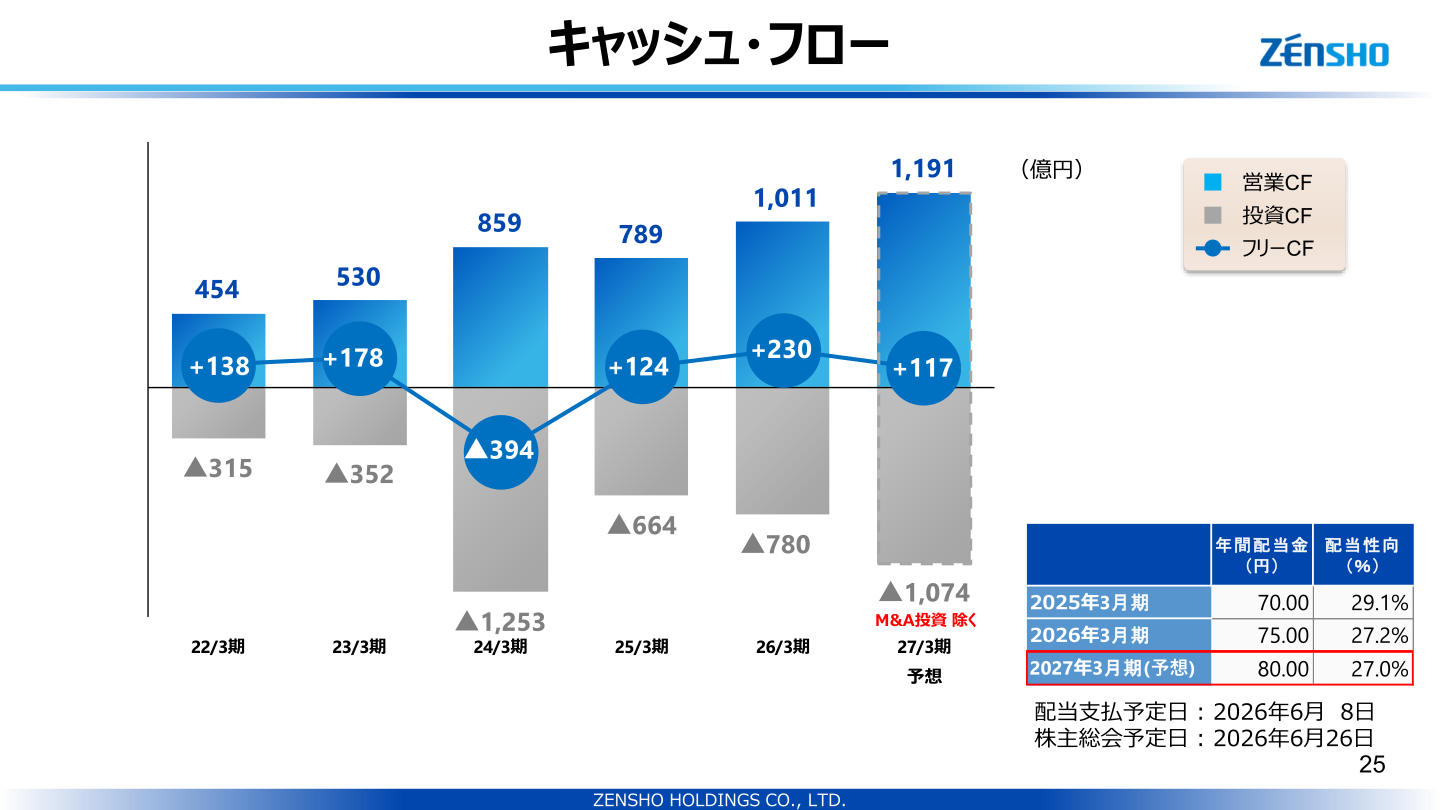
| Operating cash flow | 1,011 | 789 | +222 (+28.1%) |
Segment (Business) Results
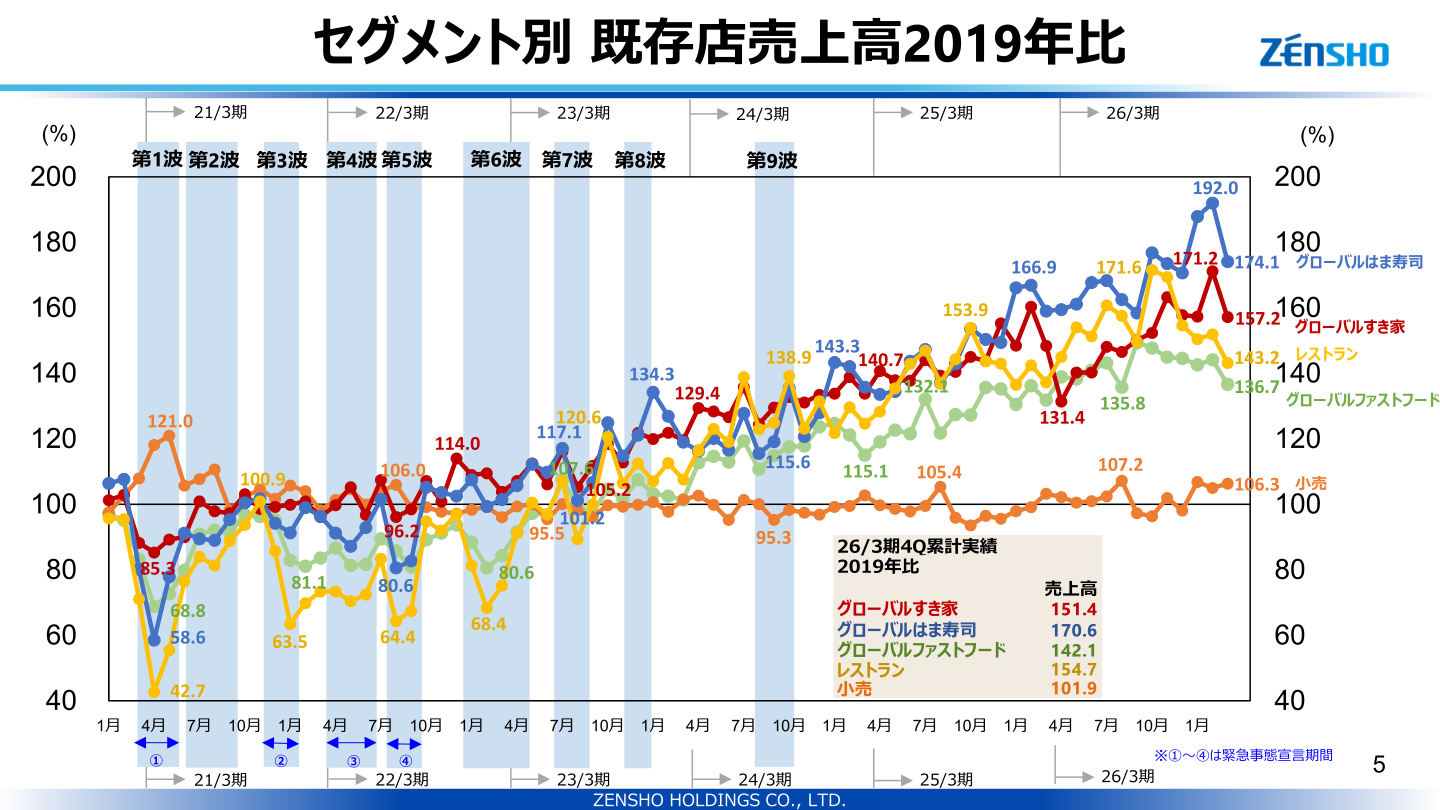
The materials disclose changes in net sales and operating profit by business, under a segment-by-segment analysis of year-on-year differences, covering Global Sukiya, Global Hamazushi, Restaurants, Global Fast Food, Retail and Global Ready-to-Eat. Same-store sales (versus 2019, cumulative fourth-quarter results for FY3/2026) were highest at Global Hamazushi with 170.6, followed by Restaurants at 154.7, Global Sukiya at 151.4, Global Fast Food at 142.1 and Retail at 101.9.
| Segment | Same-store sales vs. 2019 (FY3/2026 Q4 cumulative actual) |
|---|---|
| Global Sukiya | 151.4 |
| Global Hamazushi | 170.6 |
| Global Fast Food | 142.1 |
| Restaurants | 154.7 |
| Retail | 101.9 |
Full-Year Forecast (FY3/2027)
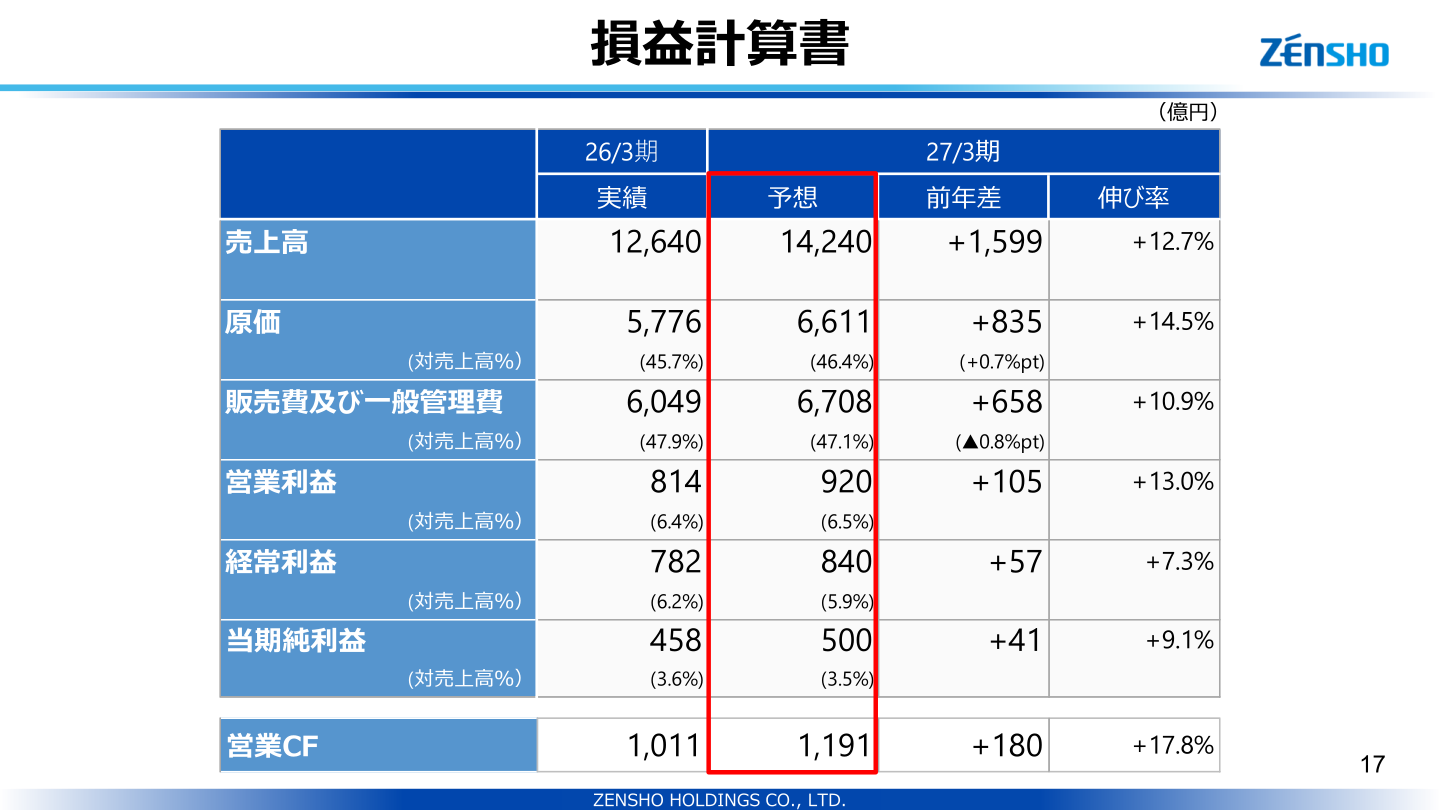
For FY3/2027 the company expects consolidated net sales of 1.4240 trillion yen (+12.7% versus the FY3/2026 actual), operating profit of 92.0 billion yen (+13.0%), ordinary profit of 84.0 billion yen (+7.3%) and net income of 50.0 billion yen (+9.1%). Operating cash flow is forecast at 119.1 billion yen (+17.8%).
| Item | FY3/2027 Forecast (¥ hundred million) | FY3/2026 Actual (¥ hundred million) | YoY change (¥ hundred million; growth rate) |
|---|---|---|---|
| Net sales | 14,240 | 12,640 | +1,599 (+12.7%) |
| Cost of sales | 6,611 | 5,776 | +835 (+14.5%) |
| Selling, general and administrative expenses | 6,708 | 6,049 | +658 (+10.9%) |
| Operating profit | 920 | 814 | +105 (+13.0%) |
| Ordinary profit | 840 | 782 | +57 (+7.3%) |
| Net income | 500 | 458 | +41 (+9.1%) |
| Operating cash flow | 1,191 | 1,011 | +180 (+17.8%) |
Capital Expenditure and Store Openings
In FY3/2026 the group opened 1,042 stores on a consolidated basis (101 in Japan and 941 overseas), taking the store count at period-end to 14,947. Capital expenditure (on a cash flow basis) was 78.0 billion yen, against 61.5 billion yen in the previous year, and depreciation was 53.3 billion yen. For FY3/2027 the company plans 1,319 store openings (145 in Japan and 1,174 overseas), and expects capital expenditure of 92.0 billion yen and depreciation of 61.6 billion yen.
Shareholder Returns
The annual dividend was raised from 70.00 yen for the fiscal year ended March 2025 to 75.00 yen for the fiscal year ended March 2026 (payout ratio 27.2%). For FY3/2027 the company plans 80.00 yen, with a forecast payout ratio of 27.0%. The scheduled dividend payment date is June 8, 2026, and the general meeting of shareholders is scheduled for June 26, 2026.
| Fiscal year | Annual dividend per share (yen) | Payout ratio (%) |
|---|---|---|
| Fiscal year ended March 2025 | 70.00 | 29.1 |
| Fiscal year ended March 2026 | 75.00 | 27.2 |
| Fiscal year ending March 2027 (forecast) | 80.00 | 27.0 |
This article is an analysis based on publicly available information and is not a recommendation to buy or sell any specific securities. Investment decisions are your own responsibility.
![[Obayashi] Investors’ Guide 2026 — The Complete 24-Article Breakdown](https://japan-equity.com/wp-content/uploads/2026/07/hub_cover-1024x1024.png)
![[Obayashi] IR & SR Policy — Feeding Dialogue Back into Management](https://japan-equity.com/wp-content/uploads/2026/07/p32_sq-1024x1024.jpg)
![[Obayashi] Real Estate Development — 18.7% Margin, ¥287.7bn Unrealized Gains](https://japan-equity.com/wp-content/uploads/2026/07/p20_sq-1024x1024.jpg)
![[Obayashi] Domestic Civil Engineering — Resilience Spending Supports 9.6% Margin](https://japan-equity.com/wp-content/uploads/2026/07/p11_sq-1024x1024.jpg)
![[Obayashi] Share Price & External Ratings — vs TOPIX, ESG Index Inclusion](https://japan-equity.com/wp-content/uploads/2026/07/p40_sq-1024x1024.jpg)
![[Construction] ¥75.5tn Investment, Shrinking Workforce — Big-5 Market Share](https://japan-equity.com/wp-content/uploads/2026/07/p12_sq-1024x1024.jpg)



![[Obayashi] Capital Policy & Shareholder Returns — ROE 10%+, DOE ~5%, ¥100bn Buyback](https://japan-equity.com/wp-content/uploads/2026/07/p27_sq-1024x1024.jpg)
![[Obayashi] Reducing Cross-Shareholdings — ¥285.2bn Sold in Five Years](https://japan-equity.com/wp-content/uploads/2026/07/p29_sq-1024x1024.jpg)
![[Obayashi] ¥750bn Investment Plan — ¥300bn to Development, ¥190bn to Tech/DX](https://japan-equity.com/wp-content/uploads/2026/07/p30_sq-1024x1024.jpg)
![[Obayashi] MTP2022 KPIs — Operating Profit ~2x Target, ROE 14.4%](https://japan-equity.com/wp-content/uploads/2026/07/p25_sq-1024x1024.jpg)
![[Obayashi] Cash Allocation — ¥420bn Investment CF Over Five Years](https://japan-equity.com/wp-content/uploads/2026/07/p26_sq-1024x1024.jpg)
![[Obayashi] Green Energy — 44 Plants, 344MW, and the Green Hydrogen Challenge](https://japan-equity.com/wp-content/uploads/2026/07/p21_sq-1024x1024.jpg)
![[Obayashi] Tackling the Labor Shortage — Robotics Construction®](https://japan-equity.com/wp-content/uploads/2026/07/p14_sq-1024x1024.jpg)
