
This article is based on publicly available IR materials and is not a recommendation to buy or sell any specific securities.
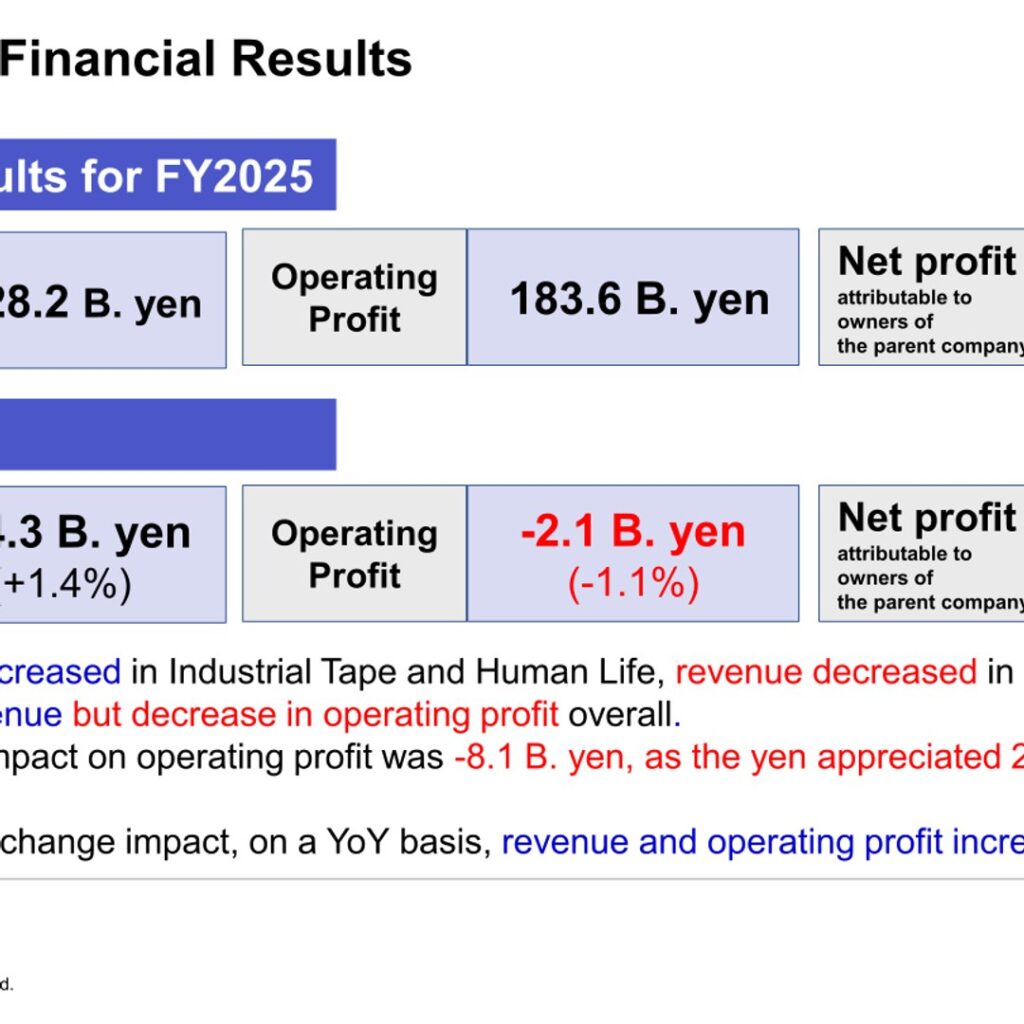
Nitto Denko Corporation posted FY2025 (Apr.-Mar.) revenue of 1,028.2 billion yen, an increase of 14.3 billion yen or 1.4% year on year, while operating profit fell 2.1 billion yen (-1.1%) to 183.6 billion yen and net profit attributable to owners of the parent company declined 3.7 billion yen (-2.7%) to 133.5 billion yen. Revenue increased in Industrial Tape and Human Life but decreased in Optronics, resulting in a year-on-year increase in revenue but a decrease in operating profit overall. The foreign exchange impact on operating profit was -8.1 billion yen as the yen appreciated 2.7 yen against the U.S. dollar; excluding the foreign exchange impact, both revenue and operating profit increased year on year. For FY2026 the company forecasts revenue of 1,065.0 billion yen and operating profit of 193.0 billion yen.
Consolidated Results (Full-Year Actual)
The presentation, dated April 27, 2026, labels the fiscal year just completed as FY2025 (Apr.-Mar.). Operating profit to revenue slipped to 17.9% from 18.3%, and ROE was 12.2% against 13.5% a year earlier. The average exchange rate was 150.2 yen to the U.S. dollar, versus 152.9 yen in FY2024. Amounts and rates in the presentation are rounded off to the nearest whole unit.
| Item (Billion yen) | FY2024 (Apr.-Mar.) | FY2025 (Apr.-Mar.) | YoY Dif. | YoY % |
|---|---|---|---|---|
| Revenue | 1,013.9 | 1,028.2 | 14.3 | +1.4% |
| Operating profit | 185.7 | 183.6 | -2.1 | -1.1% |
| Operating profit to revenue | 18.3% | 17.9% | – | -0.5% |
| Profit before income taxes | 185.3 | 185.0 | -0.4 | -0.2% |
| Net profit attributable to owners of the parent company | 137.2 | 133.5 | -3.7 | -2.7% |
| ROE | 13.5% | 12.2% | – | -1.3% |
| Yen/1US$ | 152.9 | 150.2 | -2.7 | -1.8% |
In the company’s year-on-year operating profit change analysis (figures shown as estimates), the main movements from FY2024’s 185.7 billion yen to FY2025’s 183.6 billion yen were sales volume variance of +16.5 billion yen, fixed costs of -16.0 billion yen, royalty income of +4.0 billion yen, product mix and other items of +4.0 billion yen, special factors of -2.5 billion yen and the impact of foreign exchange of -8.1 billion yen. Special factors comprised a reactionary gain of +9.0 billion yen in FY2024 from impairment losses on goodwill at subsidiaries (flexible sensors and Personal Care Materials) and on fixed assets from plastic optical fiber cables, and -5.0 billion yen in FY2025 for costs associated with the consolidation and reorganization of manufacturing sites, gain on sale of land and real estate, and impairment losses and disposal of fixed assets.
Segment Results
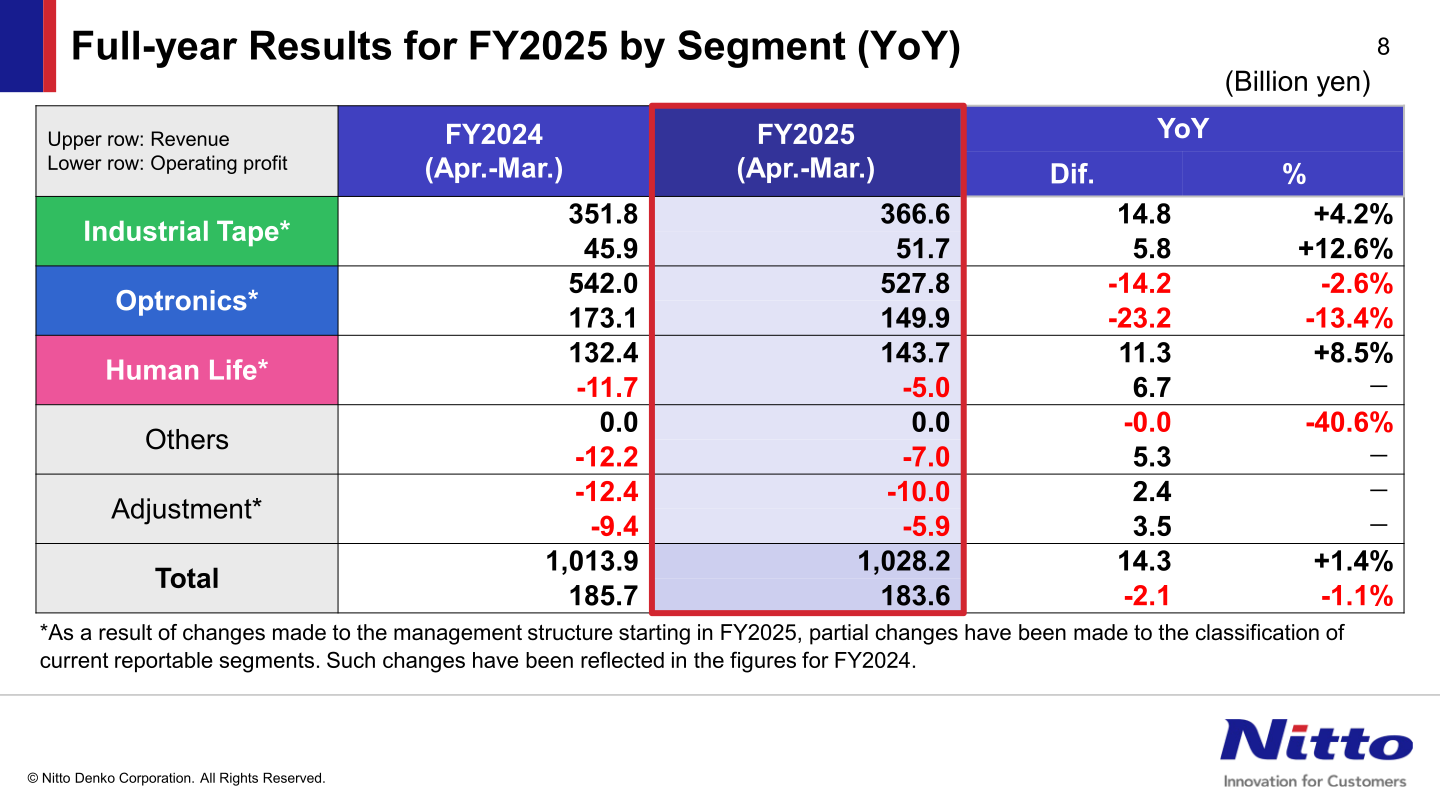
Industrial Tape revenue rose 4.2% to 366.6 billion yen and operating profit rose 12.6% to 51.7 billion yen, as demand increased for assembly materials used in high-end smartphones on the expansion of models adopting battery bonding electrical release tape, for process materials used in ceramic capacitors, and for process materials used in semiconductor memories; revenue for automotive materials decreased on the decline in automotive unit production by Japanese manufacturers in China, and costs associated with the consolidation and reorganization of manufacturing sites were recorded. Optronics revenue fell 2.6% to 527.8 billion yen and operating profit fell 13.4% to 149.9 billion yen: within the segment, Information Fine Materials revenue was 386.2 billion yen against 407.7 billion yen a year earlier, while Circuit Materials revenue rose to 141.6 billion yen from 134.3 billion yen. Human Life revenue rose 8.5% to 143.7 billion yen and the operating loss narrowed to -5.0 billion yen from -11.7 billion yen, with Life Science at 54.0 billion yen, Membrane at 33.4 billion yen and Personal Care Materials at 56.3 billion yen.
| Segment (Billion yen) | Metric | FY2024 (Apr.-Mar.) | FY2025 (Apr.-Mar.) | YoY % |
|---|---|---|---|---|
| Industrial Tape | Revenue | 351.8 | 366.6 | +4.2% |
| Industrial Tape | Operating profit | 45.9 | 51.7 | +12.6% |
| Optronics | Revenue | 542.0 | 527.8 | -2.6% |
| Optronics | Operating profit | 173.1 | 149.9 | -13.4% |
| Human Life | Revenue | 132.4 | 143.7 | +8.5% |
| Human Life | Operating profit | -11.7 | -5.0 | – |
| Others | Revenue | 0.0 | 0.0 | -40.6% |
| Others | Operating profit | -12.2 | -7.0 | – |
| Adjustment | Revenue | -12.4 | -10.0 | – |
| Adjustment | Operating profit | -9.4 | -5.9 | – |
| Total | Revenue | 1,013.9 | 1,028.2 | +1.4% |
| Total | Operating profit | 185.7 | 183.6 | -1.1% |
As a result of changes made to the management structure starting in FY2025, partial changes have been made to the classification of the current reportable segments, and such changes have been reflected in the figures for FY2024. On a revenue composition basis (excluding Adjustment), FY2025 was 35% Industrial Tape, 51% Optronics and 14% Human Life, against 34% / 53% / 13% in FY2024.
FY2026 Forecast
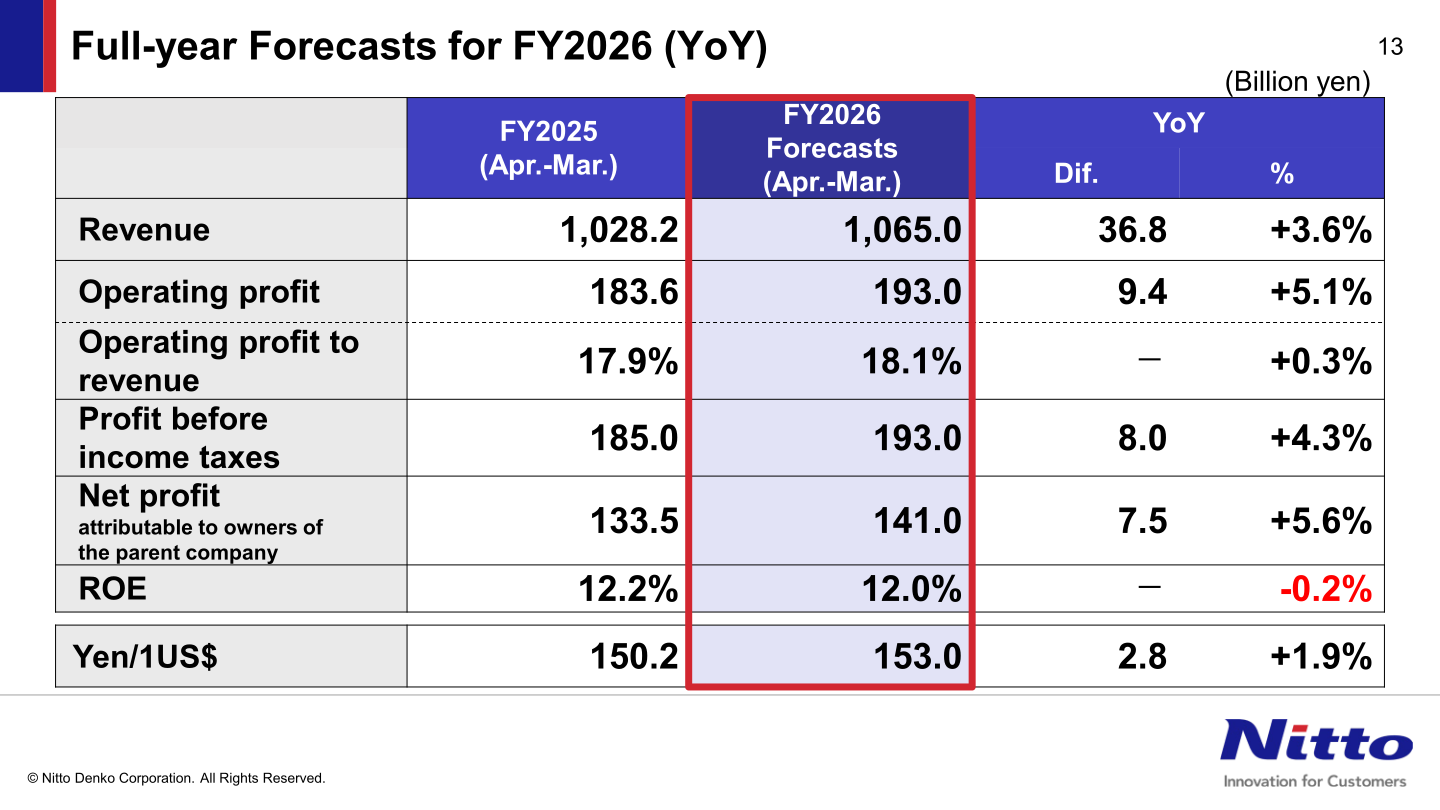
For FY2026 (Apr.-Mar.), Nitto Denko forecasts revenue of 1,065.0 billion yen (+36.8 billion yen, +3.6%), operating profit of 193.0 billion yen (+9.4 billion yen, +5.1%), profit before income taxes of 193.0 billion yen and net profit attributable to owners of the parent company of 141.0 billion yen (+7.5 billion yen, +5.6%). The operating profit margin is expected to improve to 18.1%, ROE is projected at 12.0%, and the assumed exchange rate is 153.0 yen to the U.S. dollar.
| Item (Billion yen) | FY2025 (Actual) | FY2026 Forecasts | YoY Dif. | YoY % |
|---|---|---|---|---|
| Revenue | 1,028.2 | 1,065.0 | 36.8 | +3.6% |
| Operating profit | 183.6 | 193.0 | 9.4 | +5.1% |
| Operating profit to revenue | 17.9% | 18.1% | – | +0.3% |
| Profit before income taxes | 185.0 | 193.0 | 8.0 | +4.3% |
| Net profit attributable to owners of the parent company | 133.5 | 141.0 | 7.5 | +5.6% |
| ROE | 12.2% | 12.0% | – | -0.2% |
| Yen/1US$ | 150.2 | 153.0 | 2.8 | +1.9% |
By segment, the FY2026 forecast calls for Industrial Tape revenue of 380.4 billion yen (+3.8%) with operating profit of 59.1 billion yen (+14.4%), Optronics revenue of 539.9 billion yen (+2.3%) with operating profit of 149.7 billion yen (-0.1%), and Human Life revenue of 153.6 billion yen (+6.9%) with an operating loss of -1.4 billion yen, narrowing from -5.0 billion yen.
Shareholder Returns
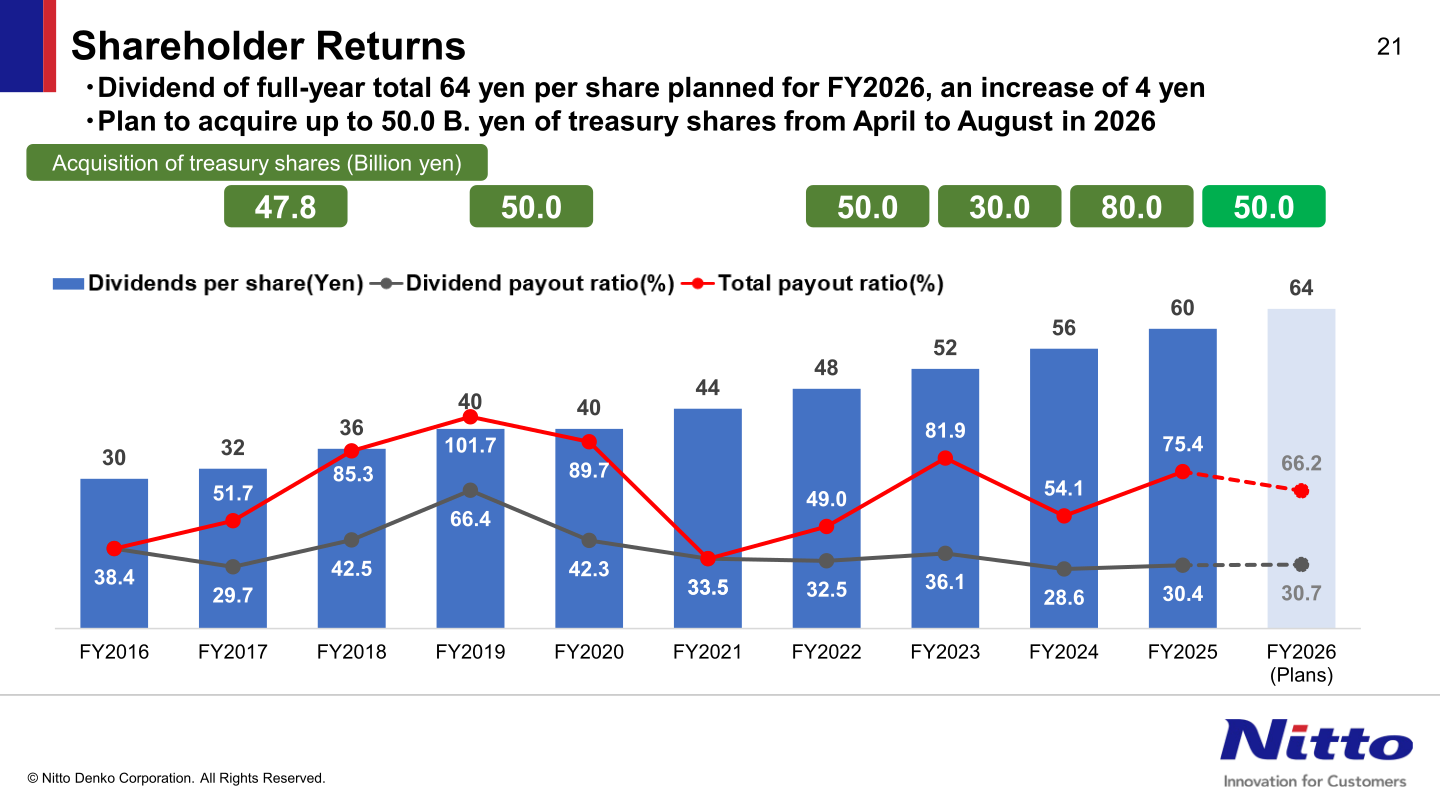
The company plans a full-year total dividend of 64 yen per share for FY2026, an increase of 4 yen, following 60 yen per share for FY2025. It also plans to acquire up to 50.0 billion yen of treasury shares from April to August in 2026.
| Item | FY2025 | FY2026 (Plans) |
|---|---|---|
| Dividend per share, full-year total | 60 yen | 64 yen |
| Acquisition of treasury shares | – | Up to 50.0 billion yen (April to August 2026) |
Cash Flow and Investment
Cash flows from operating activities were 192.2 billion yen against 217.9 billion yen in FY2024, and cash flows from investing activities were -107.4 billion yen against -115.1 billion yen, leaving free cash flow of 84.7 billion yen versus 102.8 billion yen. Cash flows from financing activities were -106.6 billion yen, and cash and cash equivalents at the end of the period stood at 359.8 billion yen. Capital expenditure was 86.8 billion yen in FY2025 against 93.0 billion yen in FY2024 and is forecast at 120.0 billion yen for FY2026; depreciation and amortization was 70.7 billion yen versus 65.6 billion yen with a FY2026 forecast of 79.0 billion yen; R&D expenditure was 48.0 billion yen versus 46.8 billion yen with a FY2026 forecast of 50.0 billion yen.
This article is an analysis based on publicly available information and is not a recommendation to buy or sell any specific securities. Investment decisions are your own responsibility.
![[Obayashi] Investors’ Guide 2026 — The Complete 24-Article Breakdown](https://japan-equity.com/wp-content/uploads/2026/07/hub_cover-1024x1024.png)
![[Obayashi] IR & SR Policy — Feeding Dialogue Back into Management](https://japan-equity.com/wp-content/uploads/2026/07/p32_sq-1024x1024.jpg)
![[Obayashi] Real Estate Development — 18.7% Margin, ¥287.7bn Unrealized Gains](https://japan-equity.com/wp-content/uploads/2026/07/p20_sq-1024x1024.jpg)
![[Obayashi] Domestic Civil Engineering — Resilience Spending Supports 9.6% Margin](https://japan-equity.com/wp-content/uploads/2026/07/p11_sq-1024x1024.jpg)
![[Obayashi] Share Price & External Ratings — vs TOPIX, ESG Index Inclusion](https://japan-equity.com/wp-content/uploads/2026/07/p40_sq-1024x1024.jpg)
![[Construction] ¥75.5tn Investment, Shrinking Workforce — Big-5 Market Share](https://japan-equity.com/wp-content/uploads/2026/07/p12_sq-1024x1024.jpg)



![[Obayashi] Capital Policy & Shareholder Returns — ROE 10%+, DOE ~5%, ¥100bn Buyback](https://japan-equity.com/wp-content/uploads/2026/07/p27_sq-1024x1024.jpg)
![[Obayashi] Reducing Cross-Shareholdings — ¥285.2bn Sold in Five Years](https://japan-equity.com/wp-content/uploads/2026/07/p29_sq-1024x1024.jpg)
![[Obayashi] ¥750bn Investment Plan — ¥300bn to Development, ¥190bn to Tech/DX](https://japan-equity.com/wp-content/uploads/2026/07/p30_sq-1024x1024.jpg)
![[Obayashi] MTP2022 KPIs — Operating Profit ~2x Target, ROE 14.4%](https://japan-equity.com/wp-content/uploads/2026/07/p25_sq-1024x1024.jpg)
![[Obayashi] Cash Allocation — ¥420bn Investment CF Over Five Years](https://japan-equity.com/wp-content/uploads/2026/07/p26_sq-1024x1024.jpg)
![[Obayashi] Green Energy — 44 Plants, 344MW, and the Green Hydrogen Challenge](https://japan-equity.com/wp-content/uploads/2026/07/p21_sq-1024x1024.jpg)
![[Obayashi] Tackling the Labor Shortage — Robotics Construction®](https://japan-equity.com/wp-content/uploads/2026/07/p14_sq-1024x1024.jpg)
