
This article is based on publicly available IR materials and is not a recommendation to buy or sell any specific securities.
For FY2025 (April 2025 to March 2026), Hirose Electric reported consolidated sales of 2,112.6 hundred million yen, up 11.5% year on year, operating profit of 429.9 hundred million yen, up 0.8%, and net profit of 331.4 hundred million yen, up 0.3%. The company notes that while it initially projected a decrease in profit, both revenue and profit increased year on year; the operating profit ratio was 20.4%, down 2.1pt. Cumulative orders totaled 224.98 billion yen, up 16.8% YoY. For FY2026 (FY ending March 31, 2027), the company forecasts sales of 2,300 hundred million yen (+8.9%), operating profit of 460.0 hundred million yen (+7.0%) and net profit of 340.0 hundred million yen (+2.6%), with a dividend per share of 520 yen against 505 yen for FY2025.
Consolidated Results (Full-Year Actual)
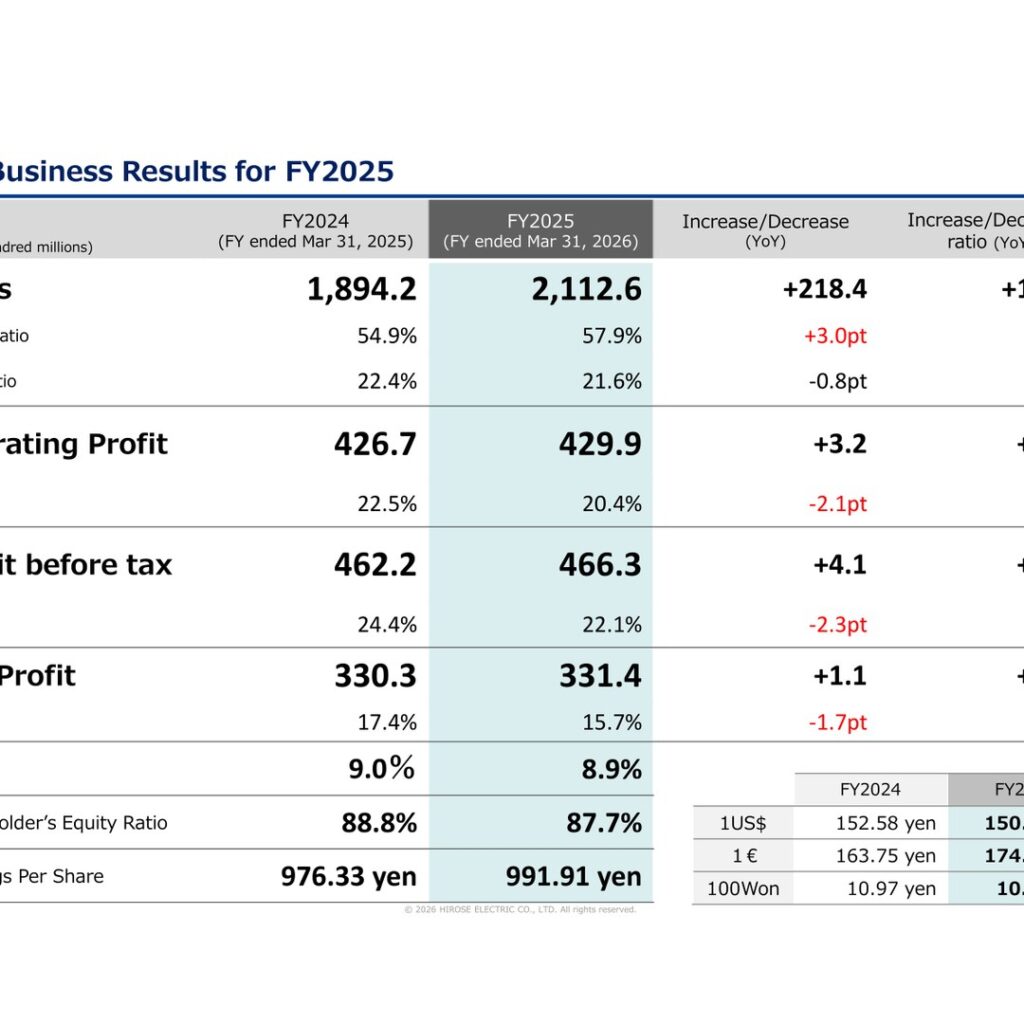
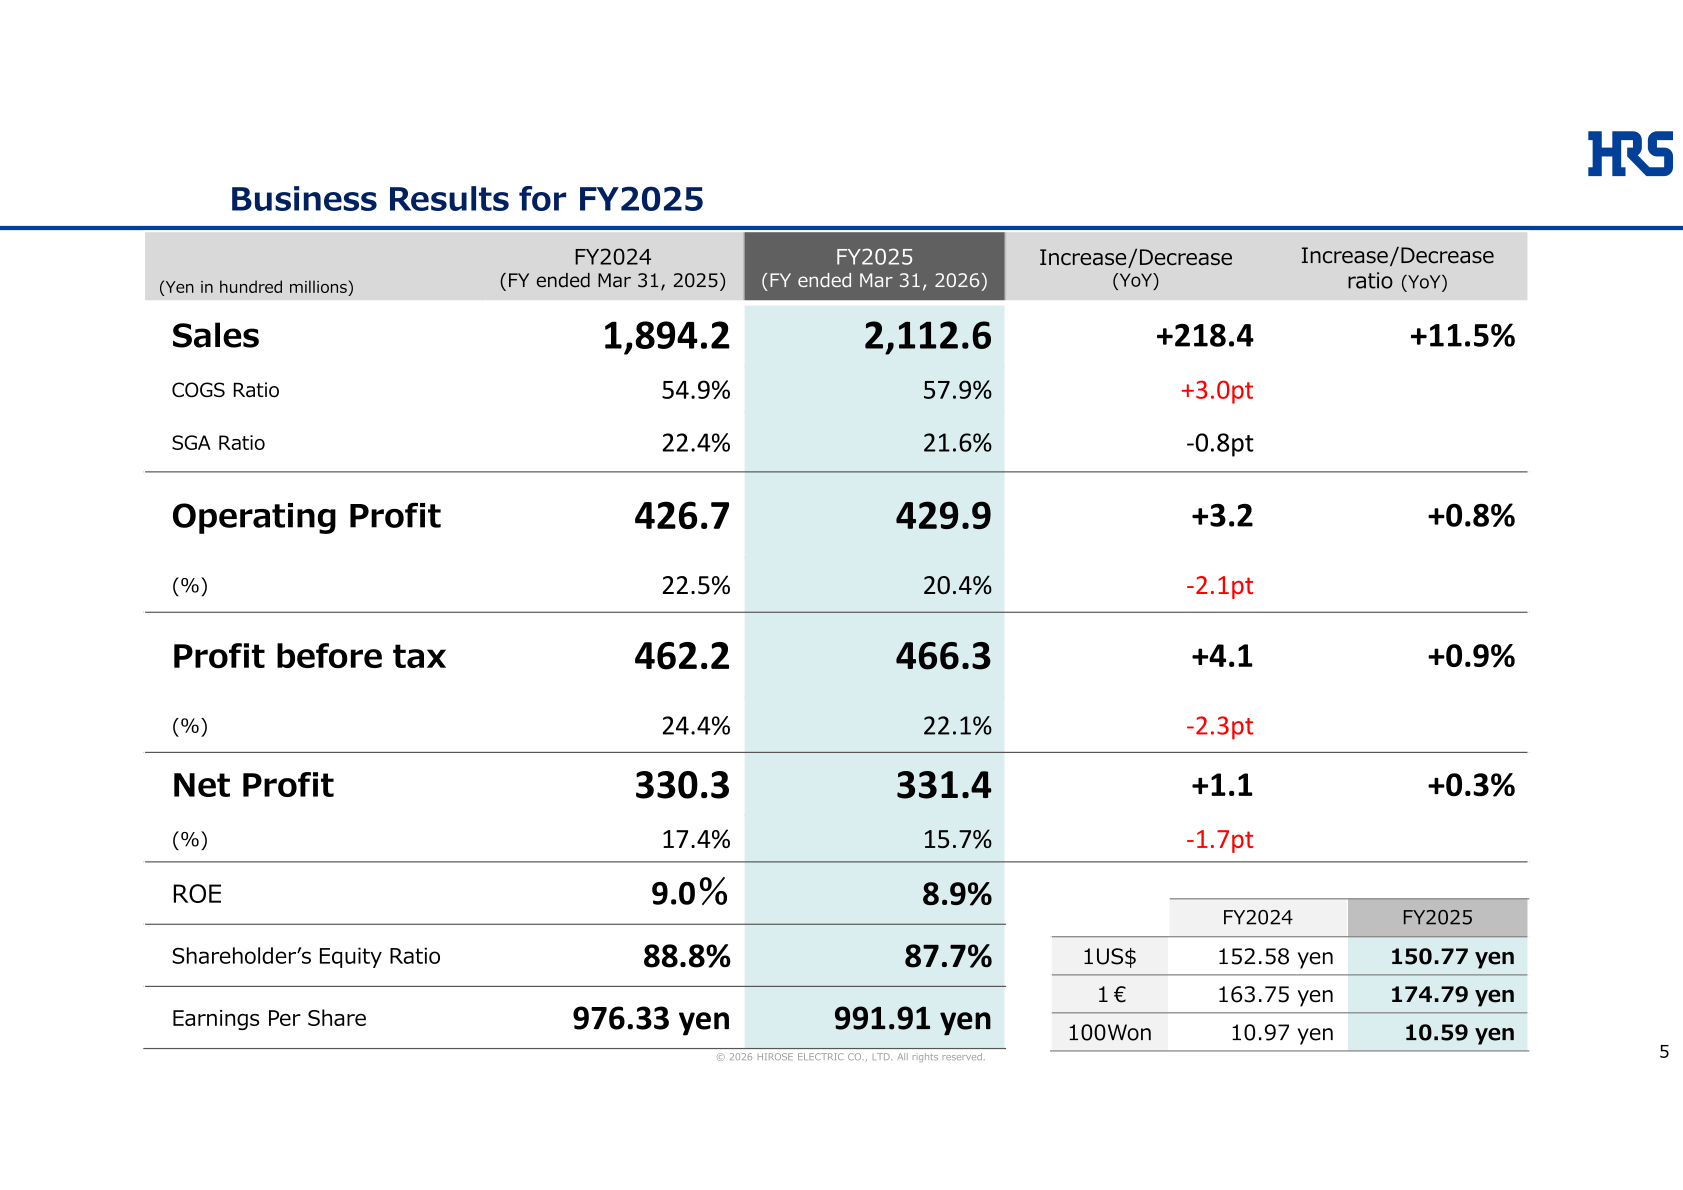
Sales for FY2025 were 2,112.6 hundred million yen, an increase of 218.4 hundred million yen (+11.5%) from 1,894.2 hundred million yen in FY2024. The company states that despite continued pressure on margins from higher material costs, including metals, sales remained solid overall: the general industrial segment delivered continued growth and outperformed the full-year forecast, seasonal softness in smartphones and consumer mobile was limited with results slightly above expectations, and automotive and mobility-related demand also remained solid. The COGS ratio deteriorated 3.0pt to 57.9% (variable expense ratio 37.9% to 41.1%, depreciation ratio 7.8% to 7.7%, labor cost ratio 7.7% to 7.9%), while the SG&A ratio improved 0.8pt to 21.6% (SG&A 424.7 to 457.1, +32.4). Operating profit was 429.9 hundred million yen (+3.2, +0.8%), with the operating profit ratio at 20.4% versus 22.5%. Profit before tax was 466.3 hundred million yen (+4.1, +0.9%), with financial income/cost up 0.9 (+35.5 to +36.3), including an exchange gain or loss that moved from -7.2 to +2.3 and a gain or loss on securities valuation of -9.4. Net profit was 331.4 hundred million yen (+1.1, +0.3%), for a net profit ratio of 15.7% versus 17.4%. ROE was 8.9% (9.0% in FY2024), the shareholders’ equity ratio 87.7% (88.8%) and earnings per share 991.91 yen (976.33 yen). Average exchange rates were 150.77 yen per US dollar (152.58 yen), 174.79 yen per euro (163.75 yen) and 10.59 yen per 100 won (10.97 yen). Orders for FY2025 were 2,249.8 hundred million yen (1H 1,061.5, 2H 1,188.3), up 16.8% from 1,926.6 hundred million yen.
| Item (Yen in hundred millions) | FY2025 (FY ended Mar 31, 2026) | FY2024 (FY ended Mar 31, 2025) | Increase/Decrease (YoY) | Increase/Decrease ratio (YoY) |
|---|---|---|---|---|
| Orders | 2,249.8 | 1,926.6 | - | +16.8% |
| Sales | 2,112.6 | 1,894.2 | +218.4 | +11.5% |
| COGS Ratio | 57.9% | 54.9% | +3.0pt | - |
| SGA Ratio | 21.6% | 22.4% | -0.8pt | - |
| Operating Profit | 429.9 | 426.7 | +3.2 | +0.8% |
| Operating Profit (%) | 20.4% | 22.5% | -2.1pt | - |
| Profit before tax | 466.3 | 462.2 | +4.1 | +0.9% |
| Profit before tax (%) | 22.1% | 24.4% | -2.3pt | - |
| Net Profit | 331.4 | 330.3 | +1.1 | +0.3% |
| Net Profit (%) | 15.7% | 17.4% | -1.7pt | - |
| ROE | 8.9% | 9.0% | - | - |
| Shareholders’ Equity Ratio | 87.7% | 88.8% | - | - |
| Earnings Per Share | 991.91 yen | 976.33 yen | - | - |
In the company’s year-on-year operating profit change analysis, operating profit moved from 427 to 430 (hundred million yen) with an increase in volume of +178, an exchange impact of -10, an increase in amortization costs of -14, increased labor costs of -38, increased material and purchasing costs of -65, price adjustments of -40, others of -14 and price optimization of +5. On the balance sheet, total assets were 4,311.8 hundred million yen as of March 31, 2026 (4,168.7 a year earlier, +143.1); cash and cash equivalents were 873.3 (+16.6), with the company citing profit +331, share buyback -203, capital investment (including buildings, etc.) -200, dividend payment -165 and redemption of securities and time deposits at maturity +263. Trade and other receivables rose 94.8 to 498.7 on increased sales, inventories rose 51.0 to 301.9 on securing raw materials due to increased orders, and property, plant and equipment rose 39.8 to 903.6. Total liabilities were 531.0 (+63.8) and total shareholders’ equity 3,780.8 (+79.3), with treasury shares at -477.7 (-203.1, share acquisition -203) and retained earnings at 3,649.3 (+159.6). Capital investment (excluding land, building and software investment) was 199 hundred million yen in FY2025 (capital investment ratio 9.4%) against 212 in FY2024, and depreciation was 161 (7.6%) against 149; the FY2026 forecast is capital investment of 250 (10.9%) and depreciation of 170 (7.4%). The number of employees was 5,110 as of March 2026 (domestic 1,724, overseas 3,386), and the company notes the domestic headcount increase of 201 was primarily attributable to the consolidation of Hirose SER.
Sales by Application
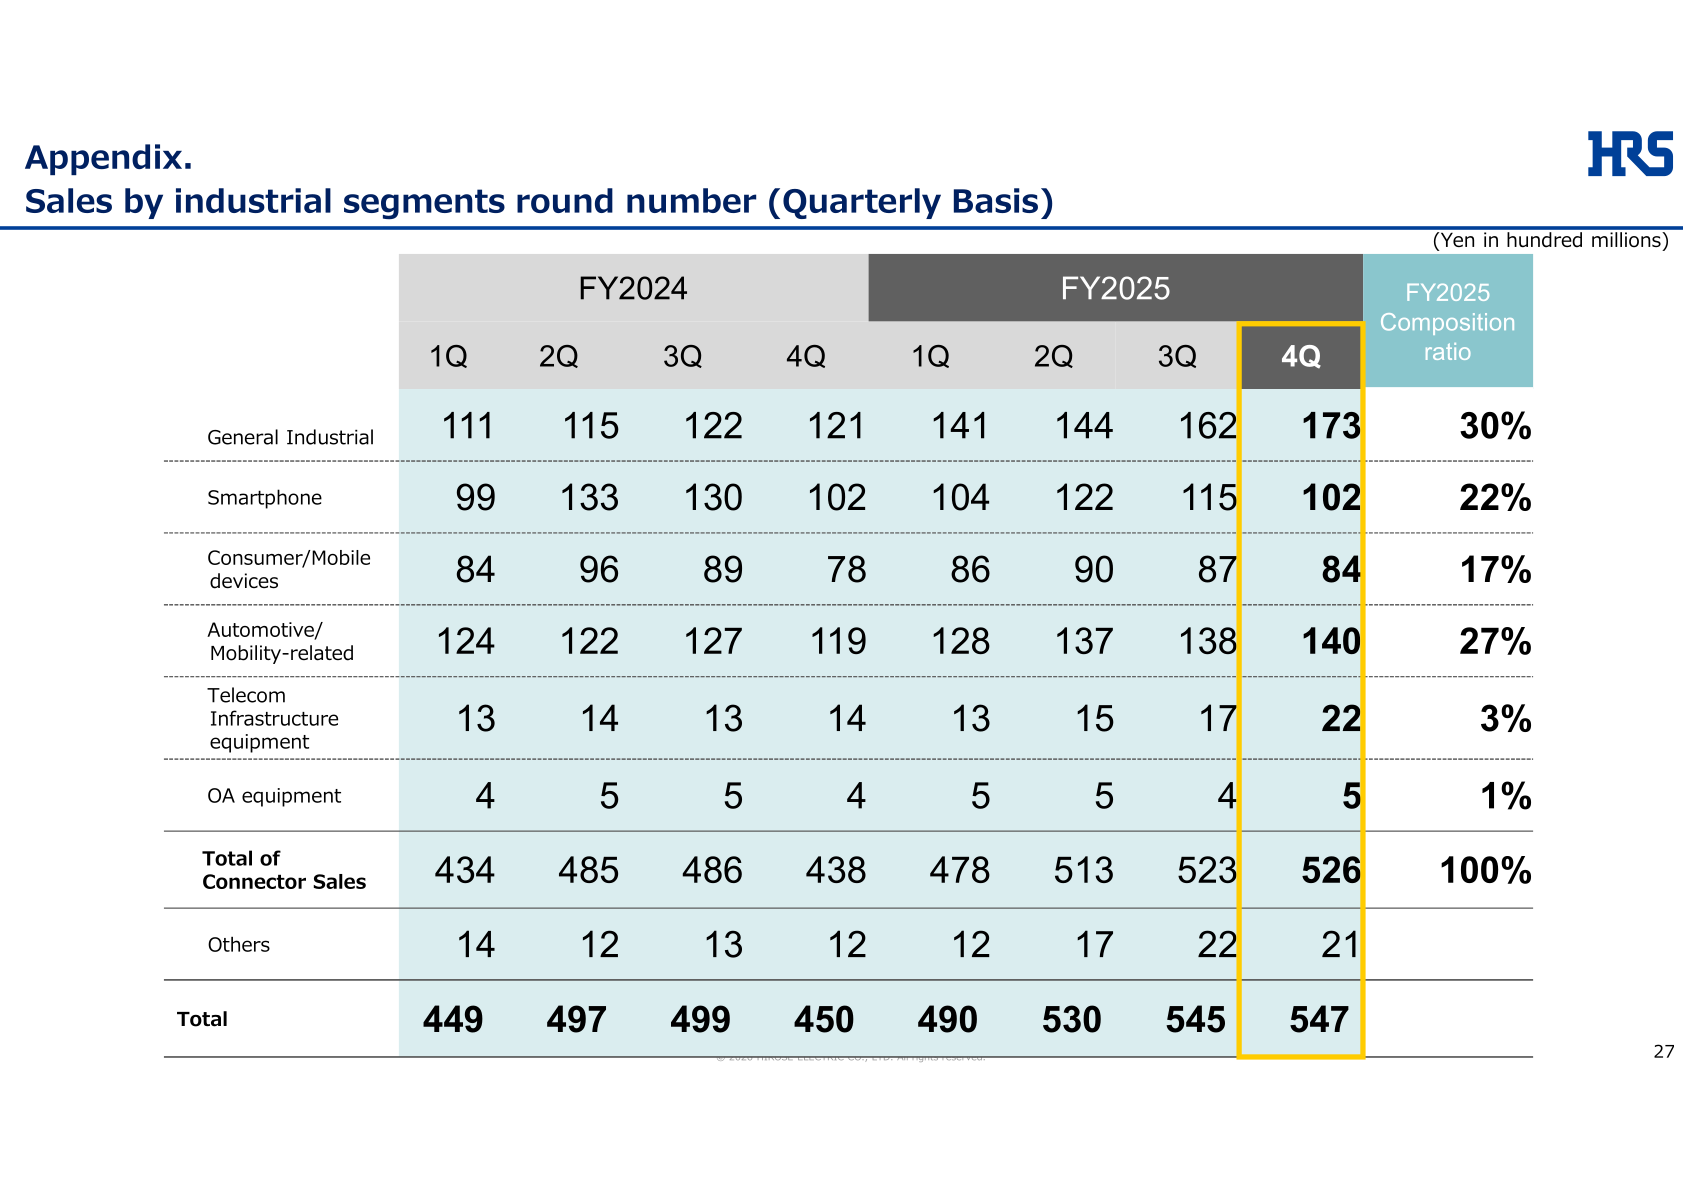
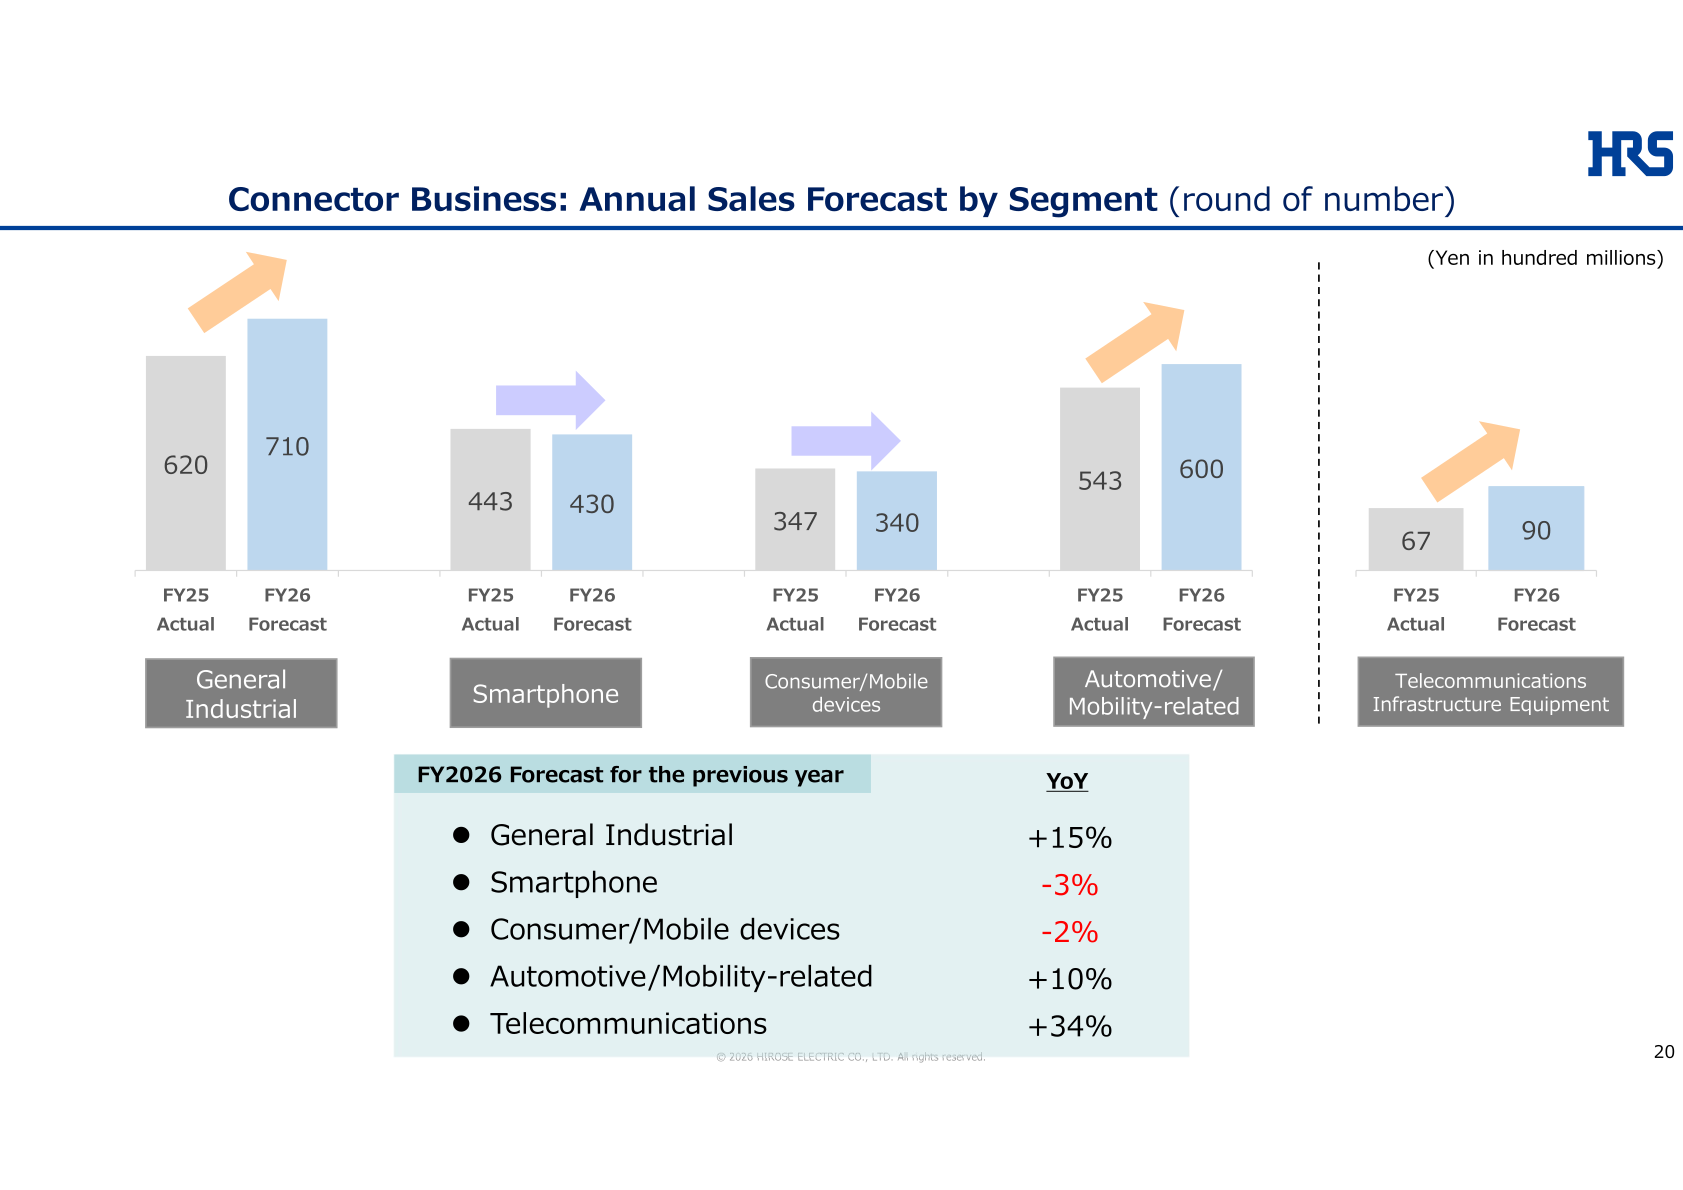
Connector sales by application (round numbers) were as follows. General Industrial sales were 620 hundred million yen, up 32% from 469, and 30% of FY2025 composition; the company says overall performance remained strong and results came in above expectations, exceeding the forecast of a 30% YoY increase. Smartphone sales were 443 (down 5% from 464; 22% composition) — despite seasonality, the 4Q decline was limited, and the full-year result was -5% YoY versus the forecast of -7%. Consumer/Mobile Equipment sales were 347 (±0% from 347; 17%) — consumer products supported performance, and results came in flat YoY versus the forecast of -2%. Automotive/Mobility-related sales were 543 (up 10% from 492; 27%), with performance remaining solid, supported by a diverse customer base and product lineup. Telecommunications Infrastructure Equipment sales were 67 (up 24% from 54; 3%), with growth due to an increase in AI server-related, and OA Equipment sales were 19 (up 6% from 18; 1%). In the FY2024 to FY2025 major changes, the company lists General Industrial +151, Smartphone -21, Automotive/Mobility-related +51 and Telecommunications +13. Quarterly total connector sales in FY2025 were 478, 513, 523 and 526 (1Q to 4Q), and total sales including Others were 490, 530, 545 and 547.
| Application (Yen in hundred millions, connector sales only) | FY2025 | FY2024 | YoY | FY2025 Composition ratio |
|---|---|---|---|---|
| General Industrial | 620 | 469 | +32% | 30% |
| Smartphone | 443 | 464 | -5% | 22% |
| Consumer/Mobile Equipment | 347 | 347 | ±0% | 17% |
| Automotive/Mobility-related | 543 | 492 | +10% | 27% |
| Telecommunications Infrastructure Equipment | 67 | 54 | +24% | 3% |
| OA Equipment | 19 | 18 | +6% | 1% |
On the new probe business, the company states that Hirose SER’s sales of probe application products and probes were 1.8 billion yen in FY25 (sales for August to March after consolidation of Hirose SER) and are forecast at 6 billion yen in FY26 (+233%). Production items are probe application products (including sockets and connectors), probes and other machined products; the customer base is primarily semiconductor-related, and the company says strong semiconductor demand continues to drive robust demand for its components for test solutions. Hirose SER is described as having the capability to mass-produce world-class ultra-miniature probes with high precision, and the company aims for sustained high growth as a new pillar while accelerating the creation of group synergies.
FY2026 Forecast
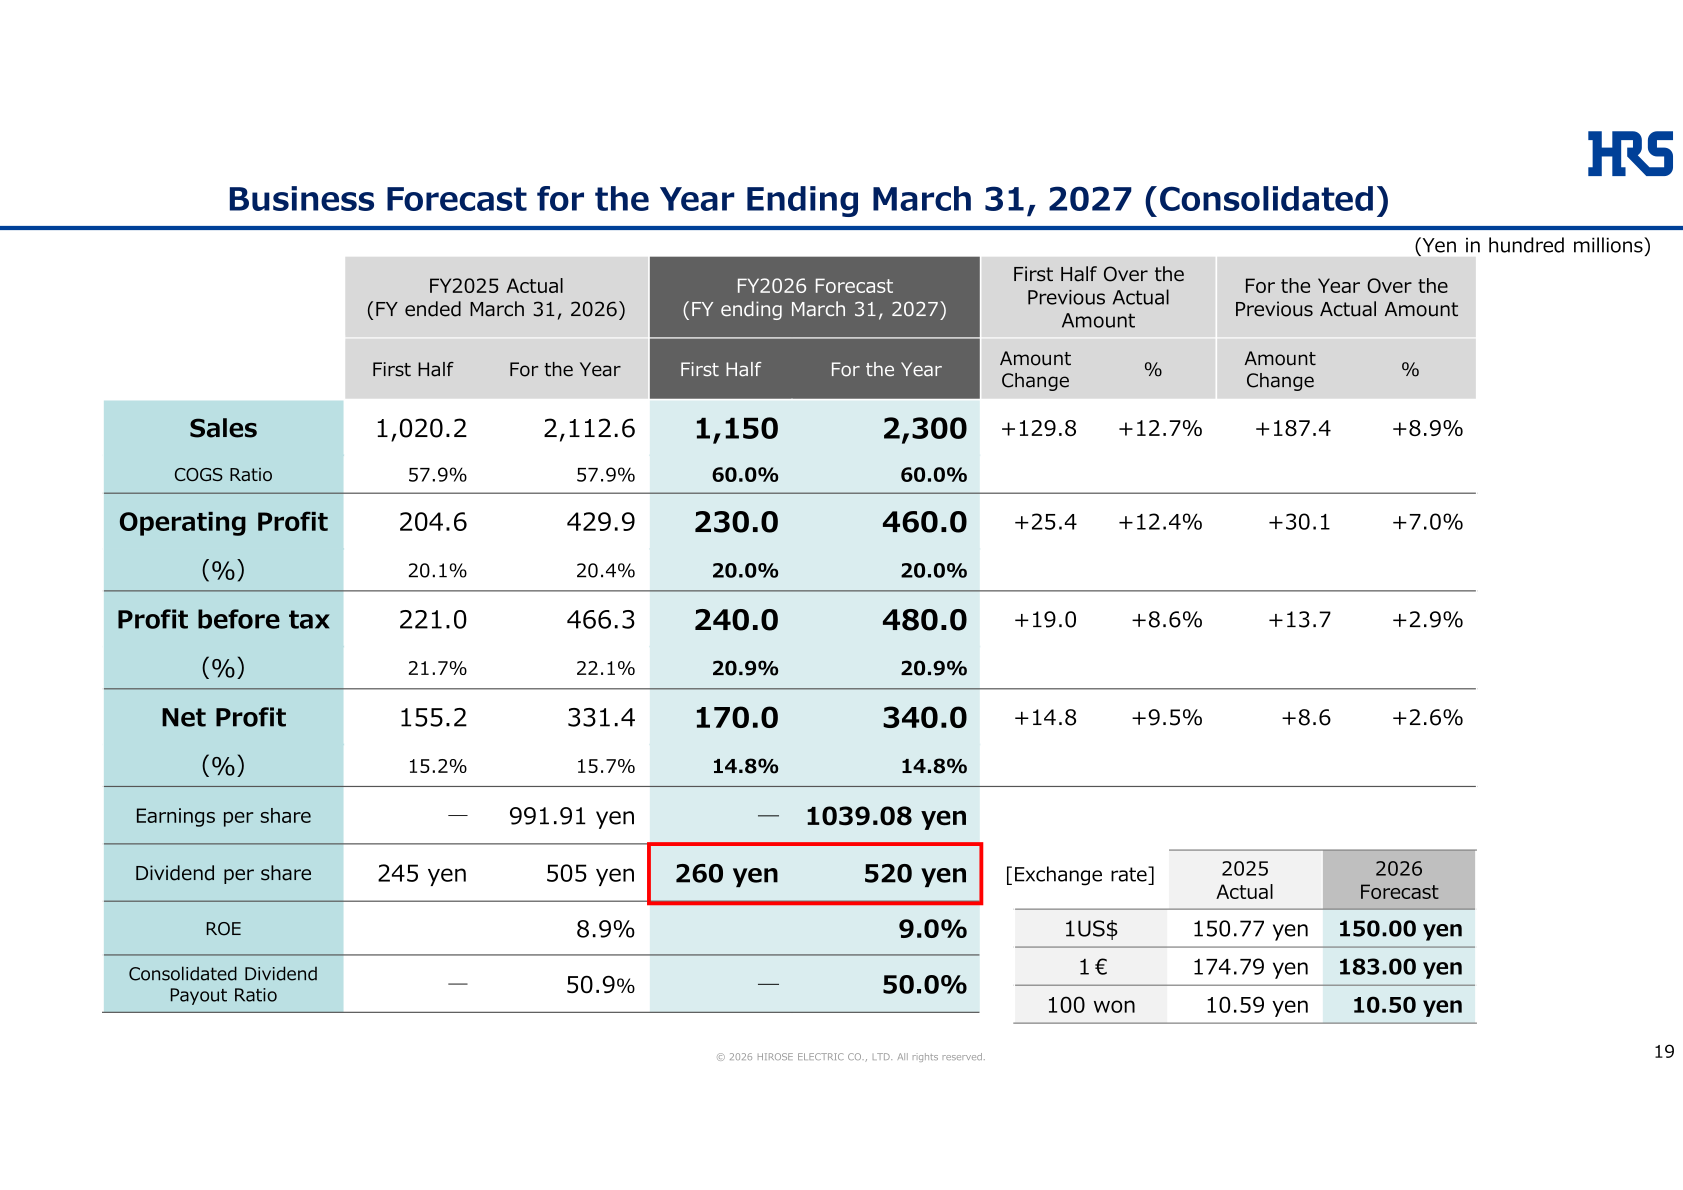
For FY2026 (FY ending March 31, 2027), the company forecasts sales of 2,300 hundred million yen (+187.4, +8.9% over the previous actual), a COGS ratio of 60.0%, operating profit of 460.0 (+30.1, +7.0%; operating profit ratio 20.0%), profit before tax of 480.0 (+13.7, +2.9%; 20.9%) and net profit of 340.0 (+8.6, +2.6%; 14.8%), with earnings per share of 1039.08 yen and ROE of 9.0%. First-half forecasts are sales of 1,150 (+129.8, +12.7%), operating profit of 230.0 (+25.4, +12.4%), profit before tax of 240.0 (+19.0, +8.6%) and net profit of 170.0 (+14.8, +9.5%). Assumed exchange rates are 150.00 yen per US dollar, 183.00 yen per euro and 10.50 yen per 100 won. In the FY2026 year-on-year operating profit assumptions, the company shows operating profit moving from 430 to 460 with an increase in volume of +110, an increase in amortization costs of -10, increased labor costs of -10, increased material and purchasing costs of -80, others of -10 and price optimization of +30, stating that although raw material cost pressures persist, growth in each segment and pricing optimization efforts are expected to drive profit growth. By connector segment (round numbers), the FY2026 forecast is General Industrial 710 (+15%), Smartphone 430 (-3%), Consumer/Mobile devices 340 (-2%), Automotive/Mobility-related 600 (+10%) and Telecommunications Infrastructure Equipment 90 (+34%).
| Item (Yen in hundred millions) | FY2026 Forecast (Full Year) | FY2025 Actual (Full Year) | Change Amount | Change % |
|---|---|---|---|---|
| Sales | 2,300 | 2,112.6 | +187.4 | +8.9% |
| COGS Ratio | 60.0% | 57.9% | - | - |
| Operating Profit | 460.0 | 429.9 | +30.1 | +7.0% |
| Operating Profit (%) | 20.0% | 20.4% | - | - |
| Profit before tax | 480.0 | 466.3 | +13.7 | +2.9% |
| Net Profit | 340.0 | 331.4 | +8.6 | +2.6% |
| Net Profit (%) | 14.8% | 15.7% | - | - |
| Earnings per share | 1039.08 yen | 991.91 yen | - | - |
| Dividend per share | 520 yen | 505 yen | - | - |
| ROE | 9.0% | 8.9% | - | - |
| Consolidated Dividend Payout Ratio | 50.0% | 50.9% | - | - |
Shareholder Returns
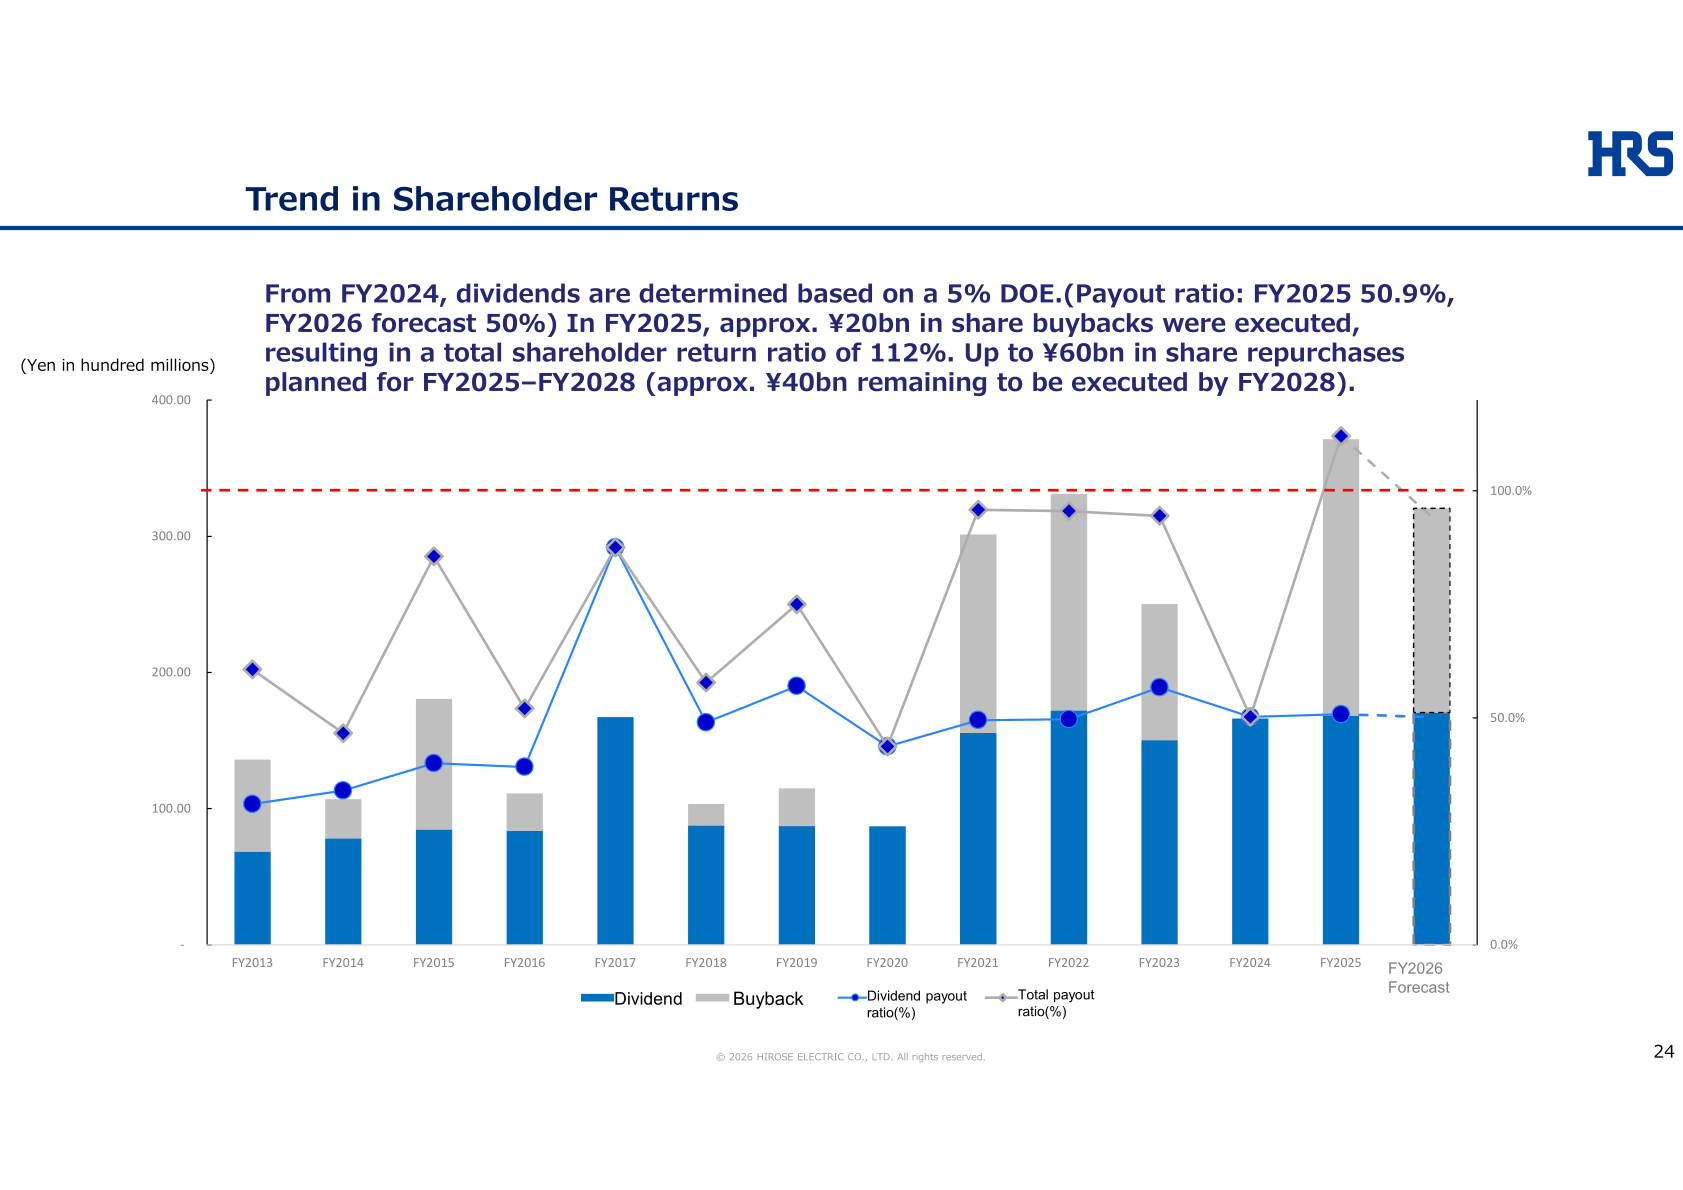
The dividend per share for FY2025 was 505 yen (first half 245 yen), and the FY2026 forecast is 520 yen (first half 260 yen). The company states that from FY2024, dividends are determined based on a 5% DOE, with a payout ratio of 50.9% for FY2025 and a forecast of 50% for FY2026. In FY2025, approx. ¥20bn in share buybacks were executed, resulting in a total shareholder return ratio of 112%. Up to ¥60bn in share repurchases are planned for FY2025–FY2028 (approx. ¥40bn remaining to be executed by FY2028).
| Item | FY2026 Forecast | FY2025 Actual |
|---|---|---|
| Dividend per share (full year) | 520 yen | 505 yen |
| Dividend per share (first half) | 260 yen | 245 yen |
| Consolidated Dividend Payout Ratio | 50.0% | 50.9% |
| Total shareholder return ratio | - | 112% |
Topics
The Hirose Technology Exhibition CONNECTION2025, held once every three years, drew 10,009 visitors, an increase of 21.5% from the previous event (7,686 in FY22; 6,704 in FY19); the company says attendance exceeded 10,000 visitors, far surpassing that of the previous event, and that through hypothesis validation conducted by its engineers it aims to generate future product concepts that incorporate feedback from customers’ design engineers. Regarding changes in board members on and after June 25, 2026, Shin Kamagata (President) and the other directors listed are to be reappointed, Chairman of the board Kazunori Ishii retires, and the ratio of outside directors is 50%.
This article is an analysis based on publicly available information and is not a recommendation to buy or sell any specific securities. Investment decisions are your own responsibility.
![[Obayashi] Investors’ Guide 2026 — The Complete 24-Article Breakdown](https://japan-equity.com/wp-content/uploads/2026/07/hub_cover-1024x1024.png)
![[Obayashi] IR & SR Policy — Feeding Dialogue Back into Management](https://japan-equity.com/wp-content/uploads/2026/07/p32_sq-1024x1024.jpg)
![[Obayashi] Domestic Civil Engineering — Resilience Spending Supports 9.6% Margin](https://japan-equity.com/wp-content/uploads/2026/07/p11_sq-1024x1024.jpg)
![[Obayashi] Overseas Construction — Orders Reach ¥1.2tn](https://japan-equity.com/wp-content/uploads/2026/07/p15_sq-1024x1024.jpg)
![[Obayashi] Share Price & External Ratings — vs TOPIX, ESG Index Inclusion](https://japan-equity.com/wp-content/uploads/2026/07/p40_sq-1024x1024.jpg)
![[Construction] ¥75.5tn Investment, Shrinking Workforce — Big-5 Market Share](https://japan-equity.com/wp-content/uploads/2026/07/p12_sq-1024x1024.jpg)



![[Obayashi] Capital Policy & Shareholder Returns — ROE 10%+, DOE ~5%, ¥100bn Buyback](https://japan-equity.com/wp-content/uploads/2026/07/p27_sq-1024x1024.jpg)
![[Obayashi] Reducing Cross-Shareholdings — ¥285.2bn Sold in Five Years](https://japan-equity.com/wp-content/uploads/2026/07/p29_sq-1024x1024.jpg)
![[Obayashi] ¥750bn Investment Plan — ¥300bn to Development, ¥190bn to Tech/DX](https://japan-equity.com/wp-content/uploads/2026/07/p30_sq-1024x1024.jpg)
![[Obayashi] MTP2022 KPIs — Operating Profit ~2x Target, ROE 14.4%](https://japan-equity.com/wp-content/uploads/2026/07/p25_sq-1024x1024.jpg)
![[Obayashi] Cash Allocation — ¥420bn Investment CF Over Five Years](https://japan-equity.com/wp-content/uploads/2026/07/p26_sq-1024x1024.jpg)
![[Obayashi] Green Energy — 44 Plants, 344MW, and the Green Hydrogen Challenge](https://japan-equity.com/wp-content/uploads/2026/07/p21_sq-1024x1024.jpg)
![[Obayashi] Tackling the Labor Shortage — Robotics Construction®](https://japan-equity.com/wp-content/uploads/2026/07/p14_sq-1024x1024.jpg)
