
This article is based on publicly available IR materials and is not a recommendation to buy or sell any specific securities.
Note: Yaskawa Electric’s fiscal year ends on February 28. The company’s materials label the fiscal year ended February 28, 2026 as “FY2025” and the fiscal year ending February 28, 2027 as “FY2026”; this article follows the labels used in the company’s materials.
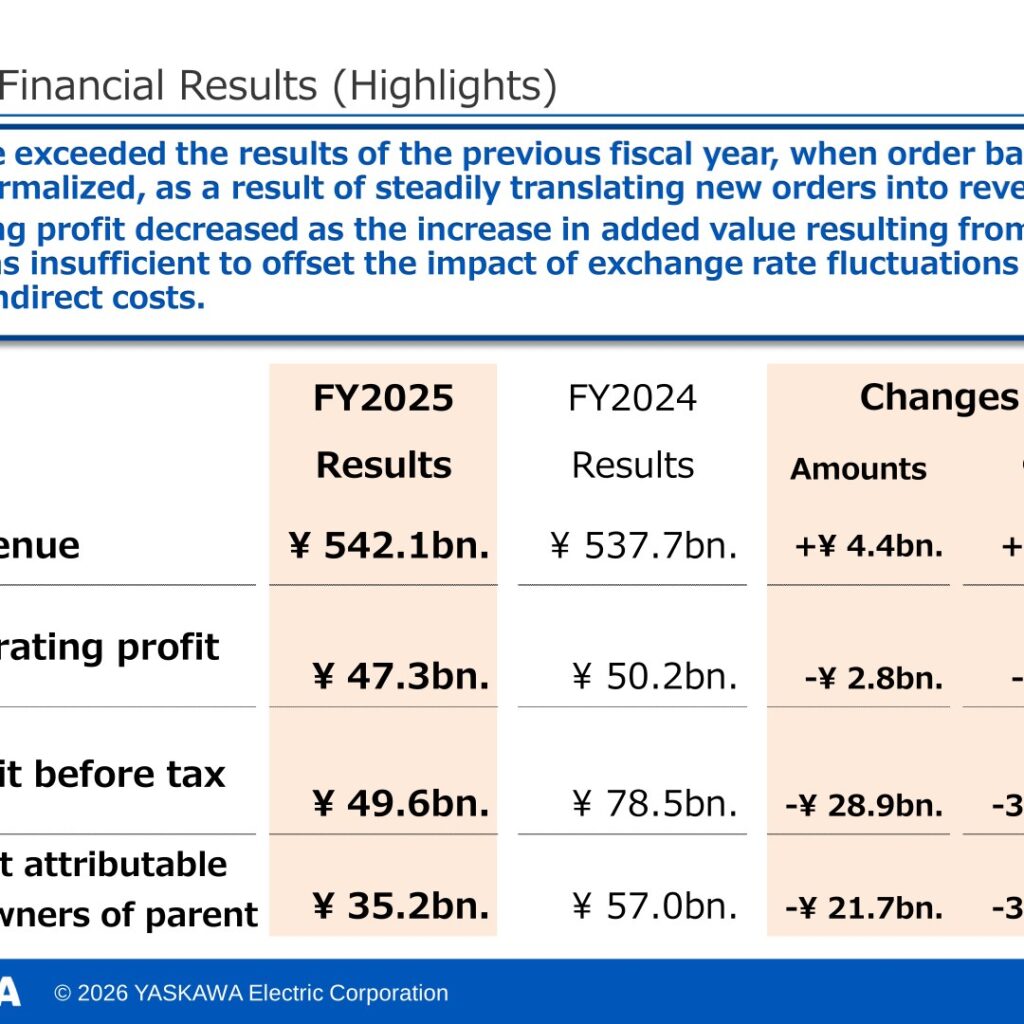
YASKAWA Electric Corporation (6506), a manufacturer of motion control products, industrial robots and system engineering solutions, released its “Results Briefing for FY2025 (Ended February 28, 2026)”. For FY2025, revenue rose 0.8% year on year to 542.1 billion yen, while operating profit fell 5.7% to 47.3 billion yen, profit before tax fell 36.8% to 49.6 billion yen and profit attributable to owners of parent fell 38.2% to 35.2 billion yen. According to the presentation, revenue exceeded the results of the previous fiscal year, when order backlogs were normalized, as a result of steadily translating new orders into revenue, while operating profit decreased as the increase in added value resulting from higher sales was insufficient to offset the impact of exchange rate fluctuations and higher indirect costs; profit before tax and profit attributable to owners of parent decreased compared to the previous fiscal year, when gains from the sale of shares in an equity-method affiliate were recorded. Fourth-quarter orders increased 20% year on year and 10% quarter on quarter, driven by growing demand in AI- and semiconductor-related fields as well as large-scale orders related to steel plant projects. For FY2026, the company forecasts revenue of 580.0 billion yen and operating profit of 60.0 billion yen, and an annual dividend of 72 yen per share.
Consolidated Results (FY2025 Full-Year Actual)
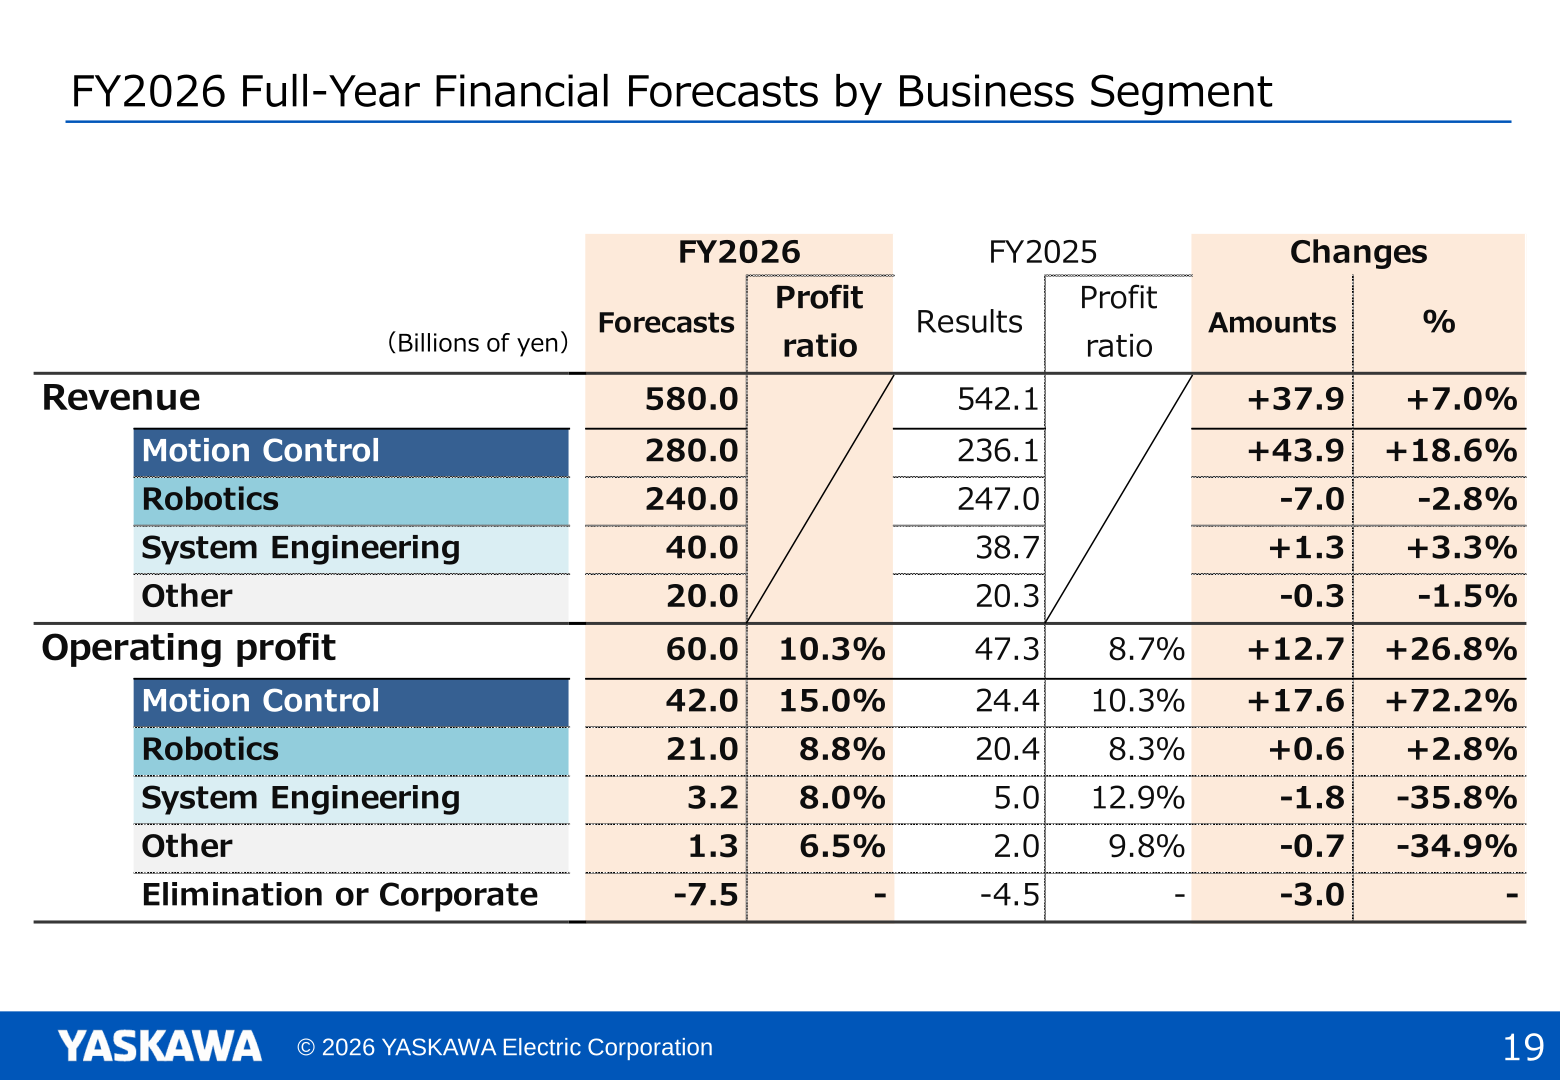
Revenue was 542.1 billion yen, up 4.4 billion yen (+0.8%) from 537.7 billion yen in FY2024. Operating profit was 47.3 billion yen, down 2.8 billion yen (-5.7%) from 50.2 billion yen; the operating profit ratio was 8.7% versus 9.3% a year earlier. Profit before tax was 49.6 billion yen, down 28.9 billion yen (-36.8%) from 78.5 billion yen, and profit attributable to owners of parent was 35.2 billion yen, down 21.7 billion yen (-38.2%) from 57.0 billion yen. By location, revenue in Japan was 148.4 billion yen (-0.6%) and overseas revenue was 393.7 billion yen (+1.4%): the Americas 128.5 billion yen (-0.7%), Europe 68.1 billion yen (-6.6%), China 116.1 billion yen (+2.6%) and Asian countries except China 81.0 billion yen (+11.1%). The presentation notes that while revenue increased in China and Asia, it declined mainly in Europe, and as a result overall revenue was flat (Europe includes the Middle East and Africa). In the breakdown of the change in operating profit from FY2024 to FY2025 (-2.9 billion yen), the company cites the effects of changes in forex rates of -1.4 billion yen, profit increase due to revenue increase of +4.4 billion yen, decrease in added value of -3.6 billion yen, increase in total expenses of -3.4 billion yen and other of +1.2 billion yen.
| Item | FY2025 Results | FY2024 Results | Change (Amount) | Change (%) |
|---|---|---|---|---|
| Revenue | 542.1 billion yen | 537.7 billion yen | +4.4 billion yen | +0.8% |
| Operating profit | 47.3 billion yen | 50.2 billion yen | -2.8 billion yen | -5.7% |
| Operating profit ratio | 8.7% | 9.3% | — | — |
| Profit before tax | 49.6 billion yen | 78.5 billion yen | -28.9 billion yen | -36.8% |
| Profit attributable to owners of parent | 35.2 billion yen | 57.0 billion yen | -21.7 billion yen | -38.2% |
On financial indices as of February 28, 2026, the ratio of equity attributable to owners of parent was 59.5%, equity attributable to owners of parent was 483.5 billion yen, interest-bearing debt was 124.9 billion yen (cash and cash equivalents 61.2 billion yen), the D/E ratio was 0.26 (net D/E ratio 0.13), inventory was 210.8 billion yen (turnover 4.5 months), ROE was 7.7% and ROIC was 6.9%. A year earlier (as of February 28, 2025), the ratio of equity attributable to owners of parent was 58.0%, equity attributable to owners of parent was 431.2 billion yen, interest-bearing debt was 109.5 billion yen (cash and cash equivalents 59.0 billion yen), the D/E ratio was 0.25 (net D/E ratio 0.12), inventory was 206.3 billion yen (turnover 4.5 months), ROE was 13.7% and ROIC was 12.2%. Operating cash flow in FY2025 was 52.2 billion yen, investment cash flow was -44.2 billion yen and free cash flow was 8.0 billion yen (FY2024: 56.5 billion yen, -21.3 billion yen and 35.2 billion yen, respectively). Capital expenditure was 57.04 billion yen (FY2024: 40.67 billion yen), depreciation and amortization was 21.08 billion yen (20.80 billion yen) and R&D investment was 24.01 billion yen (23.77 billion yen). Full-year average forex rates for FY2025 were 149.9 yen per USD, 172.8 yen per EUR, 21.01 yen per CNY and 0.105 yen per KRW.
Segment Results
Yaskawa reports three business segments, Motion Control, Robotics and System Engineering, plus Other. In FY2025, revenue increased mainly due to sales from large-scale projects in Robotics, while operating profit decreased despite growth in Motion Control and System Engineering, as it was negatively affected by Robotics. Motion Control revenue was 236.1 billion yen (-1.1%) and operating profit was 24.4 billion yen (+6.0%), with the profit ratio improving from 9.6% to 10.3%: in the AC servo & controller business, despite a decrease in sales to the semiconductor market in the U.S. and Asia, revenue increased due to higher sales mainly to the electronic components and machine tool markets, while in the Drives business, U.S. sales increased for PV inverters and air conditioning applications but revenue decreased due to a sales decline for infrastructure-related applications in China and other parts of Asia and the impact of efforts to normalize order backlogs during the previous fiscal year; operating profit increased due to factors including the improvement in added value. Robotics revenue was 247.0 billion yen (+4.0%) and operating profit was 20.4 billion yen (-14.0%), with the profit ratio falling from 10.0% to 8.3%: in the automotive market, sales declined in Japan, the Americas and Europe while increasing in China and other parts of Asia due to sales from large-scale projects, and overall segment revenue increased by capturing global demand for capital investment in the general industry, but operating profit decreased as a result of the impact on added value associated with large-scale projects. System Engineering revenue was 38.7 billion yen (+1.0%) and operating profit was 5.0 billion yen (+8.3%), with the profit ratio rising from 12.0% to 12.9%, as sales for steel plants and social systems remained steady and added value improved. Other revenue was 20.3 billion yen (-12.3%) and operating profit was 2.0 billion yen (+24.9%). Elimination or corporate was -4.5 billion yen (FY2024: -2.8 billion yen).
| Segment (Billions of yen) | Metric | FY2025 Results | FY2024 Results | Change (Amount) | Change (%) |
|---|---|---|---|---|---|
| Motion Control | Revenue | 236.1 | 238.8 | -2.7 | -1.1% |
| Motion Control | Operating profit (profit ratio) | 24.4 (10.3%) | 23.0 (9.6%) | +1.4 | +6.0% |
| Robotics | Revenue | 247.0 | 237.4 | +9.6 | +4.0% |
| Robotics | Operating profit (profit ratio) | 20.4 (8.3%) | 23.8 (10.0%) | -3.3 | -14.0% |
| System Engineering | Revenue | 38.7 | 38.4 | +0.4 | +1.0% |
| System Engineering | Operating profit (profit ratio) | 5.0 (12.9%) | 4.6 (12.0%) | +0.4 | +8.3% |
| Other | Revenue | 20.3 | 23.2 | -2.9 | -12.3% |
| Other | Operating profit (profit ratio) | 2.0 (9.8%) | 1.6 (6.9%) | +0.4 | +24.9% |
| Elimination or Corporate | Operating profit | -4.5 | -2.8 | -1.7 | — |
| Total | Revenue | 542.1 | 537.7 | +4.4 | +0.8% |
| Total | Operating profit (profit ratio) | 47.3 (8.7%) | 50.2 (9.3%) | -2.9 | -5.7% |
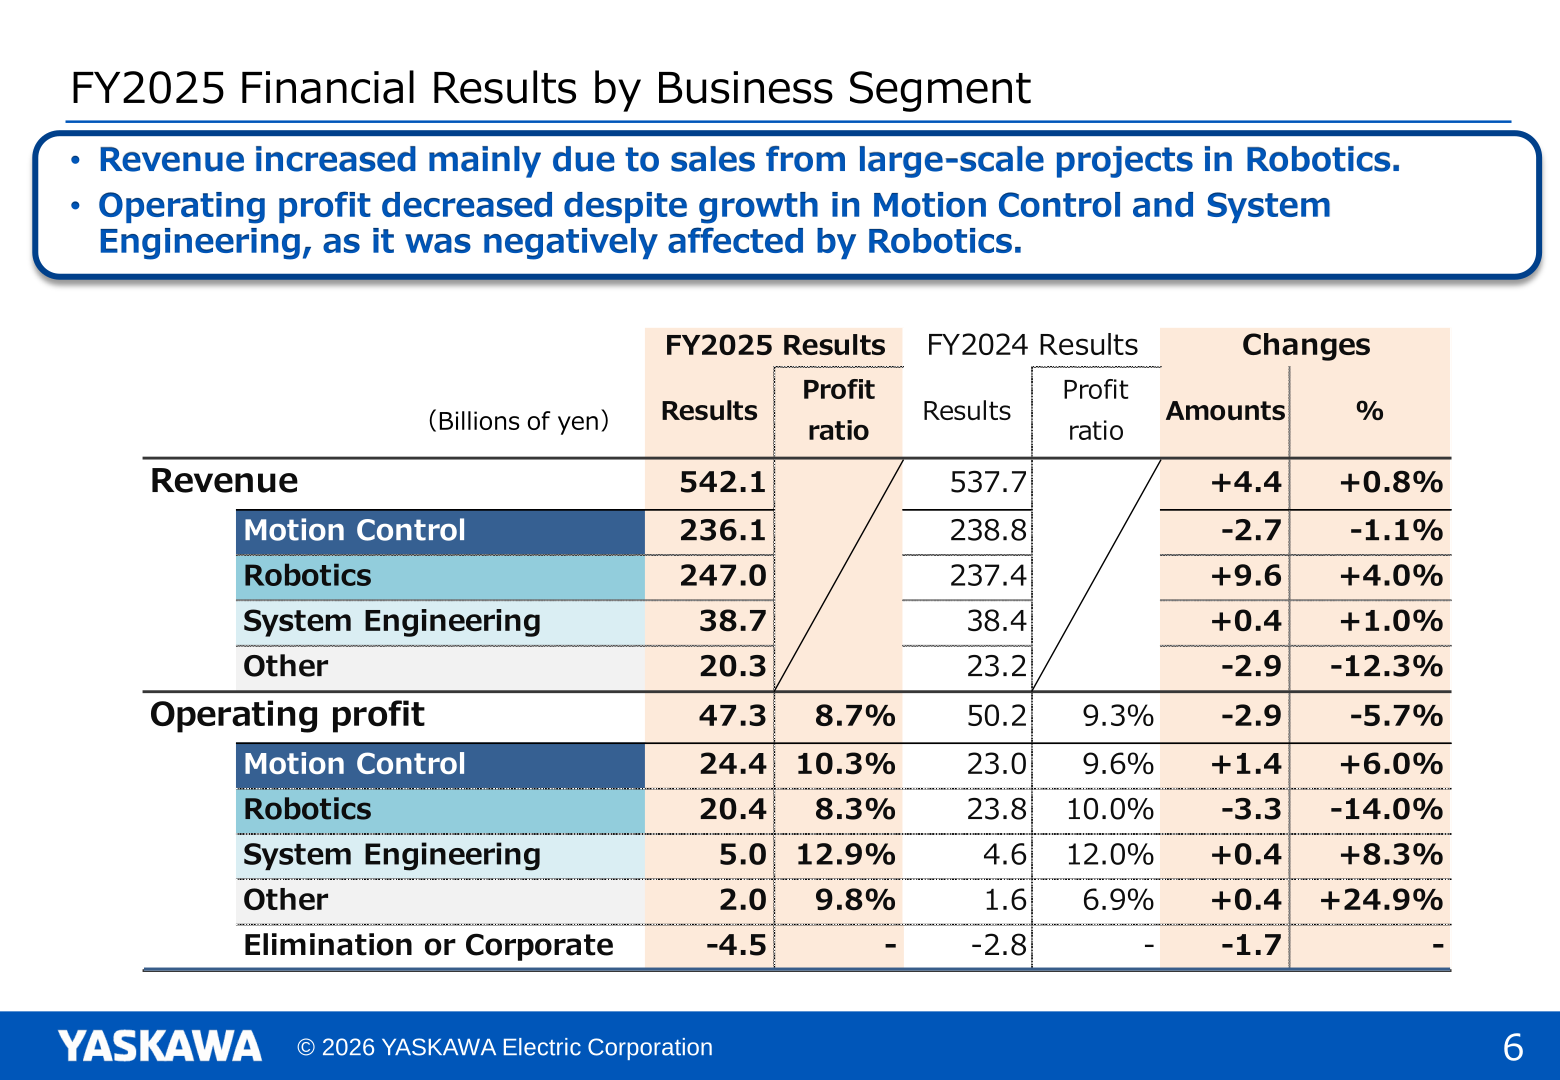
In the segment breakdown of the change in operating profit from FY2024 to FY2025, Motion Control recorded forex effects of -0.6 billion yen, change in profit due to change in revenue of -0.7 billion yen, change in added value of +2.5 billion yen, change in total expenses of -0.4 billion yen and other of +0.6 billion yen; Robotics recorded -0.8, +5.1, -6.7, -1.2 and +0.2 billion yen, respectively; System Engineering +0.0, +0.2, +0.3, -0.1 and +0.0 billion yen; and Other -0.0, -0.3, +0.3, -1.7 and +0.4 billion yen. Among the measures for FY2025, the company developed a dual-arm AI robot (MOTOMAN NEXT), signed a memorandum of understanding with SoftBank Corp. to strengthen robotics through AI and communication technologies, acquired 100% of the shares of Tokyo Robotics Inc. and started development of humanoid robot actuators, completed construction and began operation of Robot Factory No. 5 (Kitakyushu, Fukuoka Prefecture), completed construction of the Minamiyukuhashi Plant to strengthen the System Engineering business, established Cellafa Bioscience, Inc. with Astellas Pharma Inc., and acquired 100% of the shares of Variadores S.A.S. in Colombia to expand sales in South America.
FY2026 Full-Year Forecasts
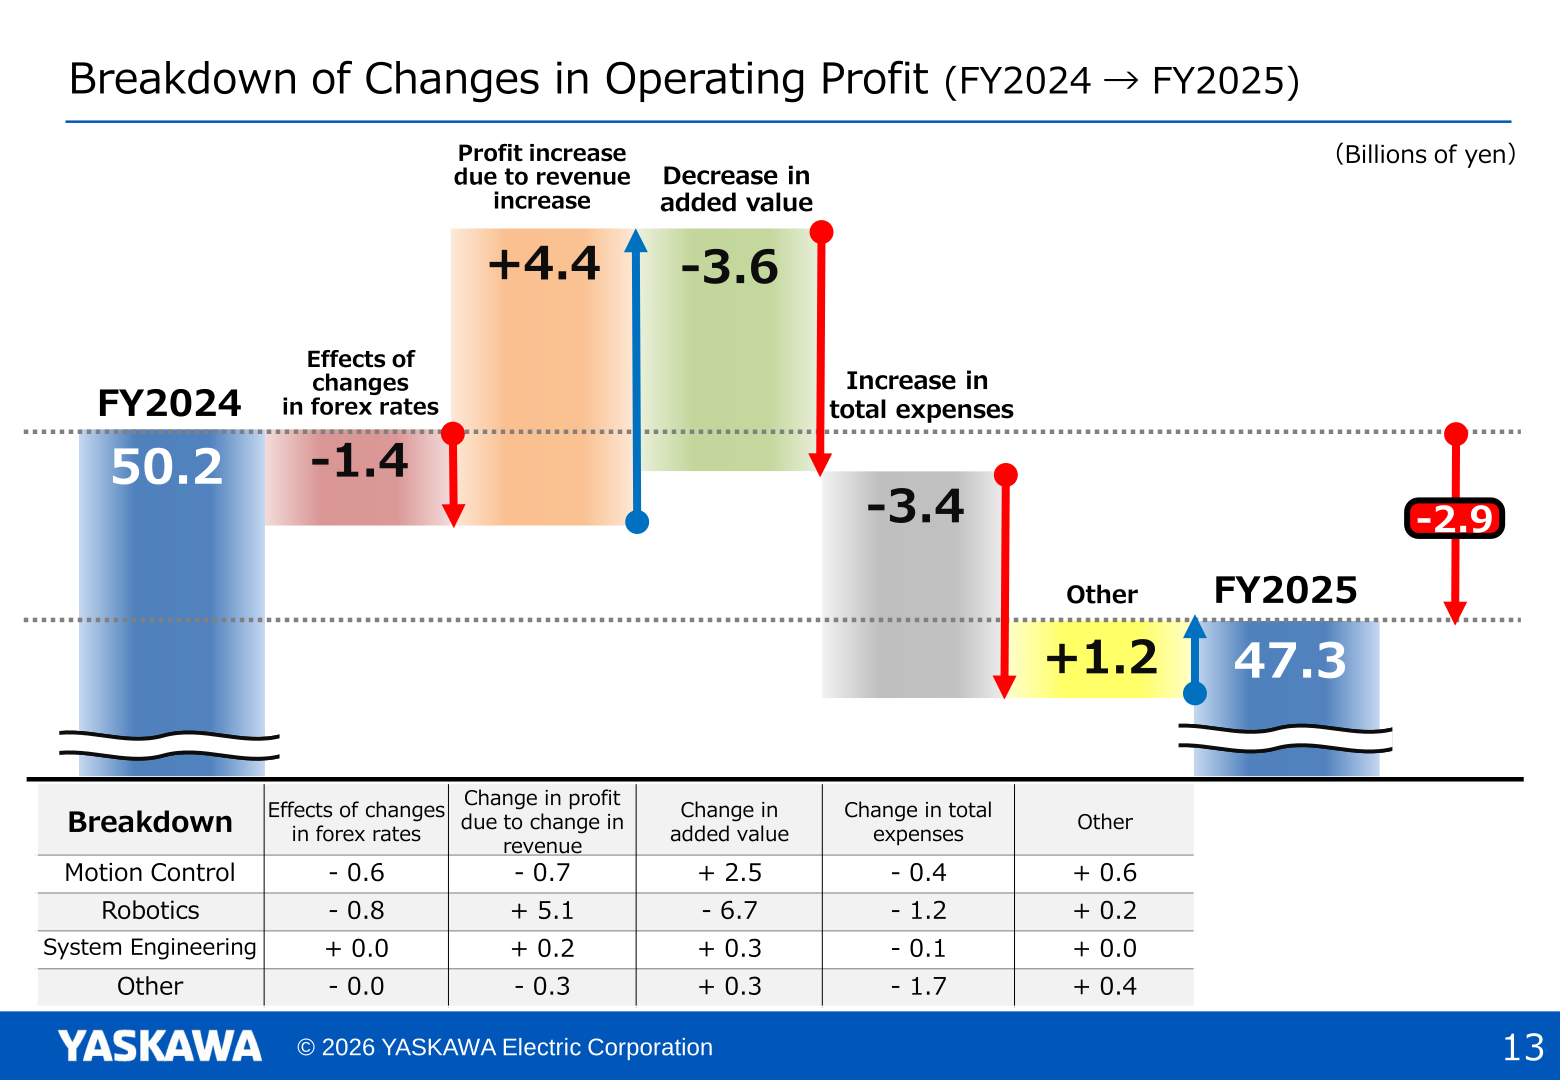
For FY2026 (year ending February 28, 2027), Yaskawa forecasts revenue of 580.0 billion yen (+37.9 billion yen, +7.0%), operating profit of 60.0 billion yen (+12.7 billion yen, +26.8%; operating profit ratio 10.3%), profit before tax of 65.0 billion yen (+15.4 billion yen, +31.1%) and profit attributable to owners of parent of 47.0 billion yen (+11.8 billion yen, +33.4%). Both revenue and profits are planned to increase considering factors including the current strong order intake driven by robust demand mainly from AI- and semiconductor-related markets. The assumed average exchange rates (from March 1, 2026 to February 28, 2027) are 1USD=145JPY, 1EUR=170JPY, 1CNY=20.5JPY and 1KRW=0.105JPY. By segment, Motion Control revenue is forecast at 280.0 billion yen (+18.6%) with operating profit of 42.0 billion yen (+72.2%, profit ratio 15.0%); Robotics revenue at 240.0 billion yen (-2.8%) with operating profit of 21.0 billion yen (+2.8%, 8.8%); System Engineering revenue at 40.0 billion yen (+3.3%) with operating profit of 3.2 billion yen (-35.8%, 8.0%); and Other revenue at 20.0 billion yen (-1.5%) with operating profit of 1.3 billion yen (-34.9%, 6.5%); elimination or corporate is -7.5 billion yen. In the breakdown of the +12.7 billion yen change in operating profit, the company cites forex effects of -3.3 billion yen, profit increase due to revenue increase of +27.1 billion yen, increase in added value of +7.9 billion yen, increase in total expenses of -17.7 billion yen and other of -1.3 billion yen. The FY2026 plan for capital expenditure is 58.00 billion yen, depreciation and amortization 26.00 billion yen and R&D investment 24.00 billion yen.
| Item | FY2026 Forecasts | FY2025 Results | Change (Amount) | Change (%) |
|---|---|---|---|---|
| Revenue | 580.0 billion yen | 542.1 billion yen | +37.9 billion yen | +7.0% |
| Operating profit | 60.0 billion yen | 47.3 billion yen | +12.7 billion yen | +26.8% |
| Operating profit ratio | 10.3% | 8.7% | — | — |
| Profit before tax | 65.0 billion yen | 49.6 billion yen | +15.4 billion yen | +31.1% |
| Profit attributable to owners of parent | 47.0 billion yen | 35.2 billion yen | +11.8 billion yen | +33.4% |
Measures for FY2026 include deepening development in the humanoid robot field through actuator technology development and verification, developing products and technologies to address new semiconductor technologies including advanced applications such as 3D packaging, stable operation of Robot Factory No. 5 and initiation of full-scale operation of the Minamiyukuhashi Plant, development of ready-to-deploy package products to accelerate sales of MOTOMAN NEXT, expansion of sales for building air conditioning and equipment cooling systems in the data center market centered on the matrix converter U1000, acceleration of deployment of harvesting and sorting solutions for vegetables and fruits at agricultural sites including those operated by JA Zen-Noh, and expansion of the application scope of “Maholo” in medical settings.
Shareholder Returns
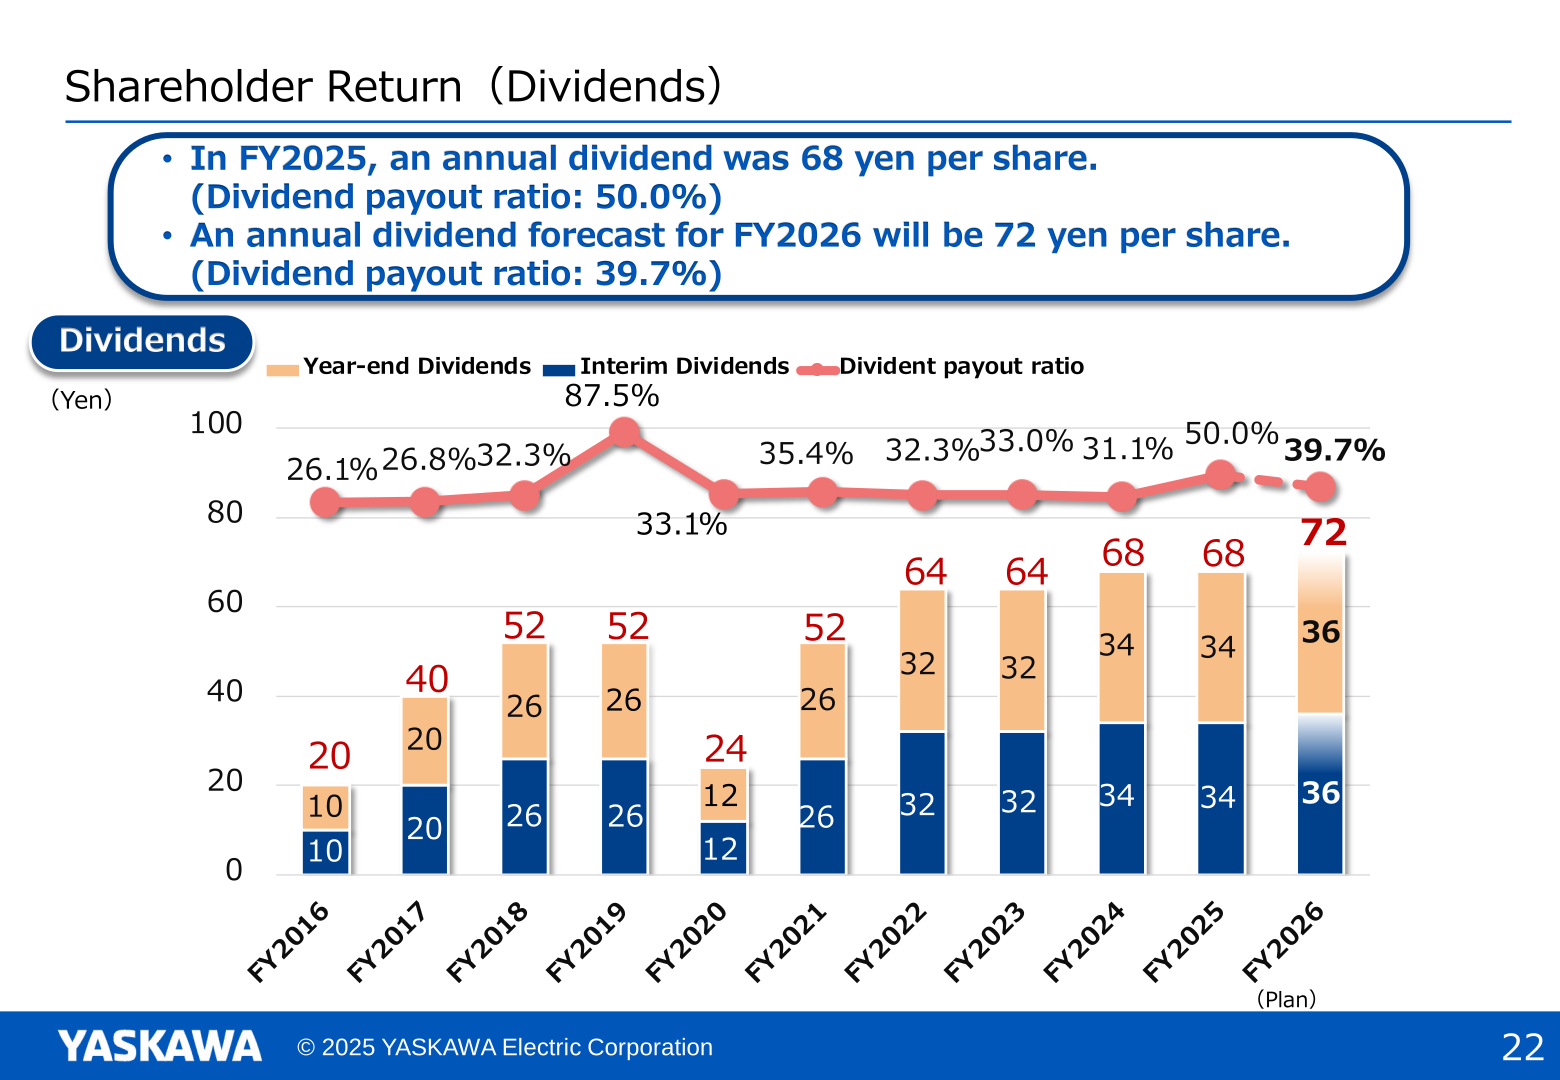
In FY2025, the annual dividend was 68 yen per share (interim 34 yen, year-end 34 yen), with a dividend payout ratio of 50.0%. In FY2024, the annual dividend was also 68 yen per share (interim 34 yen, year-end 34 yen), with a dividend payout ratio of 31.1%. For FY2026, the annual dividend forecast is 72 yen per share (interim 36 yen, year-end 36 yen), with a dividend payout ratio of 39.7%.
| Item | FY2026 (Plan) | FY2025 | FY2024 |
|---|---|---|---|
| Interim dividend (yen) | 36 | 34 | 34 |
| Year-end dividend (yen) | 36 | 34 | 34 |
| Annual dividend (yen) | 72 | 68 | 68 |
| Dividend payout ratio | 39.7% | 50.0% | 31.1% |
Topics: AI Robotics and Order Trends
The company defines AI Robotics as the “fusion of motion and AI”, in which the robot itself “sees,” “touches,” and “makes decisions,” and then translates those into “actions”; by converting AI-based recognition and judgment into autonomous movements, robots expand the range of tasks they can handle. Implementation examples presented include automation of medical instrument sorting, automation of powder weighing and loading processes, and remote and unmanned blasting operations. On orders, consolidated orders in the fourth quarter of FY2025 were up 20% year on year and up 10% quarter on quarter; by segment, Motion Control orders were up 47% year on year (+16% quarter on quarter), Robotics down 7% (-13%) and System Engineering up 40% (+122%). Within Motion Control, fourth-quarter orders in the AC servo business were up 44% year on year (+38% quarter on quarter) and in the Drives business up 50% (-1%). The forex rate impact on revenue was -2.4 billion yen in FY2025 and is forecast at -11.2 billion yen in FY2026. The presentation’s chart of revenue and operating profit from FY2016 to the FY2026 forecasts is annotated with the plan periods “Dash 25”, “Challenge 25 Plus”, “Realize 25” and “Dash 35”.
This article is an analysis based on publicly available information and is not a recommendation to buy or sell any specific securities. Investment decisions are your own responsibility.
![[Obayashi] Investors’ Guide 2026 — The Complete 24-Article Breakdown](https://japan-equity.com/wp-content/uploads/2026/07/hub_cover-1024x1024.png)
![[Obayashi] IR & SR Policy — Feeding Dialogue Back into Management](https://japan-equity.com/wp-content/uploads/2026/07/p32_sq-1024x1024.jpg)
![[Obayashi] Domestic Civil Engineering — Resilience Spending Supports 9.6% Margin](https://japan-equity.com/wp-content/uploads/2026/07/p11_sq-1024x1024.jpg)
![[Obayashi] Overseas Construction — Orders Reach ¥1.2tn](https://japan-equity.com/wp-content/uploads/2026/07/p15_sq-1024x1024.jpg)
![[Obayashi] Share Price & External Ratings — vs TOPIX, ESG Index Inclusion](https://japan-equity.com/wp-content/uploads/2026/07/p40_sq-1024x1024.jpg)
![[Construction] ¥75.5tn Investment, Shrinking Workforce — Big-5 Market Share](https://japan-equity.com/wp-content/uploads/2026/07/p12_sq-1024x1024.jpg)



![[Obayashi] Capital Policy & Shareholder Returns — ROE 10%+, DOE ~5%, ¥100bn Buyback](https://japan-equity.com/wp-content/uploads/2026/07/p27_sq-1024x1024.jpg)
![[Obayashi] Reducing Cross-Shareholdings — ¥285.2bn Sold in Five Years](https://japan-equity.com/wp-content/uploads/2026/07/p29_sq-1024x1024.jpg)
![[Obayashi] ¥750bn Investment Plan — ¥300bn to Development, ¥190bn to Tech/DX](https://japan-equity.com/wp-content/uploads/2026/07/p30_sq-1024x1024.jpg)
![[Obayashi] MTP2022 KPIs — Operating Profit ~2x Target, ROE 14.4%](https://japan-equity.com/wp-content/uploads/2026/07/p25_sq-1024x1024.jpg)
![[Obayashi] Cash Allocation — ¥420bn Investment CF Over Five Years](https://japan-equity.com/wp-content/uploads/2026/07/p26_sq-1024x1024.jpg)
![[Obayashi] Green Energy — 44 Plants, 344MW, and the Green Hydrogen Challenge](https://japan-equity.com/wp-content/uploads/2026/07/p21_sq-1024x1024.jpg)
![[Obayashi] Tackling the Labor Shortage — Robotics Construction®](https://japan-equity.com/wp-content/uploads/2026/07/p14_sq-1024x1024.jpg)
