
This article is based on publicly available IR materials and is not a recommendation to buy or sell any specific securities.
Note: FUJI CORPORATION labels the fiscal year ended March 31, 2026 as “FY2026” in its materials; this site classifies it as FY2025. The labels used in the company’s materials (FY2025 = year ended March 2025, FY2026 = year ended March 2026, FY2027 = year ending March 2027) are retained in the body, tables and figures below.
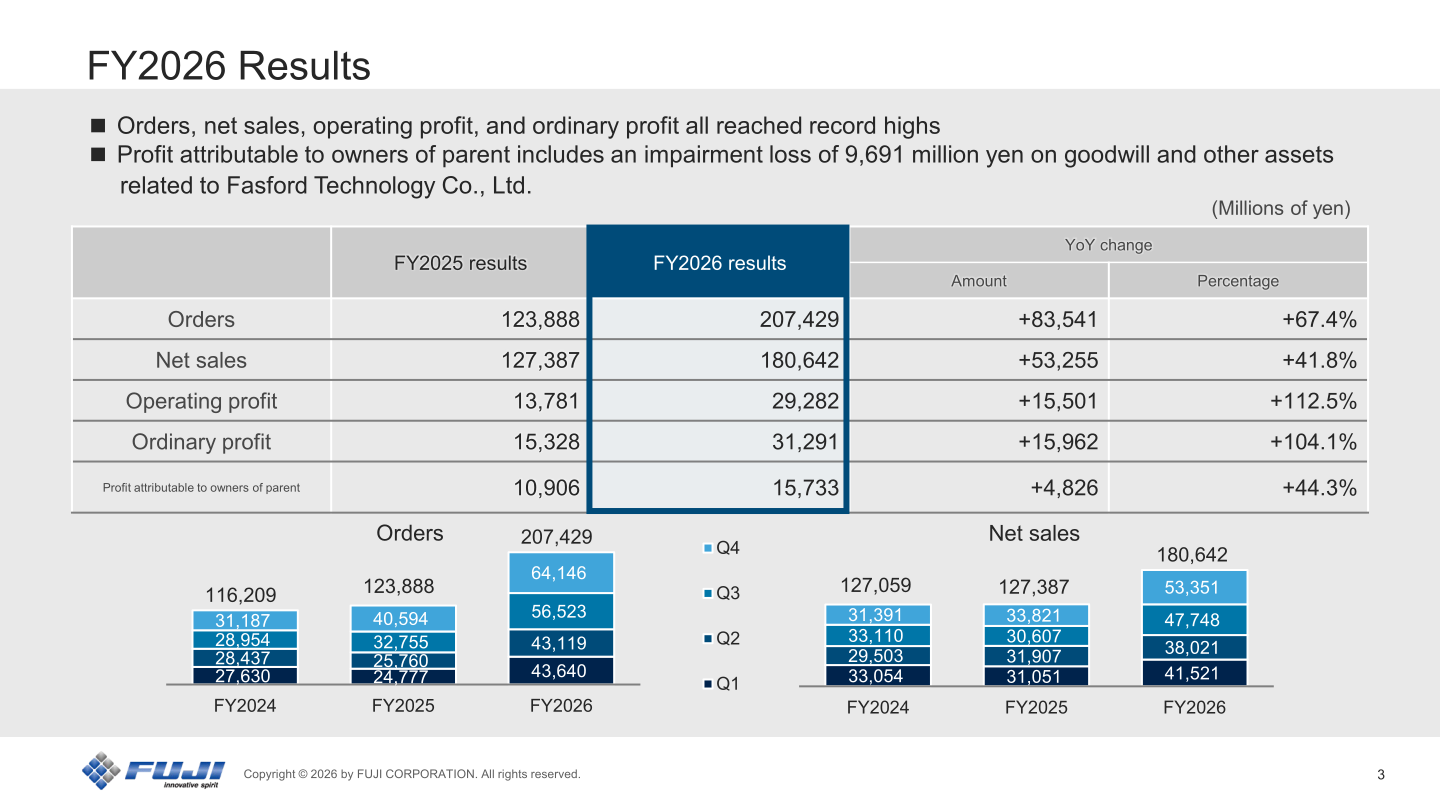
FUJI CORPORATION (6134) released its “Financial Results Briefing and Second-Year Review of Mid-Term Business Plan” for the fiscal year ended March 31, 2026 in May 2026. For FY2026, orders, net sales, operating profit, and ordinary profit all reached record highs. Orders rose to 207,429 million yen (+67.4% year on year), net sales to 180,642 million yen (+41.8%), operating profit to 29,282 million yen (+112.5%) and ordinary profit to 31,291 million yen (+104.1%). Profit attributable to owners of parent was 15,733 million yen (+44.3%), which includes an impairment loss of 9,691 million yen on goodwill and other assets related to Fasford Technology Co., Ltd.
Consolidated Results (Full-Year Actual)
Orders increased by 83,541 million yen to 207,429 million yen, and net sales increased by 53,255 million yen to 180,642 million yen. Operating profit increased by 15,501 million yen to 29,282 million yen; the company’s analysis of changes in operating profit shows a change in gross profit of +19,639 million yen and a change in SG&A expenses of -4,138 million yen. Ordinary profit increased by 15,962 million yen to 31,291 million yen, and profit attributable to owners of parent increased by 4,826 million yen to 15,733 million yen.
| Item (Millions of yen) | FY2025 results | FY2026 results | YoY change (Amount) | YoY change (%) |
|---|---|---|---|---|
| Orders | 123,888 | 207,429 | +83,541 | +67.4% |
| Net sales | 127,387 | 180,642 | +53,255 | +41.8% |
| Operating profit | 13,781 | 29,282 | +15,501 | +112.5% |
| Ordinary profit | 15,328 | 31,291 | +15,962 | +104.1% |
| Profit attributable to owners of parent | 10,906 | 15,733 | +4,826 | +44.3% |
On the balance sheet, total assets increased by 34,067 million yen to 278,356 million yen as of March 31, 2026, mainly due to increases in notes and accounts receivable-trade (+30,543 million yen) and inventories (+10,914 million yen), and a decrease in goodwill (-8,087 million yen). Total liabilities increased by 20,295 million yen to 45,902 million yen due to increases in income taxes payable (+7,440 million yen) and notes and accounts payable-trade (+6,977 million yen). Net assets increased by 13,772 million yen to 232,454 million yen due to increases in retained earnings (+8,657 million yen) and foreign currency translation adjustment (+4,187 million yen).
| Item (Millions of yen) | As of March 31, 2025 | As of March 31, 2026 | Difference |
|---|---|---|---|
| Current assets | 155,427 | 195,507 | +40,079 |
| Non-current assets | 88,862 | 82,849 | -6,012 |
| Total assets | 244,289 | 278,356 | +34,067 |
| Current liabilities | 22,256 | 43,382 | +21,126 |
| Non-current liabilities | 3,350 | 2,519 | -831 |
| Total liabilities | 25,606 | 45,902 | +20,295 |
| Net assets | 218,682 | 232,454 | +13,772 |
Segment Results
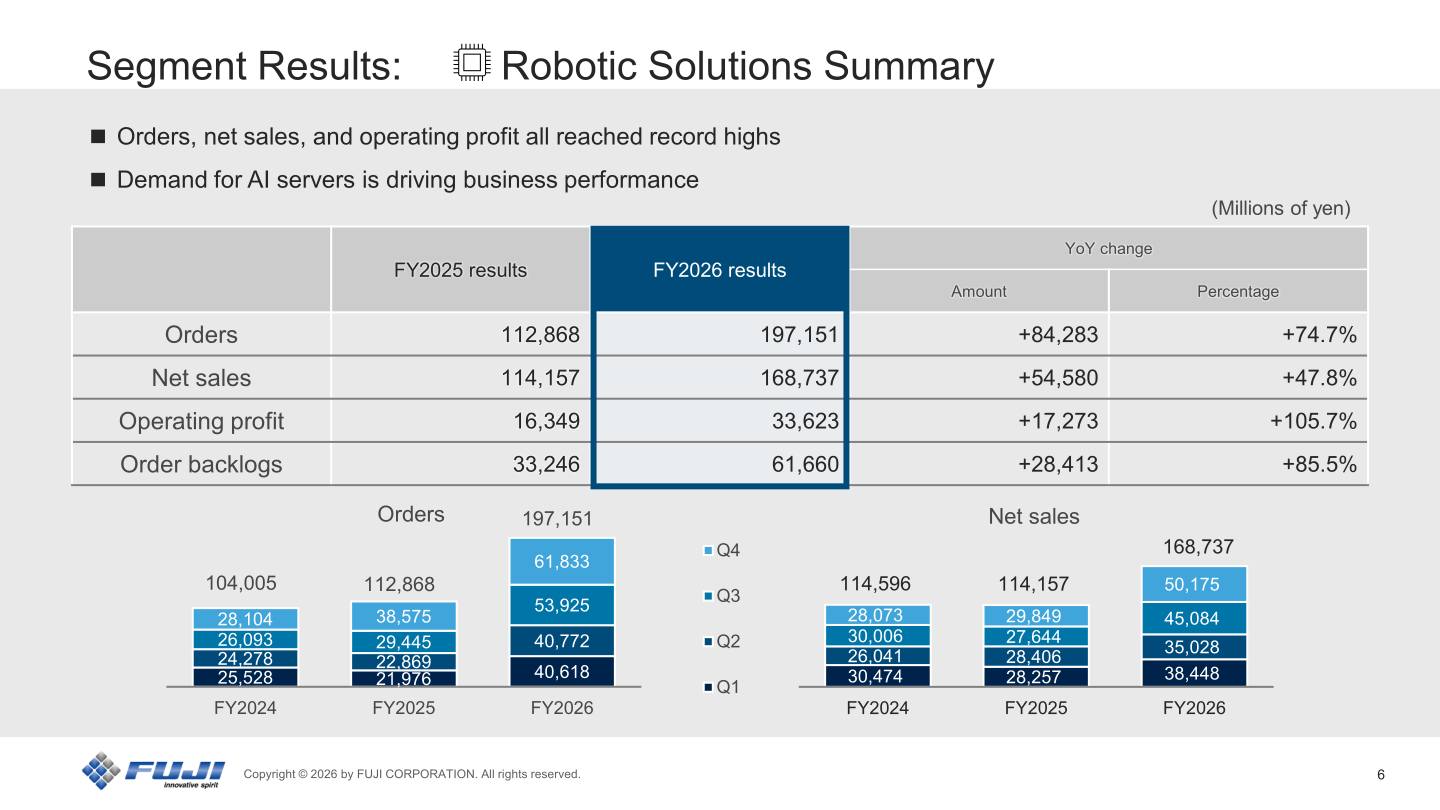
In the Robotic Solutions segment, orders, net sales, and operating profit all reached record highs, with demand for AI servers driving business performance. Orders rose 74.7% to 197,151 million yen, net sales rose 47.8% to 168,737 million yen, and operating profit rose 105.7% to 33,623 million yen. Order backlogs increased 85.5% to 61,660 million yen. By region, the company notes that in China, although demand in the telecommunications and automotive sectors has moderated, demand for die bonders is recovering, while in the rest of Asia, demand for AI servers remains high, particularly in Thailand and India. By sector, AI server-related demand continued in servers and other (including server power supplies), particularly in the Asian region, and in semiconductors, in addition to growing demand for general-purpose memory in China, market conditions have improved and the customer base has expanded in module parts and SiP applications. By machine type, the NXT was sold out by March 2026, and sales of high-speed mounters will be consolidated into NXTR.
In the Machine Tools segment, weak demand for capital investment in the automotive industry continued, resulting in a loss for the first time in two years. Orders declined 9.9% to 8,023 million yen, net sales declined 12.5% to 9,705 million yen, and operating profit was -107 million yen (versus 740 million yen in FY2025). Order backlogs declined 34.9% to 3,143 million yen. In the Others segment, FY2026 orders were 2,255 million yen and net sales were 2,199 million yen. Robotic Solutions accounted for 94% of net sales, Machine Tools for 5% and Others for 1%.
| Segment | Item (Millions of yen) | FY2025 results | FY2026 results | YoY change (Amount) | YoY change (%) |
|---|---|---|---|---|---|
| Robotic Solutions | Orders | 112,868 | 197,151 | +84,283 | +74.7% |
| Robotic Solutions | Net sales | 114,157 | 168,737 | +54,580 | +47.8% |
| Robotic Solutions | Operating profit | 16,349 | 33,623 | +17,273 | +105.7% |
| Robotic Solutions | Order backlogs | 33,246 | 61,660 | +28,413 | +85.5% |
| Machine Tools | Orders | 8,900 | 8,023 | -877 | -9.9% |
| Machine Tools | Net sales | 11,093 | 9,705 | -1,388 | -12.5% |
| Machine Tools | Operating profit | 740 | -107 | -847 | – |
| Machine Tools | Order backlogs | 4,825 | 3,143 | -1,681 | -34.9% |
FY2027 Forecast
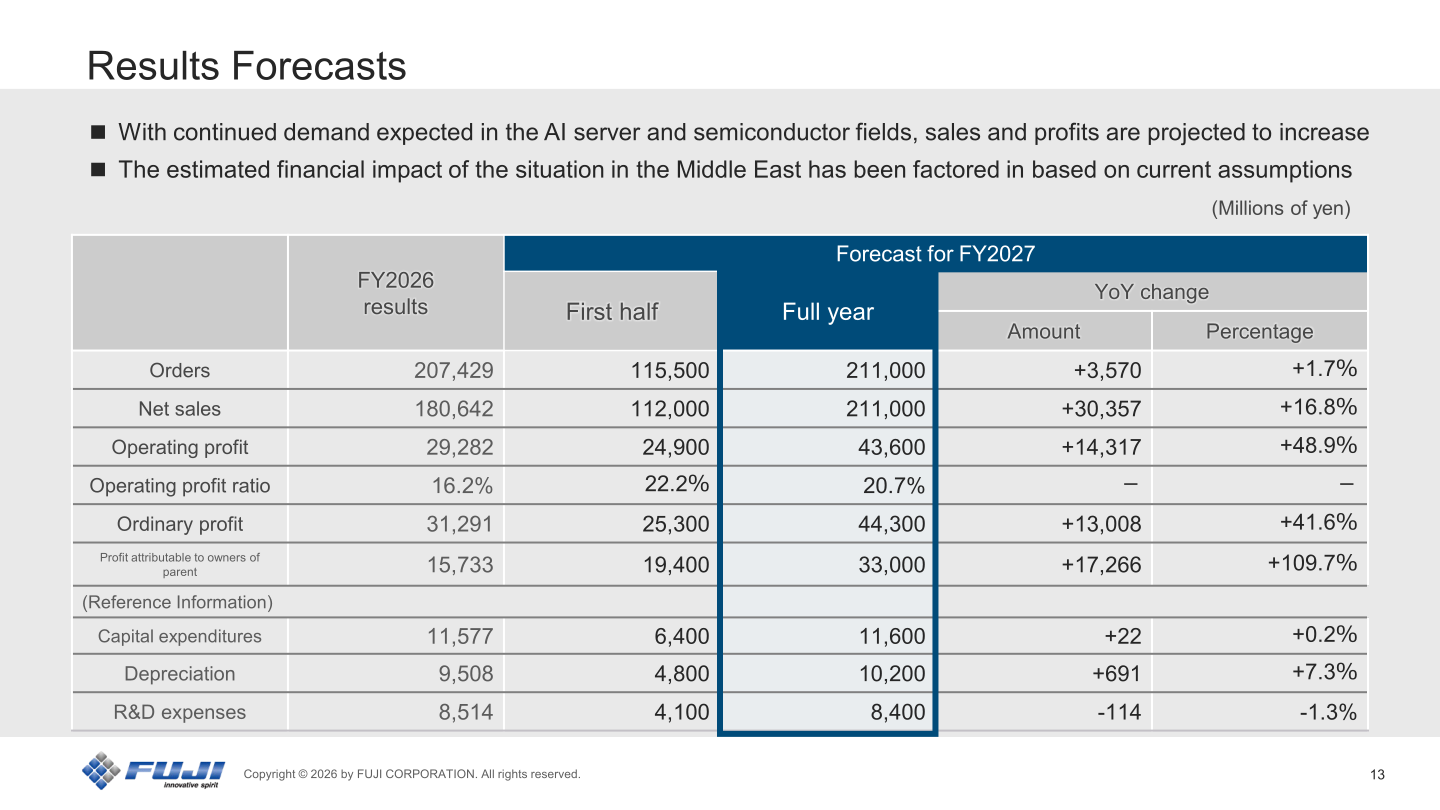
For FY2027 (the fiscal year ending March 31, 2027), FUJI forecasts orders of 211,000 million yen (+1.7%), net sales of 211,000 million yen (+16.8%), operating profit of 43,600 million yen (+48.9%), ordinary profit of 44,300 million yen (+41.6%), and profit attributable to owners of parent of 33,000 million yen (+109.7%). The operating profit ratio is forecast at 20.7% for the full year (FY2026 results: 16.2%). With continued demand expected in the AI server and semiconductor fields, sales and profits are projected to increase; the company states that the estimated financial impact of the situation in the Middle East has been factored in based on current assumptions. As reference information, capital expenditures are forecast at 11,600 million yen, depreciation at 10,200 million yen and R&D expenses at 8,400 million yen.
| Item (Millions of yen) | FY2026 results | FY2027 forecast (First half) | FY2027 forecast (Full year) | YoY change (Amount) | YoY change (%) |
|---|---|---|---|---|---|
| Orders | 207,429 | 115,500 | 211,000 | +3,570 | +1.7% |
| Net sales | 180,642 | 112,000 | 211,000 | +30,357 | +16.8% |
| Operating profit | 29,282 | 24,900 | 43,600 | +14,317 | +48.9% |
| Operating profit ratio | 16.2% | 22.2% | 20.7% | – | – |
| Ordinary profit | 31,291 | 25,300 | 44,300 | +13,008 | +41.6% |
| Profit attributable to owners of parent | 15,733 | 19,400 | 33,000 | +17,266 | +109.7% |
| Capital expenditures (reference) | 11,577 | 6,400 | 11,600 | +22 | +0.2% |
| Depreciation (reference) | 9,508 | 4,800 | 10,200 | +691 | +7.3% |
| R&D expenses (reference) | 8,514 | 4,100 | 8,400 | -114 | -1.3% |
By segment, Robotic Solutions orders are forecast at 200,000 million yen (+1.4%) and net sales at 200,000 million yen (+18.5%); Machine Tools orders at 9,000 million yen (+12.2%) and net sales at 9,000 million yen (-7.3%); and Others orders at 2,000 million yen (-11.3%) and net sales at 2,000 million yen (-9.1%). Order backlogs at the end of FY2027 are forecast to be unchanged from the end of FY2026 for each segment (total 65,133 million yen).
| Segment | Item (Millions of yen) | FY2026 results | FY2027 forecast (First half) | FY2027 forecast (Full year) | YoY change (%) |
|---|---|---|---|---|---|
| Robotic Solutions | Orders | 197,151 | 110,000 | 200,000 | +1.4% |
| Robotic Solutions | Net sales | 168,737 | 107,000 | 200,000 | +18.5% |
| Machine Tools | Orders | 8,023 | 4,500 | 9,000 | +12.2% |
| Machine Tools | Net sales | 9,705 | 4,000 | 9,000 | -7.3% |
| Others | Orders | 2,255 | 1,000 | 2,000 | -11.3% |
| Others | Net sales | 2,199 | 1,000 | 2,000 | -9.1% |
| Total | Orders | 207,429 | 115,500 | 211,000 | +1.7% |
| Total | Net sales | 180,642 | 112,000 | 211,000 | +16.8% |
Shareholder Returns
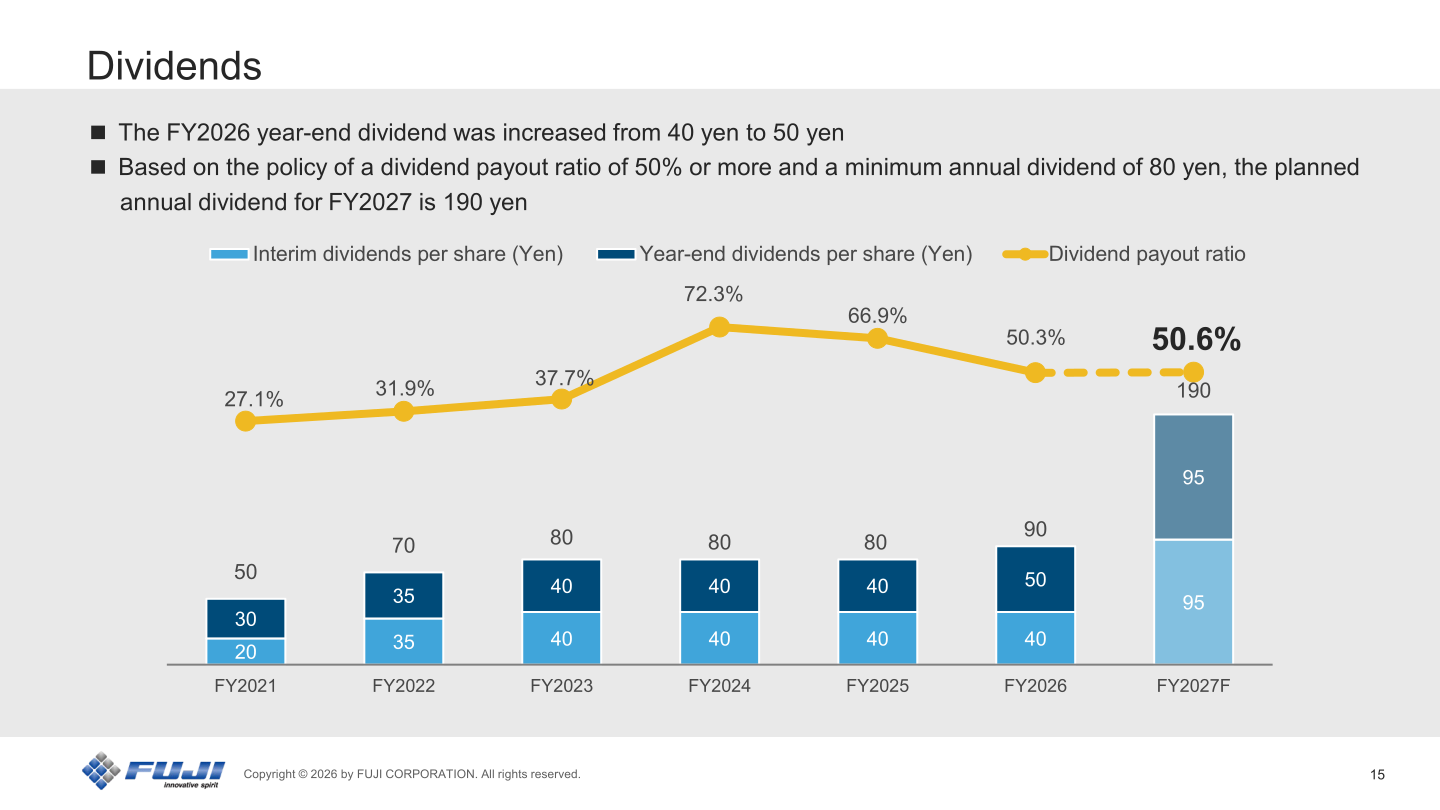
The FY2026 year-end dividend was increased from 40 yen to 50 yen per share, bringing the annual dividend for FY2026 to 90 yen (interim 40 yen, year-end 50 yen), versus 80 yen for FY2025. The dividend payout ratio for FY2026 was 50.3%. Based on the policy of a dividend payout ratio of 50% or more and a minimum annual dividend of 80 yen, the planned annual dividend for FY2027 is 190 yen (interim 95 yen, year-end 95 yen), with a payout ratio of 50.6%. In its management focused on capital efficiency, the company also plans a flexible share repurchase totaling 10 billion yen in fiscal 2027.
| Item | FY2021 | FY2022 | FY2023 | FY2024 | FY2025 | FY2026 | FY2027F |
|---|---|---|---|---|---|---|---|
| Interim dividends per share (Yen) | 20 | 35 | 40 | 40 | 40 | 40 | 95 |
| Year-end dividends per share (Yen) | 30 | 35 | 40 | 40 | 40 | 50 | 95 |
| Annual dividends per share (Yen) | 50 | 70 | 80 | 80 | 80 | 90 | 190 |
| Dividend payout ratio | 27.1% | 31.9% | 37.7% | 72.3% | 66.9% | 50.3% | 50.6% |
Mid-Term Business Plan: Second-Year Review
The mid-term business plan covers FY2025 to FY2027. In the second year (FY2026), the sales target of 180,000 million yen set in the plan was achieved, and results for the current fiscal year, the final year of the plan, are expected to significantly exceed the plan. The mid-term plan targets are: Robotic Solutions — expand sales by capturing demand for AI server-related products and semiconductors (SiP and module parts); Semiconductors — recovery in the die bonder market for general-purpose memory applications; and Machine Tools — improve profitability and return to profit (focusing on turnkey solutions, maintenance, and modifications).
Under its management focused on capital efficiency, ROE improved from 4.9% in the first year to 7.0% in the second year, and the final-year target has been revised to 11% or more (from 10%), against a cost of shareholders’ equity of 8% to 9% (9% to 10% in the final year). Operating profit was 13.7 billion yen in the first year and 29.2 billion yen in the second year, with 43.6 billion yen planned for the final year; profit attributable to owners of parent was 10.9 billion yen, 15.7 billion yen and 33 billion yen respectively. Shareholders’ equity was 218.5 billion yen, 232.3 billion yen and 240 billion yen (final-year plan). The company intends to increase shareholders’ equity in line with business growth and plans a flexible share repurchase totaling 10 billion yen in fiscal 2027.
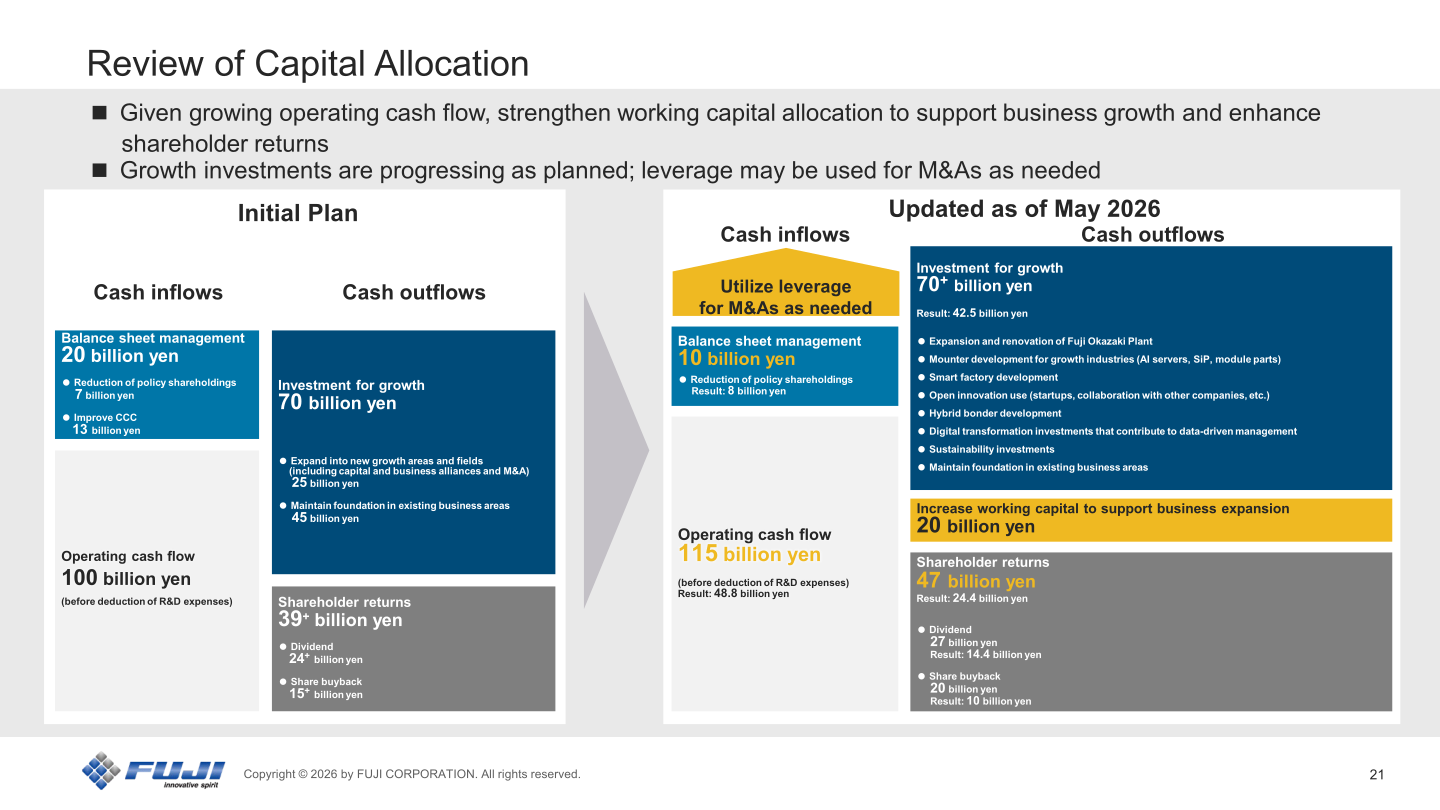
In its review of capital allocation (updated as of May 2026), operating cash flow over the plan period (before deduction of R&D expenses) is now set at 115 billion yen (initial plan: 100 billion yen; result to date: 48.8 billion yen). Cash outflows comprise balance sheet management of 10 billion yen through reduction of policy shareholdings (result: 8 billion yen), investment for growth of 70+ billion yen (result: 42.5 billion yen), an increase in working capital of 20 billion yen to support business expansion, and shareholder returns of 47 billion yen (result: 24.4 billion yen), consisting of dividends of 27 billion yen (result: 14.4 billion yen) and share buybacks of 20 billion yen (result: 10 billion yen). Growth investments are progressing as planned, and leverage may be used for M&As as needed.
This article is an analysis based on publicly available information and is not a recommendation to buy or sell any specific securities. Investment decisions are your own responsibility.
![[Obayashi] Investors’ Guide 2026 — The Complete 24-Article Breakdown](https://japan-equity.com/wp-content/uploads/2026/07/hub_cover-1024x1024.png)
![[Obayashi] IR & SR Policy — Feeding Dialogue Back into Management](https://japan-equity.com/wp-content/uploads/2026/07/p32_sq-1024x1024.jpg)
![[Obayashi] Real Estate Development — 18.7% Margin, ¥287.7bn Unrealized Gains](https://japan-equity.com/wp-content/uploads/2026/07/p20_sq-1024x1024.jpg)
![[Obayashi] Domestic Civil Engineering — Resilience Spending Supports 9.6% Margin](https://japan-equity.com/wp-content/uploads/2026/07/p11_sq-1024x1024.jpg)
![[Obayashi] Share Price & External Ratings — vs TOPIX, ESG Index Inclusion](https://japan-equity.com/wp-content/uploads/2026/07/p40_sq-1024x1024.jpg)
![[Construction] ¥75.5tn Investment, Shrinking Workforce — Big-5 Market Share](https://japan-equity.com/wp-content/uploads/2026/07/p12_sq-1024x1024.jpg)



![[Obayashi] Capital Policy & Shareholder Returns — ROE 10%+, DOE ~5%, ¥100bn Buyback](https://japan-equity.com/wp-content/uploads/2026/07/p27_sq-1024x1024.jpg)
![[Obayashi] Reducing Cross-Shareholdings — ¥285.2bn Sold in Five Years](https://japan-equity.com/wp-content/uploads/2026/07/p29_sq-1024x1024.jpg)
![[Obayashi] ¥750bn Investment Plan — ¥300bn to Development, ¥190bn to Tech/DX](https://japan-equity.com/wp-content/uploads/2026/07/p30_sq-1024x1024.jpg)
![[Obayashi] MTP2022 KPIs — Operating Profit ~2x Target, ROE 14.4%](https://japan-equity.com/wp-content/uploads/2026/07/p25_sq-1024x1024.jpg)
![[Obayashi] Cash Allocation — ¥420bn Investment CF Over Five Years](https://japan-equity.com/wp-content/uploads/2026/07/p26_sq-1024x1024.jpg)
![[Obayashi] Green Energy — 44 Plants, 344MW, and the Green Hydrogen Challenge](https://japan-equity.com/wp-content/uploads/2026/07/p21_sq-1024x1024.jpg)
![[Obayashi] Tackling the Labor Shortage — Robotics Construction®](https://japan-equity.com/wp-content/uploads/2026/07/p14_sq-1024x1024.jpg)
