
This article is based on publicly available IR materials and is not a recommendation to buy or sell any specific securities.
Note on fiscal-year labelling: ALSOK labels the year ended March 31, 2026 as “FY2026” and the year ending March 31, 2027 as “FY2027”, while japan-equity.com classifies this most recently completed full year as FY2025; all figures, tables and labels below follow the company’s own presentation.
ALSOK CO., LTD. (securities code 2331) reported record-high net sales and record profits at each profit level for FY2026. Net sales rose 8.2% year on year to 597.0 billion yen, operating income rose 16.7% to 46.9 billion yen, ordinary income rose 15.8% to 49.9 billion yen, and profit attributable to owners of parent rose 22.7% to 33.2 billion yen. ROE improved to 9.2% from 7.9%. For FY2027 the company plans continued revenue and profit growth, guiding to net sales of 637.5 billion yen and ordinary income of 58.5 billion yen.
Consolidated Results (Full-Year Actual)
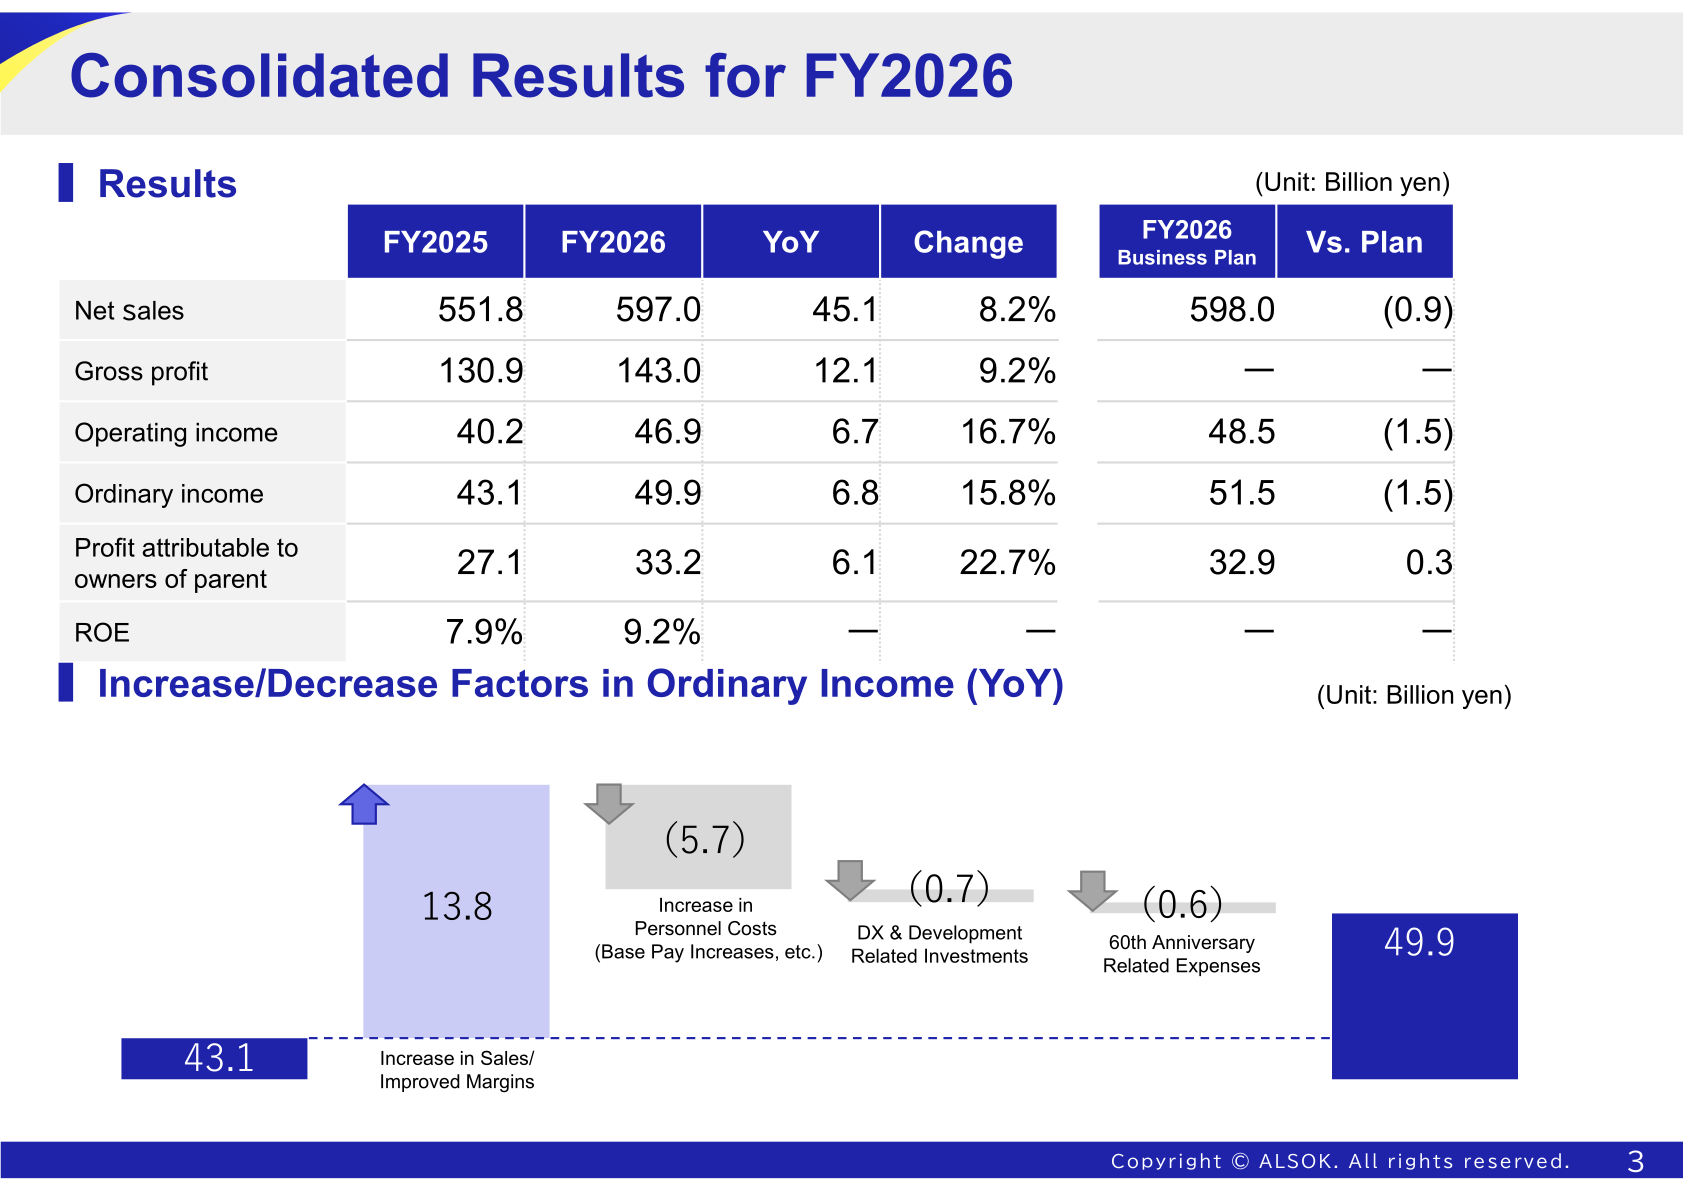
Results for FY2026 against the prior year and against the company’s own business plan are shown below. Net sales and operating income finished slightly below the business plan, while profit attributable to owners of parent came in above plan. (Unit: Billion yen)
| Item | FY2025 | FY2026 | YoY | Change | FY2026 Business Plan | Vs. Plan |
|---|---|---|---|---|---|---|
| Net sales | 551.8 | 597.0 | 45.1 | 8.2% | 598.0 | (0.9) |
| Gross profit | 130.9 | 143.0 | 12.1 | 9.2% | — | — |
| Operating income | 40.2 | 46.9 | 6.7 | 16.7% | 48.5 | (1.5) |
| Ordinary income | 43.1 | 49.9 | 6.8 | 15.8% | 51.5 | (1.5) |
| Profit attributable to owners of parent | 27.1 | 33.2 | 6.1 | 22.7% | 32.9 | 0.3 |
| ROE | 7.9% | 9.2% | — | — | — | — |
The company bridges ordinary income from 43.1 billion yen to 49.9 billion yen with an increase of 13.8 billion yen from an increase in sales and improved margins, offset by (5.7) billion yen from an increase in personnel costs (base pay increases, etc.), (0.7) billion yen from DX and development related investments, and (0.6) billion yen of 60th anniversary related expenses.
Segment Results
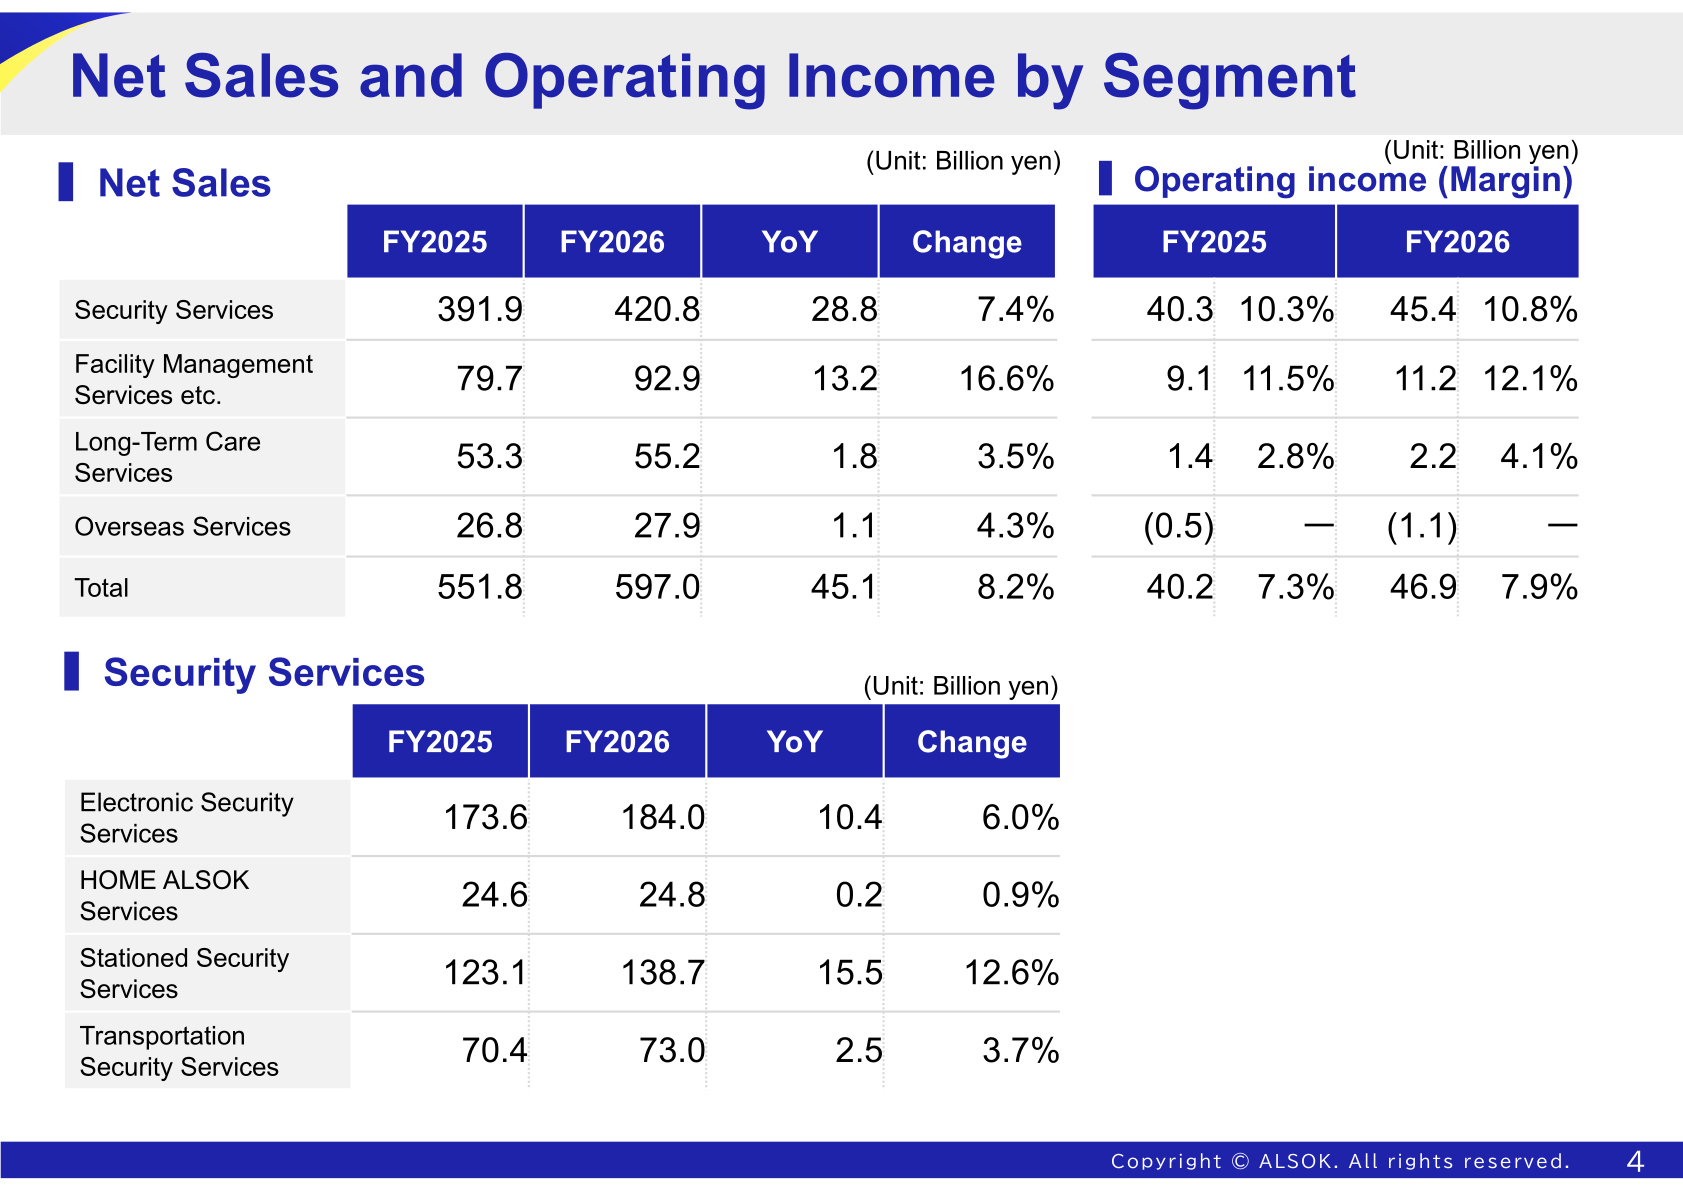
All four reporting segments grew net sales. Security Services, the largest segment, grew 7.4% with an operating income margin of 10.8%. Facility Management Services etc. was the fastest-growing segment at 16.6%, and Long-Term Care Services lifted its operating income margin to 4.1% from 2.8%. Overseas Services remained loss-making at the operating income level. (Unit: Billion yen)
| Segment | Net sales FY2025 | Net sales FY2026 | Change | Operating income FY2025 (margin) | Operating income FY2026 (margin) |
|---|---|---|---|---|---|
| Security Services | 391.9 | 420.8 | 7.4% | 40.3 (10.3%) | 45.4 (10.8%) |
| Facility Management Services etc. | 79.7 | 92.9 | 16.6% | 9.1 (11.5%) | 11.2 (12.1%) |
| Long-Term Care Services | 53.3 | 55.2 | 3.5% | 1.4 (2.8%) | 2.2 (4.1%) |
| Overseas Services | 26.8 | 27.9 | 4.3% | (0.5) — | (1.1) — |
| Total | 551.8 | 597.0 | 8.2% | 40.2 (7.3%) | 46.9 (7.9%) |
Within Security Services, Stationed Security Services delivered the largest gain, and the company discloses the following net sales breakdown. (Unit: Billion yen)
| Security Services (net sales) | FY2025 | FY2026 | YoY | Change |
|---|---|---|---|---|
| Electronic Security Services | 173.6 | 184.0 | 10.4 | 6.0% |
| HOME ALSOK Services | 24.6 | 24.8 | 0.2 | 0.9% |
| Stationed Security Services | 123.1 | 138.7 | 15.5 | 12.6% |
| Transportation Security Services | 70.4 | 73.0 | 2.5 | 3.7% |
Contract volumes continued to build. The number of long-term contracts for Electronic Security Services (for corporate customers) reached 600 thousand at FY2026 from 591 thousand, and HOME ALSOK Services (for individual customers) reached 536 thousand from 521 thousand. Long-term contracts for Stationed Security Services rose to 4,556 from 4,376. In Transportation Security Services, Cash Deposit and Dispenser Machine On-line System units rose to 32,166 from 30,793 and ATMs under the company’s management rose to 75,142 from 74,116. Facility Management Services etc. long-term contracts rose to 138 thousand from 130 thousand, and the number of Long-Term Care Service facilities rose to 212 from 209.
FY2027 Forecast
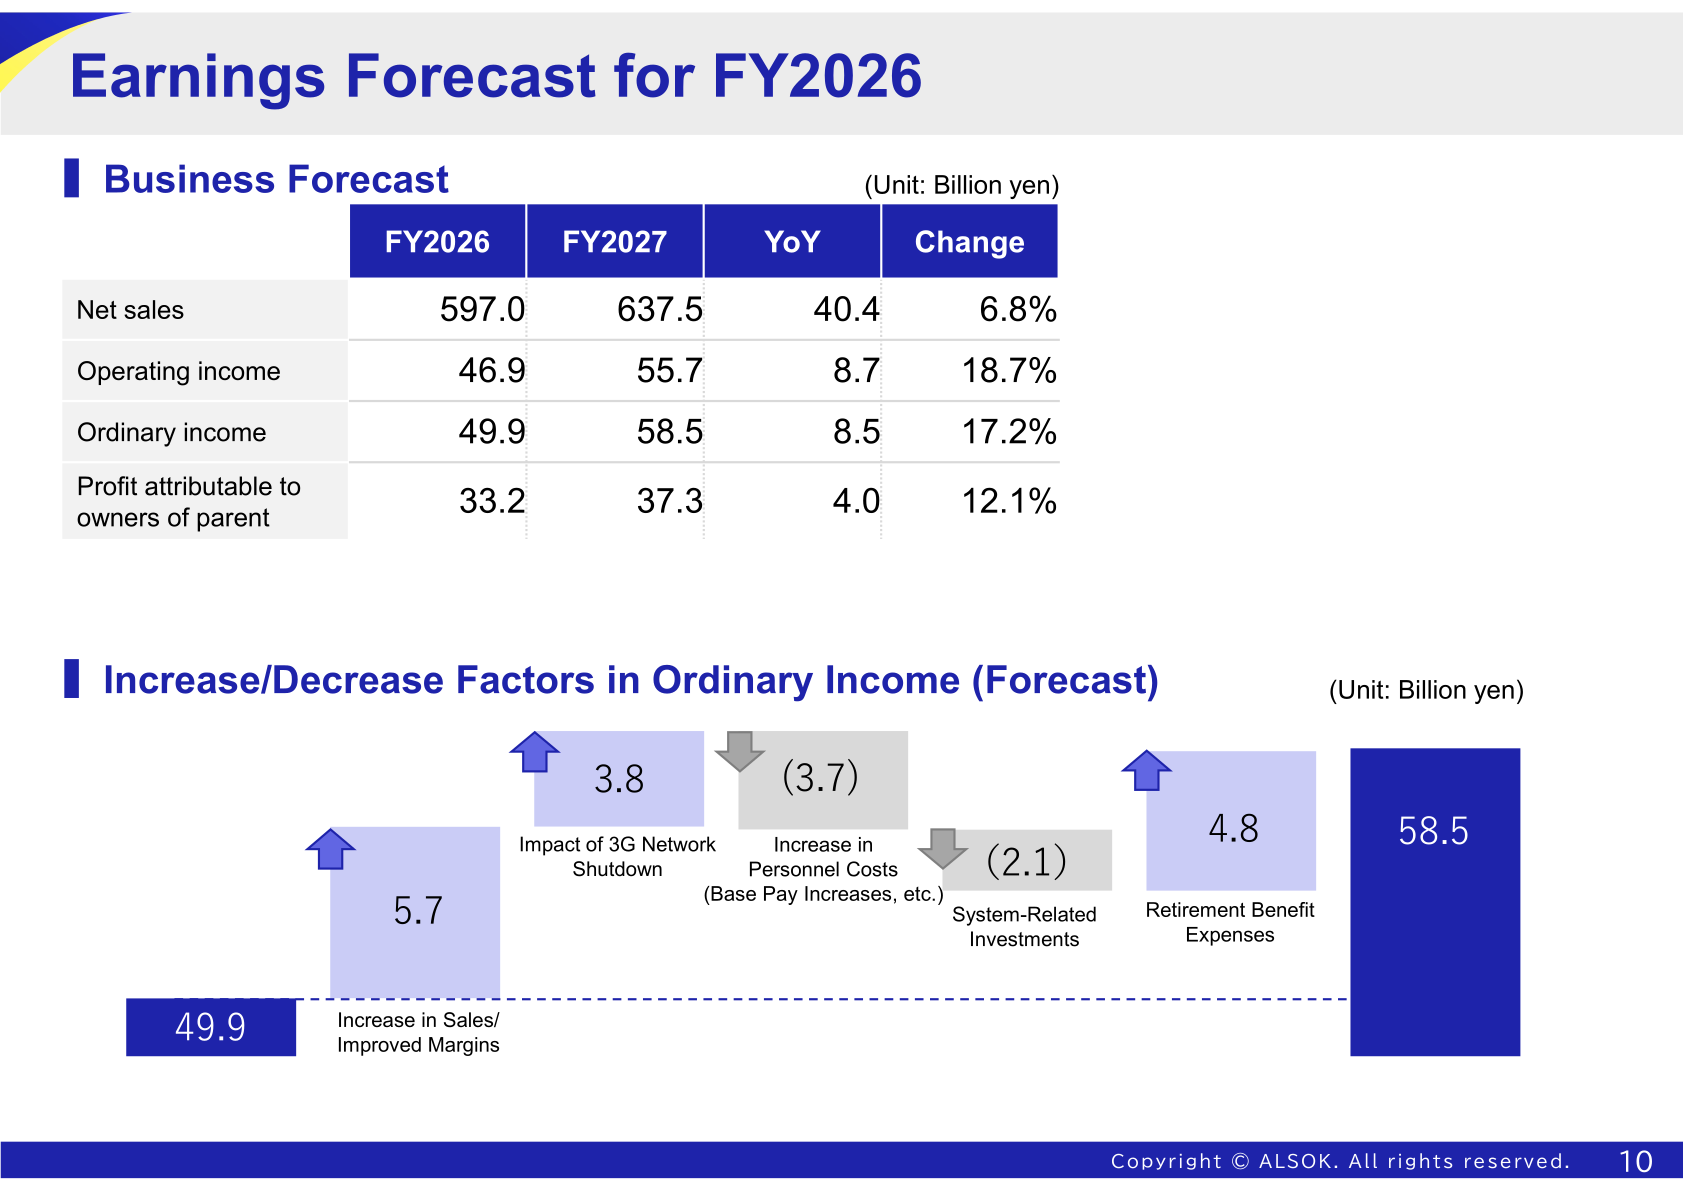
The company forecasts a fourth consecutive year of higher net sales and profits. (Unit: Billion yen)
| Item | FY2026 (Actual) | FY2027 (Forecast) | YoY | Change |
|---|---|---|---|---|
| Net sales | 597.0 | 637.5 | 40.4 | 6.8% |
| Operating income | 46.9 | 55.7 | 8.7 | 18.7% |
| Ordinary income | 49.9 | 58.5 | 8.5 | 17.2% |
| Profit attributable to owners of parent | 33.2 | 37.3 | 4.0 | 12.1% |
The forecast bridge for ordinary income from 49.9 billion yen to 58.5 billion yen comprises 5.7 billion yen from an increase in sales and improved margins, 3.8 billion yen from the impact of the 3G network shutdown and 4.8 billion yen from retirement benefit expenses, less (3.7) billion yen from an increase in personnel costs (base pay increases, etc.) and (2.1) billion yen from system-related investments.
Shareholder Returns
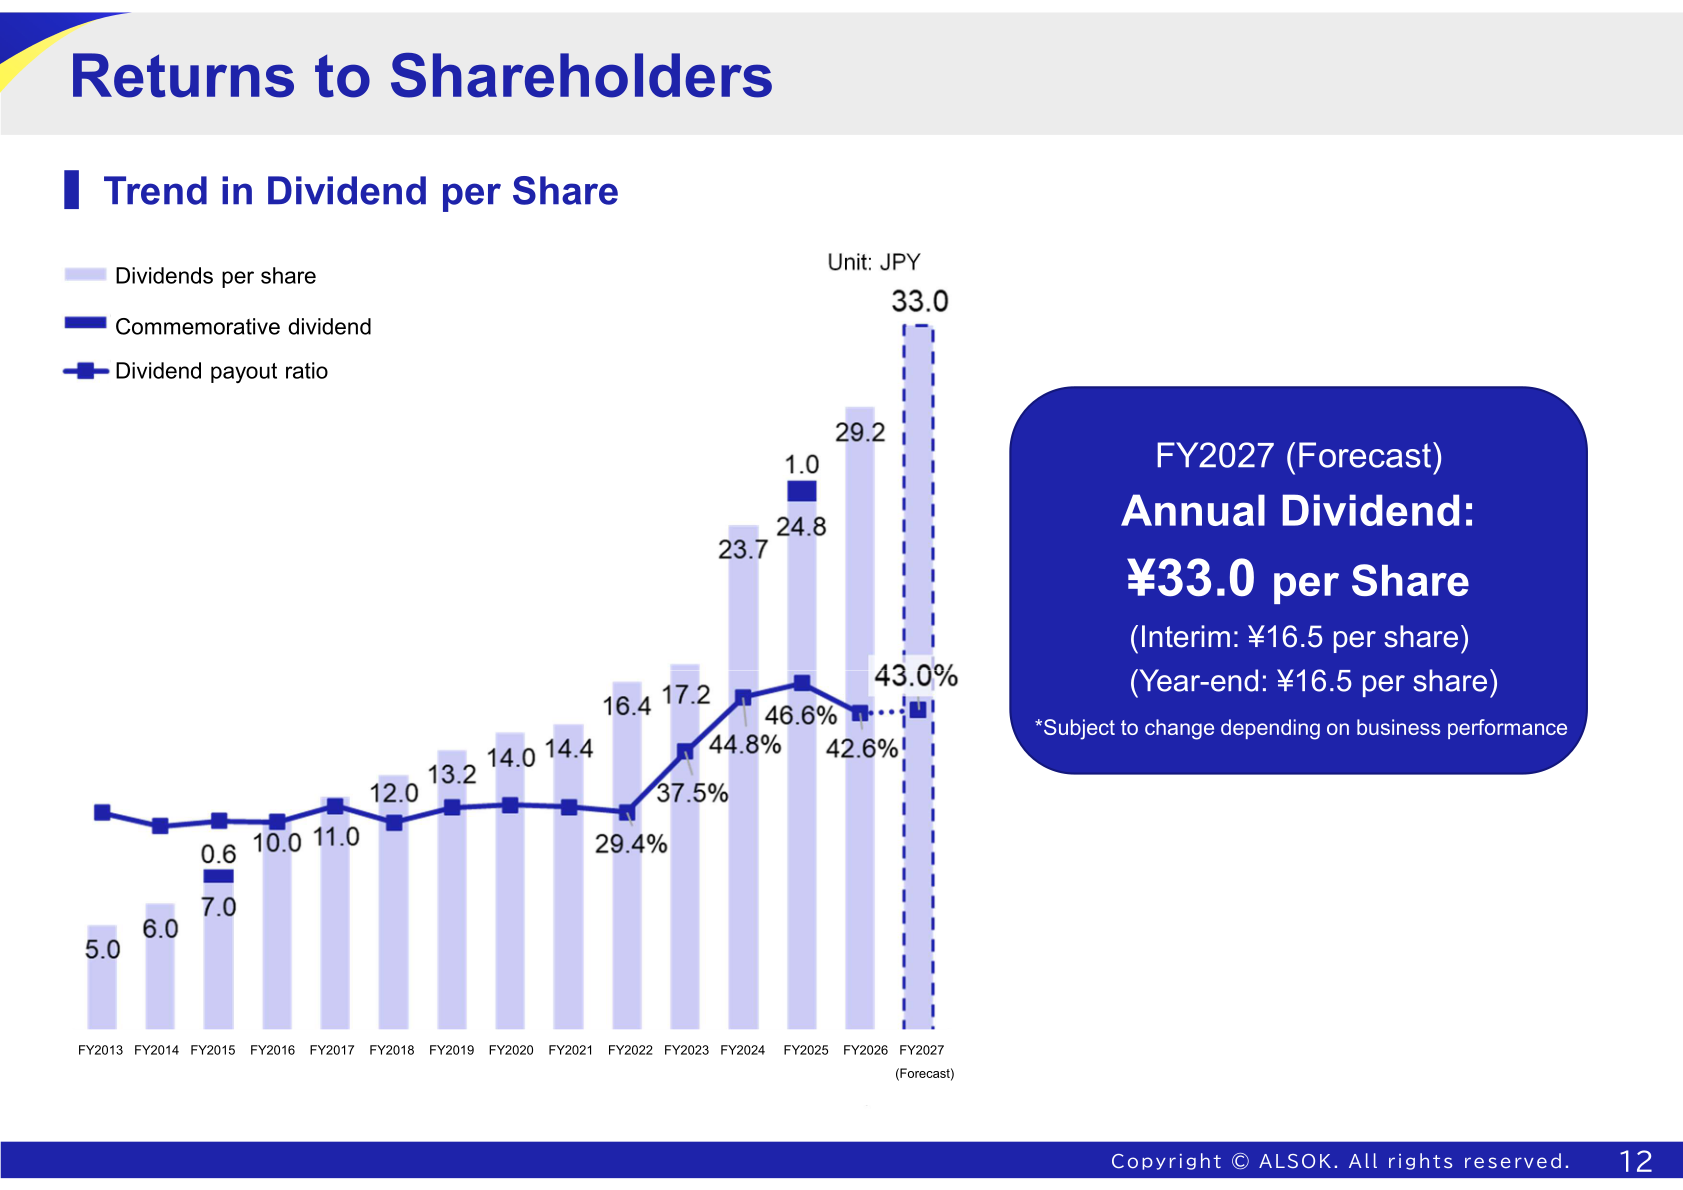
The FY2026 year-end dividend is ¥14.6 per share, with a dividend payout ratio of 42.6%. For FY2027 the company forecasts an annual dividend of ¥33.0 per share (interim ¥16.5 per share, year-end ¥16.5 per share) for a payout ratio of 43.0%, noting that this is subject to change depending on business performance. Dividends per share shown in the company’s trend chart are as follows; a commemorative dividend of ¥1.0 is shown separately for FY2025. (Unit: JPY)
| Fiscal year | Dividends per share | Dividend payout ratio |
|---|---|---|
| FY2023 | 17.2 | 37.5% |
| FY2024 | 23.7 | 44.8% |
| FY2025 | 24.8 | 46.6% |
| FY2026 | 29.2 | 42.6% |
| FY2027 (Forecast) | 33.0 | 43.0% |
Financial Position and Cash Flows
Total assets increased 102.6 billion yen to 675.0 billion yen, with current assets up 41.1 billion yen to 297.8 billion yen and non-current assets up 61.4 billion yen to 377.1 billion yen. Total liabilities increased 51.6 billion yen to 248.0 billion yen and total net assets increased 50.9 billion yen to 426.9 billion yen, of which shareholders’ equity was 330.8 billion yen. Net cash provided by operating activities rose 26.1% to 53.7 billion yen, while net cash used in investing activities widened to (39.2) billion yen from (15.5) billion yen, leaving free cash flow of 14.5 billion yen versus 27.0 billion yen a year earlier. Cash and cash equivalents at end of period were 66.8 billion yen. Capital expenditures rose 119.0% to 39.8 billion yen against depreciation of 21.3 billion yen. (Unit: Billion yen)
Sales by Customer Segment
By customer type, net sales to Corporations were 377.3 billion yen versus 345.2 billion yen, Financial Institutions 99.4 billion yen versus 92.4 billion yen, the Public Sector 41.5 billion yen versus 38.5 billion yen, and Individuals 78.6 billion yen versus 75.6 billion yen. The company describes this as a well-balanced customer base not concentrated in any specific industry.
Group Initiatives and Medium-Term Plan
FY2026 initiatives centred on rebranding and price increases. The company name became ALSOK CO., LTD. and the brand slogan is “ALwayS OK”. On pricing, the materials set out a chain running from increases in labour and raw material costs, through internal efforts for efficiency and cost reduction, to price increases covering costs not absorbable through internal efforts, funding continued provision of high-quality services via partner support, DX and other investments, and enhanced employee engagement. The company also states that its recurring income is approximately 77.3% of the total and that the contract renewal rate is approximately 95% based on FY2026 results of Electronic Security Services and HOME ALSOK Services.
ALSOK announced a briefing on its new Medium-Term Management Plan “ALSOK STAGE 2028”, covering FY2027 to FY2029, to be held on May 18, 2026 from 5:00 p.m. to 6:00 p.m. in a hybrid format at ALSOK Headquarters and streamed online via Zoom. The contents of that plan cannot be confirmed from these materials.
This article is an analysis based on publicly available information and is not a recommendation to buy or sell any specific securities. Investment decisions are your own responsibility.
![[Obayashi] Investors’ Guide 2026 — The Complete 24-Article Breakdown](https://japan-equity.com/wp-content/uploads/2026/07/hub_cover-1024x1024.png)
![[Obayashi] IR & SR Policy — Feeding Dialogue Back into Management](https://japan-equity.com/wp-content/uploads/2026/07/p32_sq-1024x1024.jpg)
![[Obayashi] Domestic Civil Engineering — Resilience Spending Supports 9.6% Margin](https://japan-equity.com/wp-content/uploads/2026/07/p11_sq-1024x1024.jpg)
![[Obayashi] Overseas Construction — Orders Reach ¥1.2tn](https://japan-equity.com/wp-content/uploads/2026/07/p15_sq-1024x1024.jpg)
![[Obayashi] Share Price & External Ratings — vs TOPIX, ESG Index Inclusion](https://japan-equity.com/wp-content/uploads/2026/07/p40_sq-1024x1024.jpg)
![[Construction] ¥75.5tn Investment, Shrinking Workforce — Big-5 Market Share](https://japan-equity.com/wp-content/uploads/2026/07/p12_sq-1024x1024.jpg)



![[Obayashi] Capital Policy & Shareholder Returns — ROE 10%+, DOE ~5%, ¥100bn Buyback](https://japan-equity.com/wp-content/uploads/2026/07/p27_sq-1024x1024.jpg)
![[Obayashi] Reducing Cross-Shareholdings — ¥285.2bn Sold in Five Years](https://japan-equity.com/wp-content/uploads/2026/07/p29_sq-1024x1024.jpg)
![[Obayashi] ¥750bn Investment Plan — ¥300bn to Development, ¥190bn to Tech/DX](https://japan-equity.com/wp-content/uploads/2026/07/p30_sq-1024x1024.jpg)
![[Obayashi] MTP2022 KPIs — Operating Profit ~2x Target, ROE 14.4%](https://japan-equity.com/wp-content/uploads/2026/07/p25_sq-1024x1024.jpg)
![[Obayashi] Cash Allocation — ¥420bn Investment CF Over Five Years](https://japan-equity.com/wp-content/uploads/2026/07/p26_sq-1024x1024.jpg)
![[Obayashi] Green Energy — 44 Plants, 344MW, and the Green Hydrogen Challenge](https://japan-equity.com/wp-content/uploads/2026/07/p21_sq-1024x1024.jpg)
![[Obayashi] Tackling the Labor Shortage — Robotics Construction®](https://japan-equity.com/wp-content/uploads/2026/07/p14_sq-1024x1024.jpg)
