
This article is based on publicly available IR materials and is not a recommendation to buy or sell any specific securities.
Note: NH Foods does not publish an English results presentation; this article is based on the company’s Japanese-language results presentation, with figures transcribed as reported. The presentation covers the fiscal year ended March 31, 2026, which the company labels “FY2026/3” and which this site classifies as FY2025; period labels in the text, tables and segment data below follow the company’s own notation. The presentation states amounts in units of 100 million yen, which are rendered here in billions of yen without changing any reported digit (the printed figure 14,574 for net sales, for example, is shown as 1,457.4 billion yen); the pages presenting the statement of income, balance sheet, cash flows and capital expenditure are stated in millions of yen and are quoted in those units. NH Foods applies IFRS, and defines business profit as net sales less cost of goods sold and selling, general and administrative expenses, adjusted for foreign exchange gains and losses determined by the Group and excluding IFRS adjustments and non-recurring items. The company notes that figures may not sum to totals because of rounding.
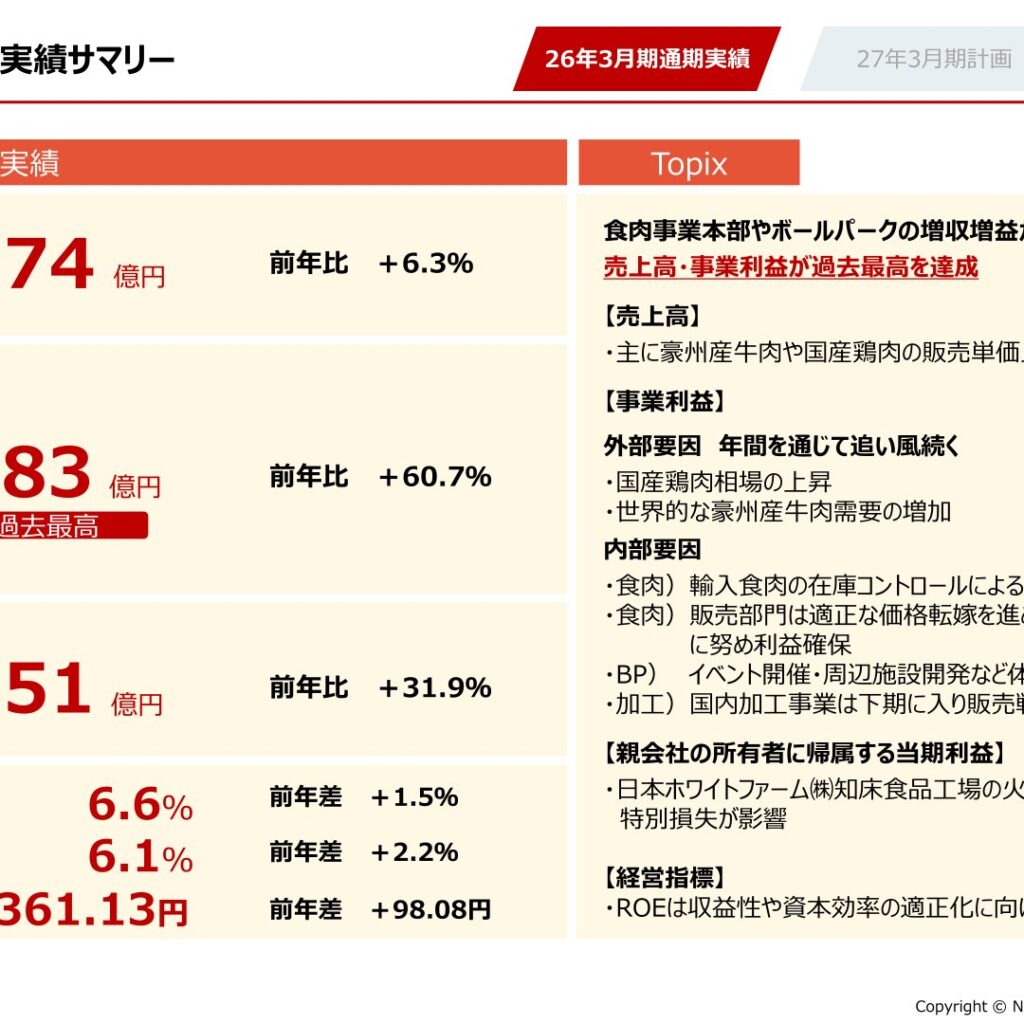
NH Foods Ltd. reported record-high net sales and business profit for FY2026/3. Net sales rose 6.3% year on year to 1,457.4 billion yen and business profit jumped 60.7% to 68.3 billion yen, with the company stating that higher sales and profit at the Fresh Meats Business Division and the Ballpark Business drove group growth. Profit attributable to owners of the parent increased 31.9% to 35.1 billion yen, after an extraordinary loss of about 6.5 billion yen related to a fire at the Shiretoko Plant of Nippon White Farm Co., Ltd. For FY2027/3 the company plans net sales of 1,500.0 billion yen with business profit declining 10.7% to 61.0 billion yen, while profit attributable to owners of the parent is planned to rise 8.4% to 38.0 billion yen.
Consolidated Results (Full-Year Actual)
For the full year, net sales increased 86.8 billion yen year on year to 1,457.4 billion yen and business profit increased 25.8 billion yen to 68.3 billion yen, lifting the business profit ratio to 4.7% from 3.1%. Profit before tax rose 46.6% to 54.5 billion yen and profit attributable to owners of the parent rose 31.9% to 35.1 billion yen. ROE improved 1.5 points to 6.6% and ROIC improved 2.2 points to 6.1%, while earnings per share rose 98.08 yen to 361.13 yen. On net sales, the company cites higher selling prices for Australian beef and domestic chicken. On business profit, it lists external tailwinds that persisted through the year — rising domestic chicken market prices and increasing global demand for Australian beef — alongside internal factors including appropriate profit creation through inventory control of imported fresh meats, price pass-through while maintaining sales volume at the sales divisions, further improvement in the experience value offered at the ball park, and a return to profit growth in the domestic processed foods business in the second half as its sales strategy took effect.
| Item | FY2026/3 (Actual) | FY2025/3 (Actual) | Variance (%) |
|---|---|---|---|
| Net sales (¥ billion) | 1,457.4 | 1,370.6 | 6.3% |
| Business profit (¥ billion) | 68.3 | 42.5 | 60.7% |
| Business profit ratio | 4.7% | 3.1% | – |
| Profit before tax (¥ billion) | 54.5 | 37.2 | 46.6% |
| Profit attributable to owners of the parent (¥ billion) | 35.1 | 26.6 | 31.9% |
| ROE | 6.6% | 5.1% | – |
| ROIC | 6.1% | 3.9% | – |
| EPS (yen) | 361.13 | 263.05 | – |
In the consolidated statement of income presented in millions of yen, net sales were 1,457,391 million yen (up 86,838 million yen, 6.3%), gross profit was 250,584 million yen (up 30,201 million yen, 13.7%) for a gross margin of 17.2%, selling, general and administrative expenses were 192,984 million yen (up 8,535 million yen, 4.6%) and operating profit was 57,600 million yen (up 21,666 million yen, 60.3%). Profit before tax was 54,545 million yen and profit attributable to owners of the parent was 35,066 million yen. Business profit of 68,342 million yen is derived from operating profit plus foreign exchange gains of 5,963 million yen and IFRS adjustments and other items of 4,779 million yen. Other income and expenses of minus 1,481 million yen include impairment losses on fixed assets of about 1.8 billion yen associated with structural reforms in addition to the approximately 6.5 billion yen extraordinary loss from the Shiretoko Plant fire.
Segment Results
The Fresh Meats Business Division was the main driver, with net sales of 1,034.1 billion yen (up 8.1%) and business profit of 61.3 billion yen (up 80.5%). Within the division, domestic business sales were 863.6 billion yen (up 3.9%) and the Australia business posted sales of 170.5 billion yen (up 35.9%); domestic business profit was 46.5 billion yen (up 15.0 billion yen, 47.8%) and Australia business profit was 14.8 billion yen (up 12.3 billion yen, 494.4%), taking the divisional business profit ratio to 5.9%, an improvement of 2.4 points. The Processed Foods Business Division saw both sales and profit decline, with net sales of 530.3 billion yen (down 0.6%) and business profit of 7.2 billion yen (down 28.6%); domestic sales of 403.2 billion yen fell 2.3% on reduced low-margin items and a delayed recovery of core brands, while overseas sales of 127.1 billion yen rose 5.2% on production volumes at the acquired North American plant. Domestic business profit was 9.4 billion yen (down 12.0%) and the overseas business recorded a loss of 2.2 billion yen; the company notes the domestic business profit margin excluding one-off costs was 2.8%, up 0.3 points. The Ballpark Business grew sales 15.0% to 31.0 billion yen and business profit 61.9% to 5.4 billion yen, a business profit ratio of 17.5%, as attendance at HOKKAIDO BALLPARK F VILLAGE rose to 4,660,000 visitors from 4,320,000, including a record 2,270,000 at official professional baseball games versus 2,080,000 a year earlier.
| Segment | Net sales (¥ billion) | Net sales YoY | Business profit (¥ billion) | Business profit YoY |
|---|---|---|---|---|
| Processed Foods Business Division | 530.3 | -3.0 (-0.6%) | 7.2 | -2.9 (-28.6%) |
| Fresh Meats Business Division | 1,034.1 | 77.3 (8.1%) | 61.3 | 27.3 (80.5%) |
| Ballpark Business | 31.0 | 4.1 (15.0%) | 5.4 | 2.1 (61.9%) |
| Eliminations, Adjustments and Others | -138.1 | 8.5 | -5.6 | -0.7 |
| Consolidated | 1,457.4 | 86.8 (6.3%) | 68.3 | 25.8 (60.7%) |
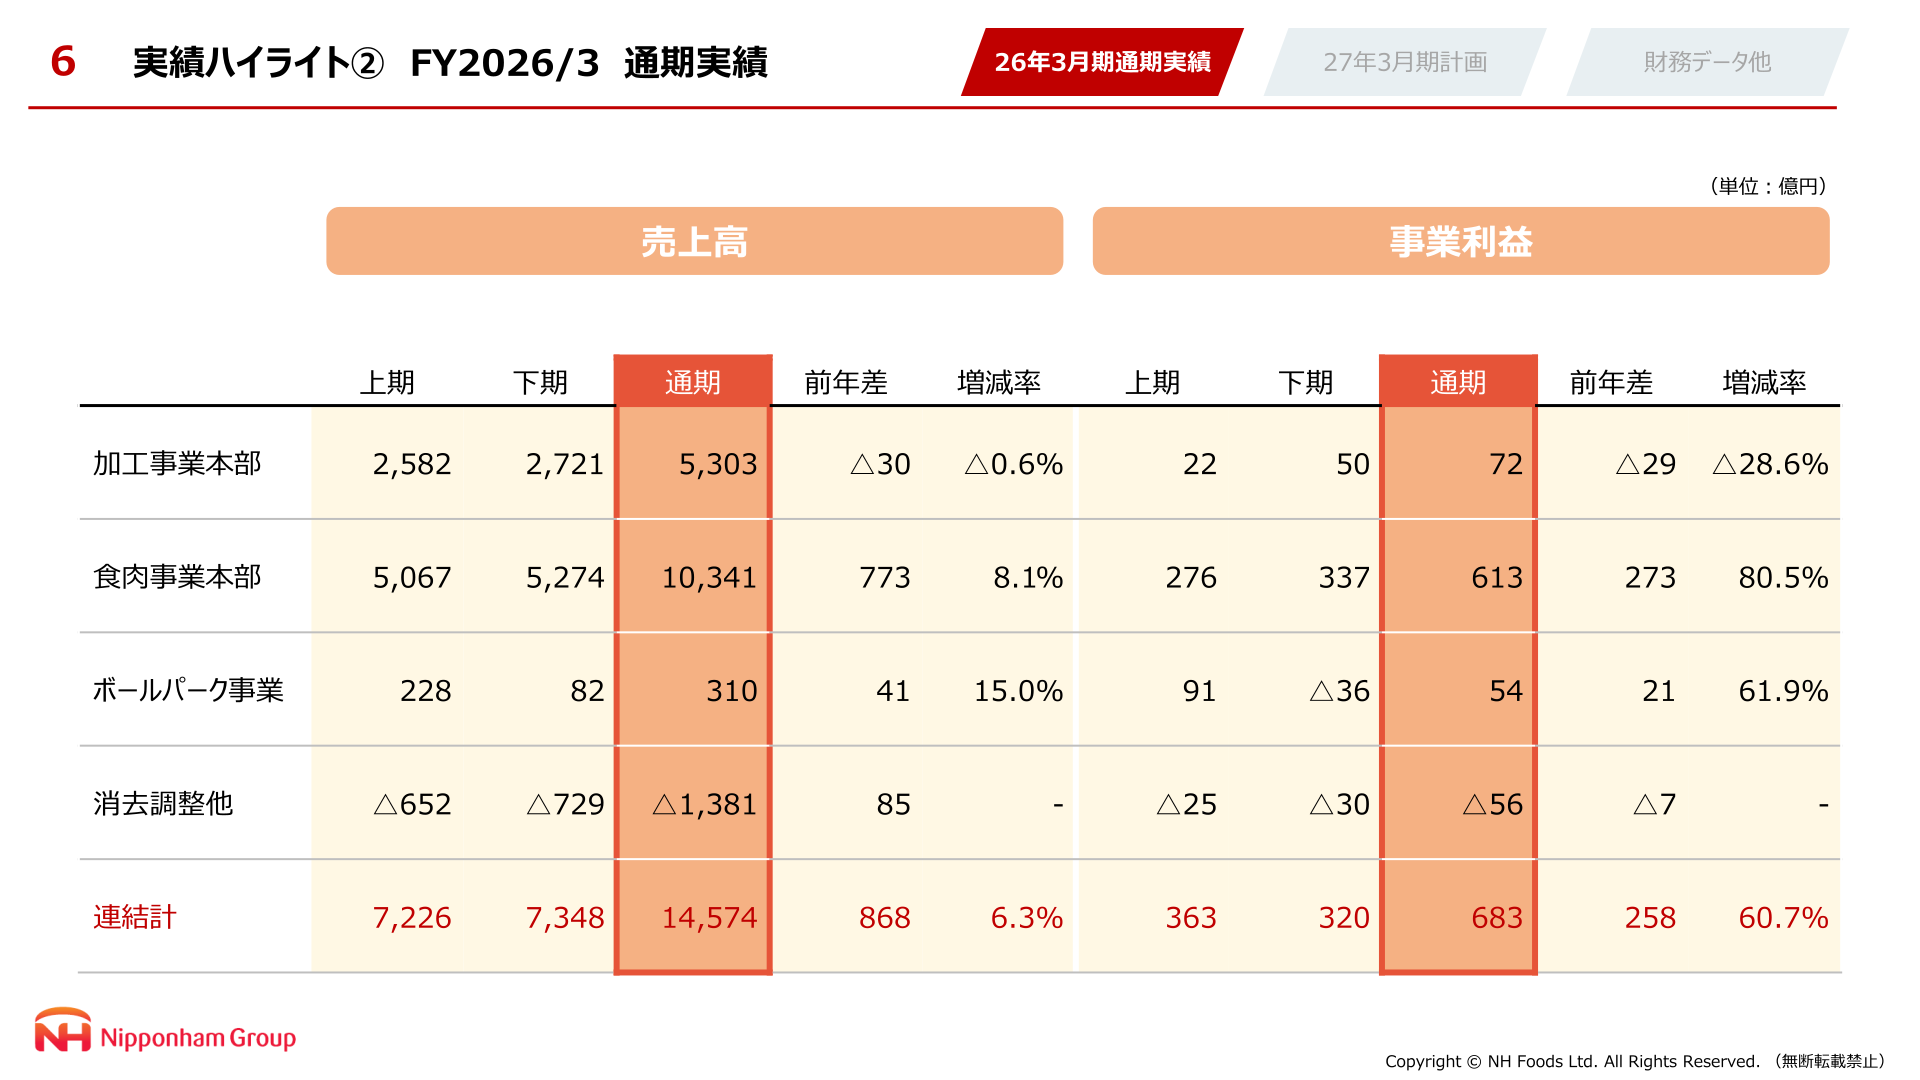
The company also breaks down the year-on-year change in group business profit from 42.5 billion yen to 68.3 billion yen: the Fresh Meats Business Division contributed 27.3 billion yen and the Ballpark Business 2.1 billion yen, while the Processed Foods Business Division subtracted 2.9 billion yen and eliminations and other items subtracted 0.7 billion yen. Within the Fresh Meats Business Division, the external environment added 11.3 billion yen and internal improvements 15.0 billion yen, Australia added 12.3 billion yen, while expenses reduced profit by 6.9 billion yen, other overseas operations by 2.8 billion yen and the fire impact by 1.3 billion yen.
FY2027/3 Full-Year Plan
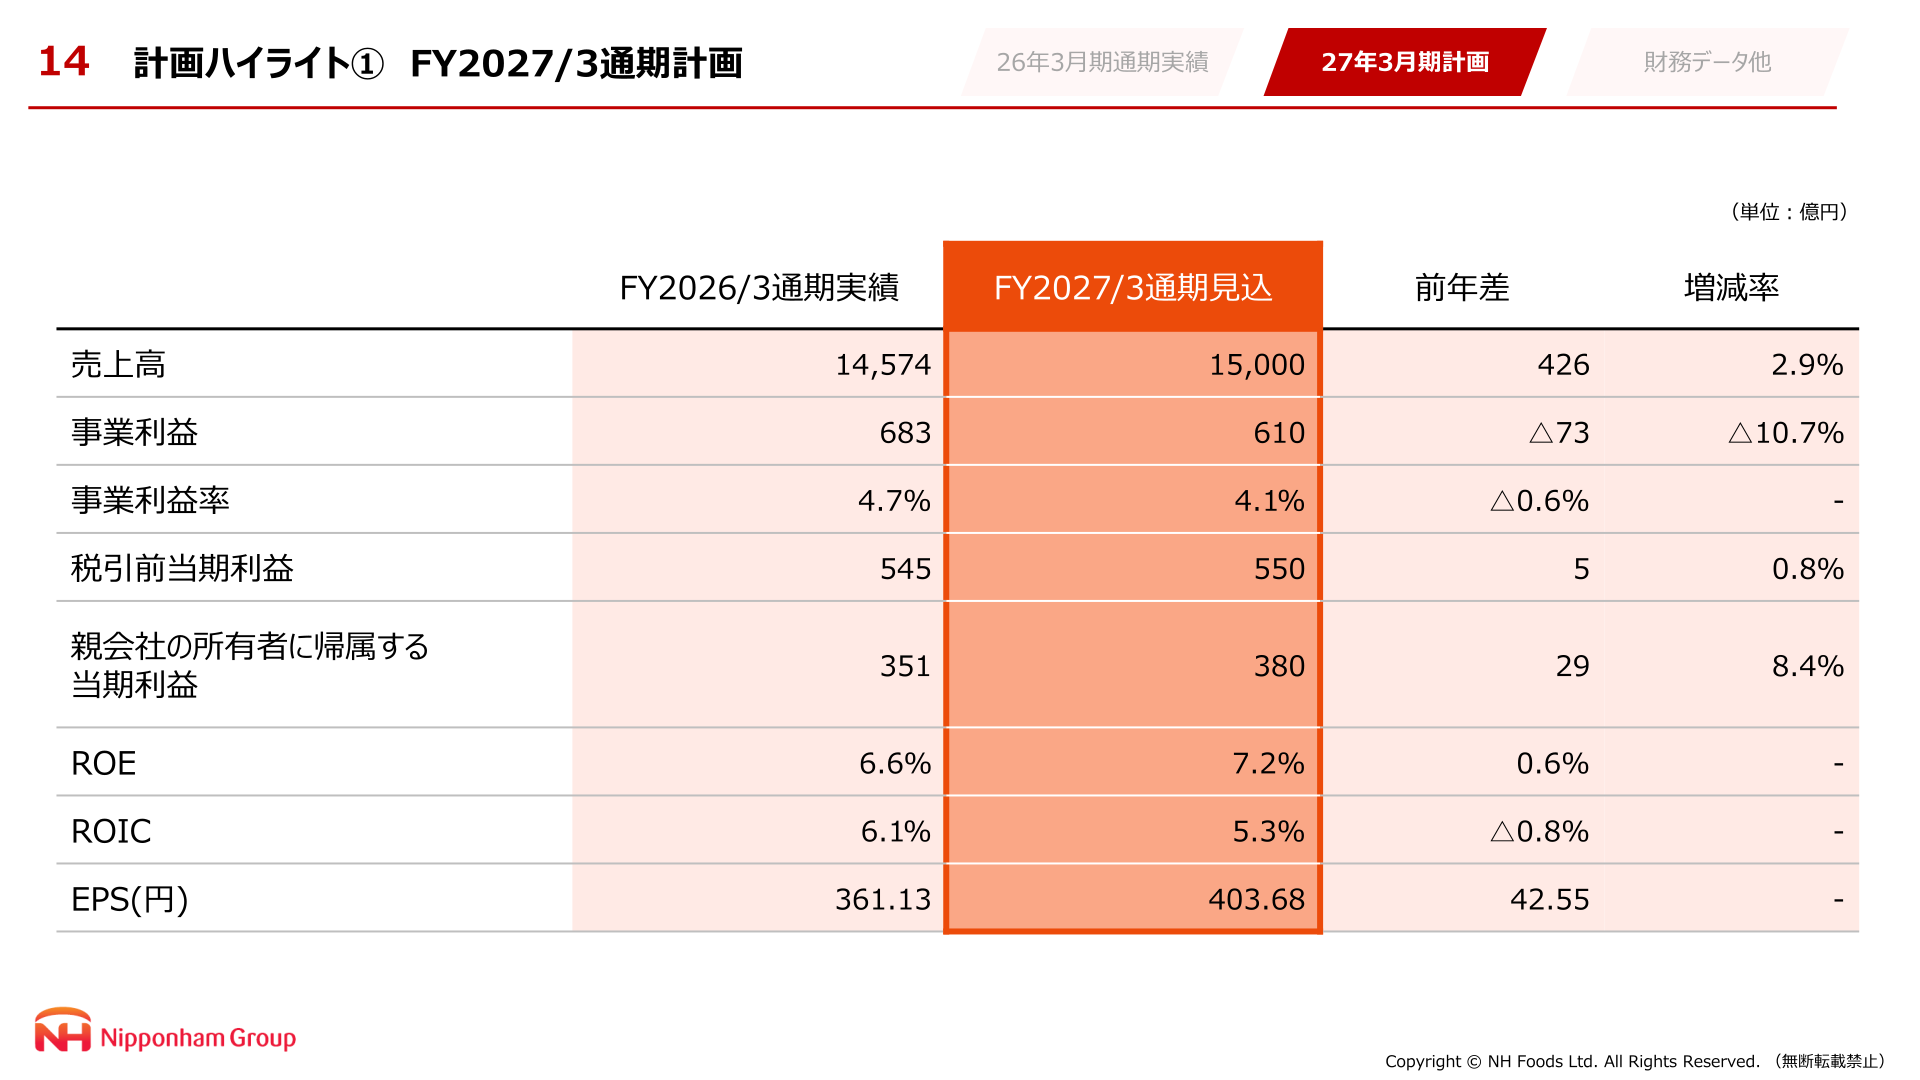
For FY2027/3 the company plans net sales of 1,500.0 billion yen, up 2.9%, on top-line growth in the processed foods business and higher selling prices for Australian beef and domestic imported fresh meats. Business profit is planned at 61.0 billion yen, down 10.7%, reflecting an expected group-wide cost increase of about 5.0 billion yen from the impact of the Middle East, higher purchase prices for Australian beef, and increased costs and expenses at the Sports & Entertainment Business Division ahead of the opening of a new railway station. Profit attributable to owners of the parent is planned to rise 8.4% to 38.0 billion yen as the prior year’s extraordinary loss does not recur. From FY2027/3 the Ballpark Business has been reorganized as the Sports & Entertainment Business Division, and the company states that the FY2026/3 figures shown on its plan pages have been retroactively restated on that basis and are unaudited internal estimates that may differ from official figures.
| Item | FY2027/3 (Plan) | FY2026/3 (Actual) | Variance (%) |
|---|---|---|---|
| Net sales (¥ billion) | 1,500.0 | 1,457.4 | 2.9% |
| Business profit (¥ billion) | 61.0 | 68.3 | -10.7% |
| Business profit ratio | 4.1% | 4.7% | – |
| Profit before tax (¥ billion) | 55.0 | 54.5 | 0.8% |
| Profit attributable to owners of the parent (¥ billion) | 38.0 | 35.1 | 8.4% |
| ROE | 7.2% | 6.6% | – |
| ROIC | 5.3% | 6.1% | – |
| EPS (yen) | 403.68 | 361.13 | – |
| Segment | FY2027/3 plan business profit (¥ billion) | FY2026/3 actual (restated) | Variance |
|---|---|---|---|
| Processed Foods Business Division | 12.0 | 7.2 | 4.8 |
| Fresh Meats Business Division | 50.0 | 61.3 | -11.3 |
| Sports & Entertainment Business Division | 4.0 | 4.9 | -0.9 |
| Eliminations, Adjustments and Others | -5.0 | -5.0 | 0 |
| Consolidated | 61.0 | 68.3 | -7.3 |
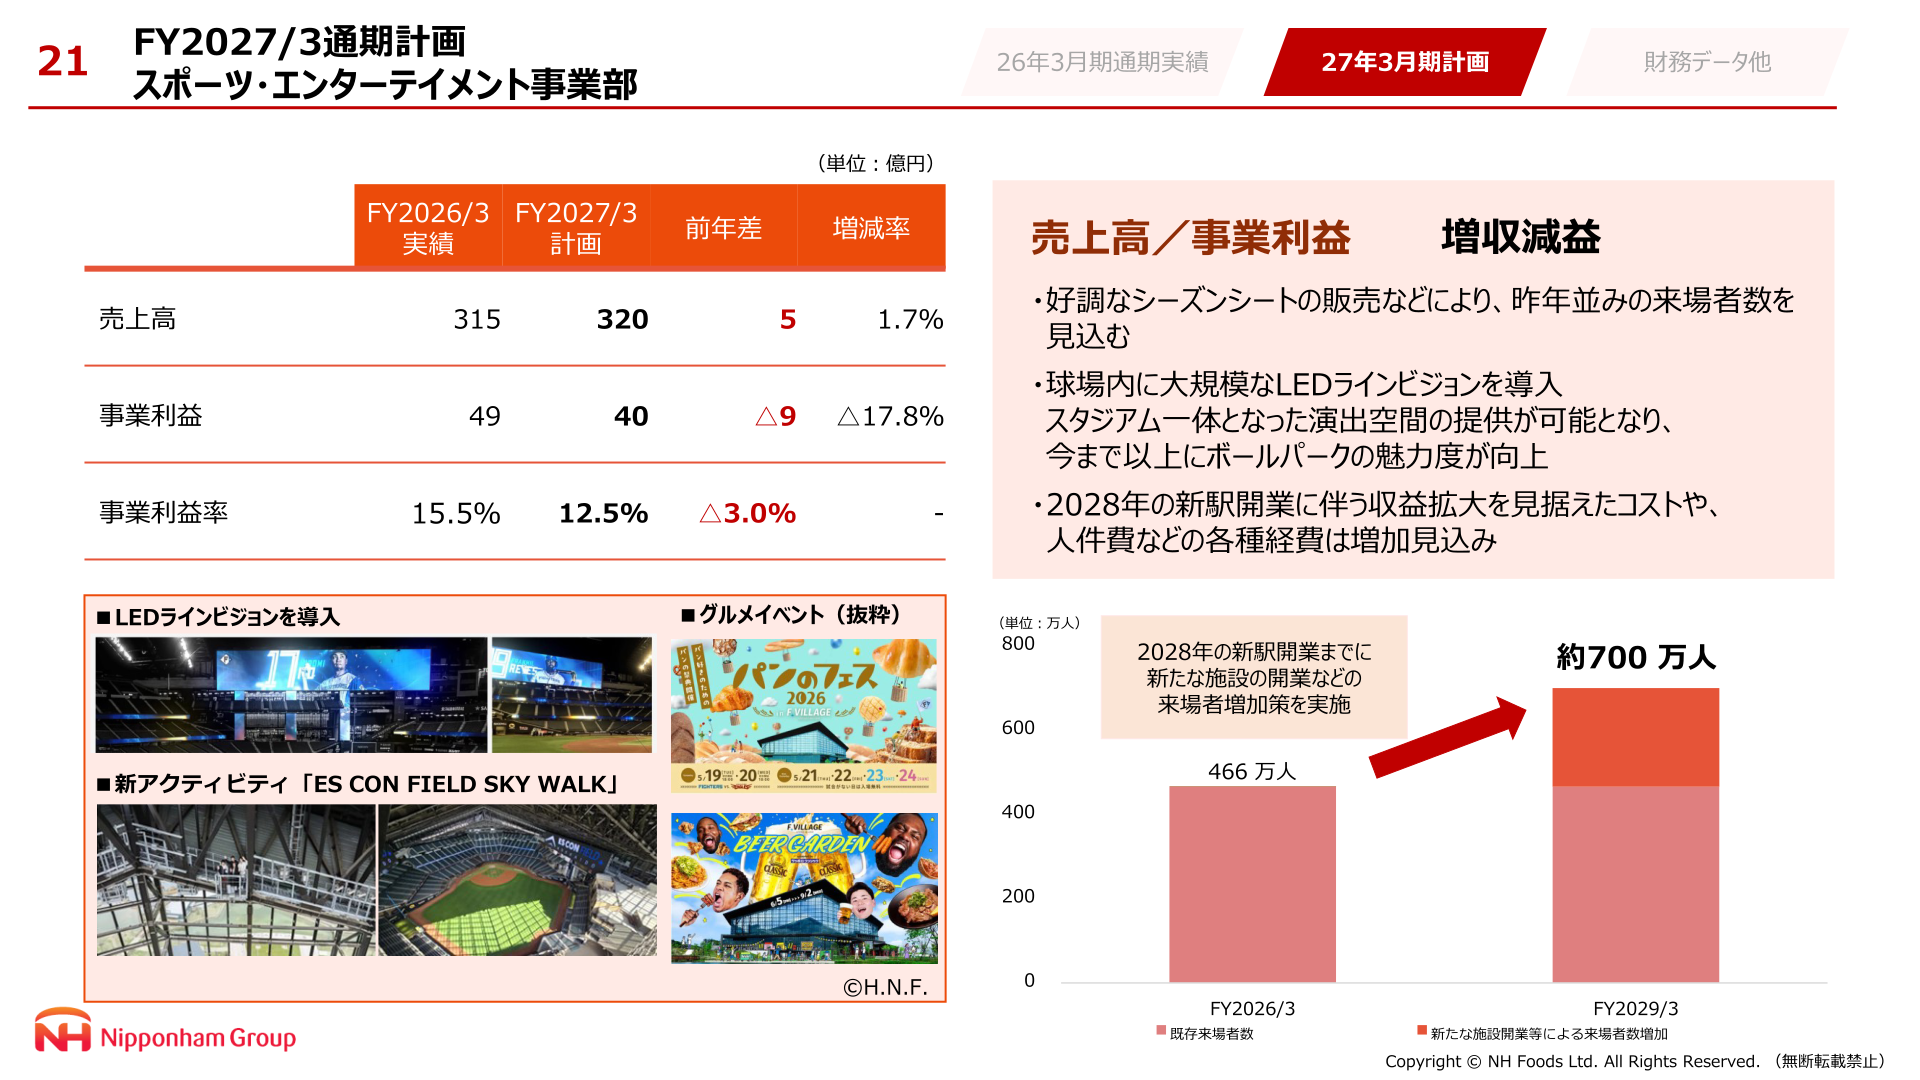
By division, the Processed Foods Business Division plans net sales of 560.0 billion yen (up 5.6%), split between domestic sales of 420.0 billion yen (up 4.2%) and overseas sales of 140.0 billion yen (up 10.1%), with business profit rising 67.2% to 12.0 billion yen as the overseas business returns to break-even from a loss of 2.2 billion yen. The Fresh Meats Business Division plans net sales of 1,045.0 billion yen (up 1.1%) but business profit down 18.4% to 50.0 billion yen, with the Australia business falling 53.1% to 7.0 billion yen on higher livestock purchase costs and lower shipments from feedlots, and the domestic business down 7.3% to 43.0 billion yen on reduced domestic chicken production volume following the Shiretoko Plant fire. The Sports & Entertainment Business Division plans net sales of 32.0 billion yen (up 1.7%) and business profit of 4.0 billion yen (down 17.8%).
Shareholder Returns
The presentation does not set out a dividend forecast or a shareholder return policy; the level of dividends per share cannot be confirmed from the materials. In the statement of cash flows, financing activities used 56,004 million yen of cash, and the company states this reflected proceeds from borrowings of 68.2 billion yen offset by repayments of borrowings of 75.3 billion yen and payments of 30.0 billion yen for the acquisition of treasury shares.
Financial Position, Cash Flows and Capital Expenditure
Total assets at the end of FY2026/3 were 997,477 million yen, up 48,205 million yen or 5.1% from a year earlier, with total liabilities of 445,785 million yen (up 8.1%) and total equity of 551,692 million yen (up 2.7%); the debt-to-equity ratio was 0.43, unchanged from the previous year-end. Cash flows from operating activities were 82,344 million yen (up 6.3%), investing activities used 34,044 million yen and financing activities used 56,004 million yen. Capital expenditure totalled 33,348 million yen, down 1,025 million yen or 3.0%, while depreciation and amortisation rose 10.0% to 30,869 million yen. For FY2027/3 the company plans capital expenditure of 60,000 million yen — including 17,200 million yen for the Processed Foods Business Division, 30,000 million yen for the Fresh Meats Business Division and 7,400 million yen for the Sports & Entertainment Business Division — and depreciation and amortisation of 32,000 million yen.
Topics
At HOKKAIDO BALLPARK F VILLAGE, the company held events outside the baseball season and reported continued growth in visitor numbers; for FY2027/3 it expects visitor numbers on a par with the previous year, supported by strong season-seat sales, and has installed a large LED line vision display in the stadium. Looking further out, the company shows a plan to raise annual visitors from 4,660,000 in FY2026/3 to approximately 7,000,000 in FY2029/3 through new facility openings ahead of the new railway station scheduled to open in 2028.
This article is an analysis based on publicly available information and is not a recommendation to buy or sell any specific securities. Investment decisions are your own responsibility.
![[Obayashi] Investors’ Guide 2026 — The Complete 24-Article Breakdown](https://japan-equity.com/wp-content/uploads/2026/07/hub_cover-1024x1024.png)
![[Obayashi] IR & SR Policy — Feeding Dialogue Back into Management](https://japan-equity.com/wp-content/uploads/2026/07/p32_sq-1024x1024.jpg)
![[Obayashi] Real Estate Development — 18.7% Margin, ¥287.7bn Unrealized Gains](https://japan-equity.com/wp-content/uploads/2026/07/p20_sq-1024x1024.jpg)
![[Obayashi] Domestic Civil Engineering — Resilience Spending Supports 9.6% Margin](https://japan-equity.com/wp-content/uploads/2026/07/p11_sq-1024x1024.jpg)
![[Obayashi] Share Price & External Ratings — vs TOPIX, ESG Index Inclusion](https://japan-equity.com/wp-content/uploads/2026/07/p40_sq-1024x1024.jpg)
![[Construction] ¥75.5tn Investment, Shrinking Workforce — Big-5 Market Share](https://japan-equity.com/wp-content/uploads/2026/07/p12_sq-1024x1024.jpg)



![[Obayashi] Capital Policy & Shareholder Returns — ROE 10%+, DOE ~5%, ¥100bn Buyback](https://japan-equity.com/wp-content/uploads/2026/07/p27_sq-1024x1024.jpg)
![[Obayashi] Reducing Cross-Shareholdings — ¥285.2bn Sold in Five Years](https://japan-equity.com/wp-content/uploads/2026/07/p29_sq-1024x1024.jpg)
![[Obayashi] ¥750bn Investment Plan — ¥300bn to Development, ¥190bn to Tech/DX](https://japan-equity.com/wp-content/uploads/2026/07/p30_sq-1024x1024.jpg)
![[Obayashi] MTP2022 KPIs — Operating Profit ~2x Target, ROE 14.4%](https://japan-equity.com/wp-content/uploads/2026/07/p25_sq-1024x1024.jpg)
![[Obayashi] Cash Allocation — ¥420bn Investment CF Over Five Years](https://japan-equity.com/wp-content/uploads/2026/07/p26_sq-1024x1024.jpg)
![[Obayashi] Green Energy — 44 Plants, 344MW, and the Green Hydrogen Challenge](https://japan-equity.com/wp-content/uploads/2026/07/p21_sq-1024x1024.jpg)
![[Obayashi] Tackling the Labor Shortage — Robotics Construction®](https://japan-equity.com/wp-content/uploads/2026/07/p14_sq-1024x1024.jpg)
