
This article is based on publicly available IR materials and is not a recommendation to buy or sell any specific securities.
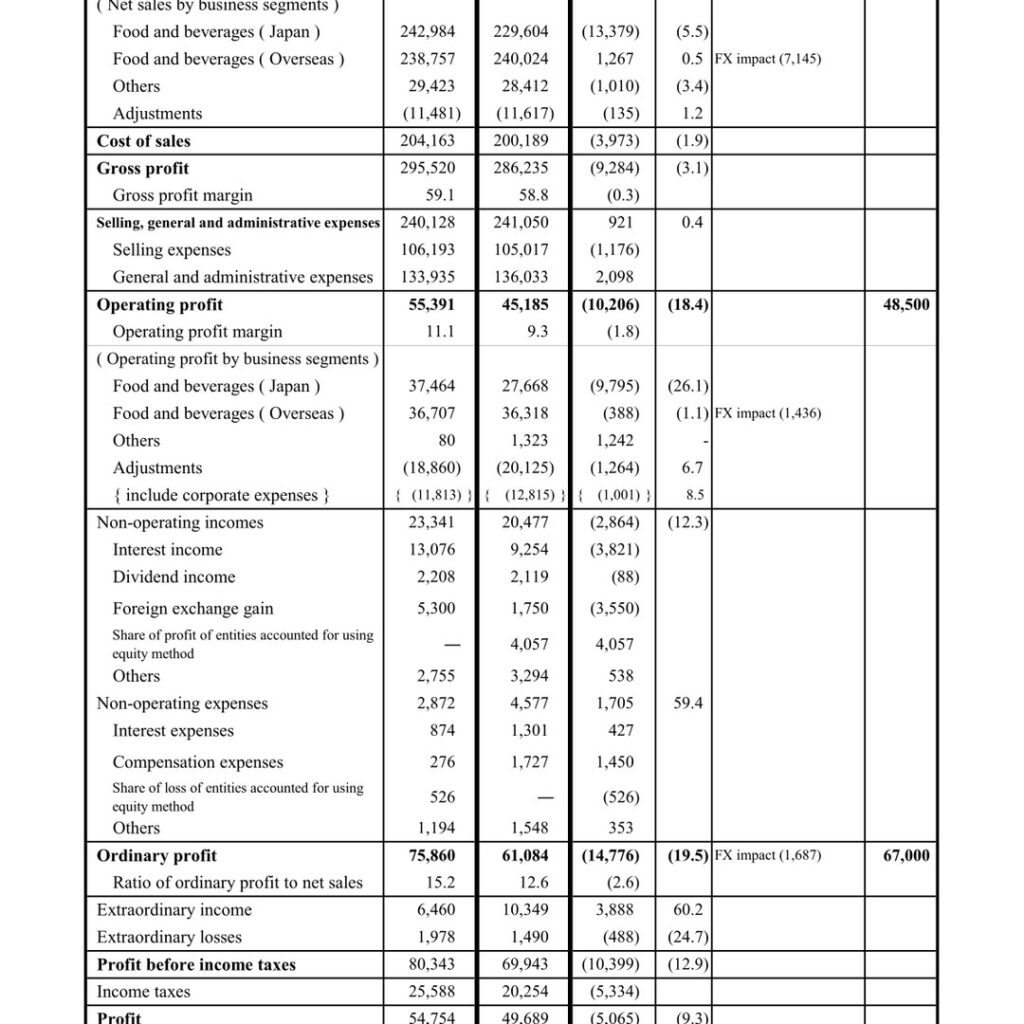
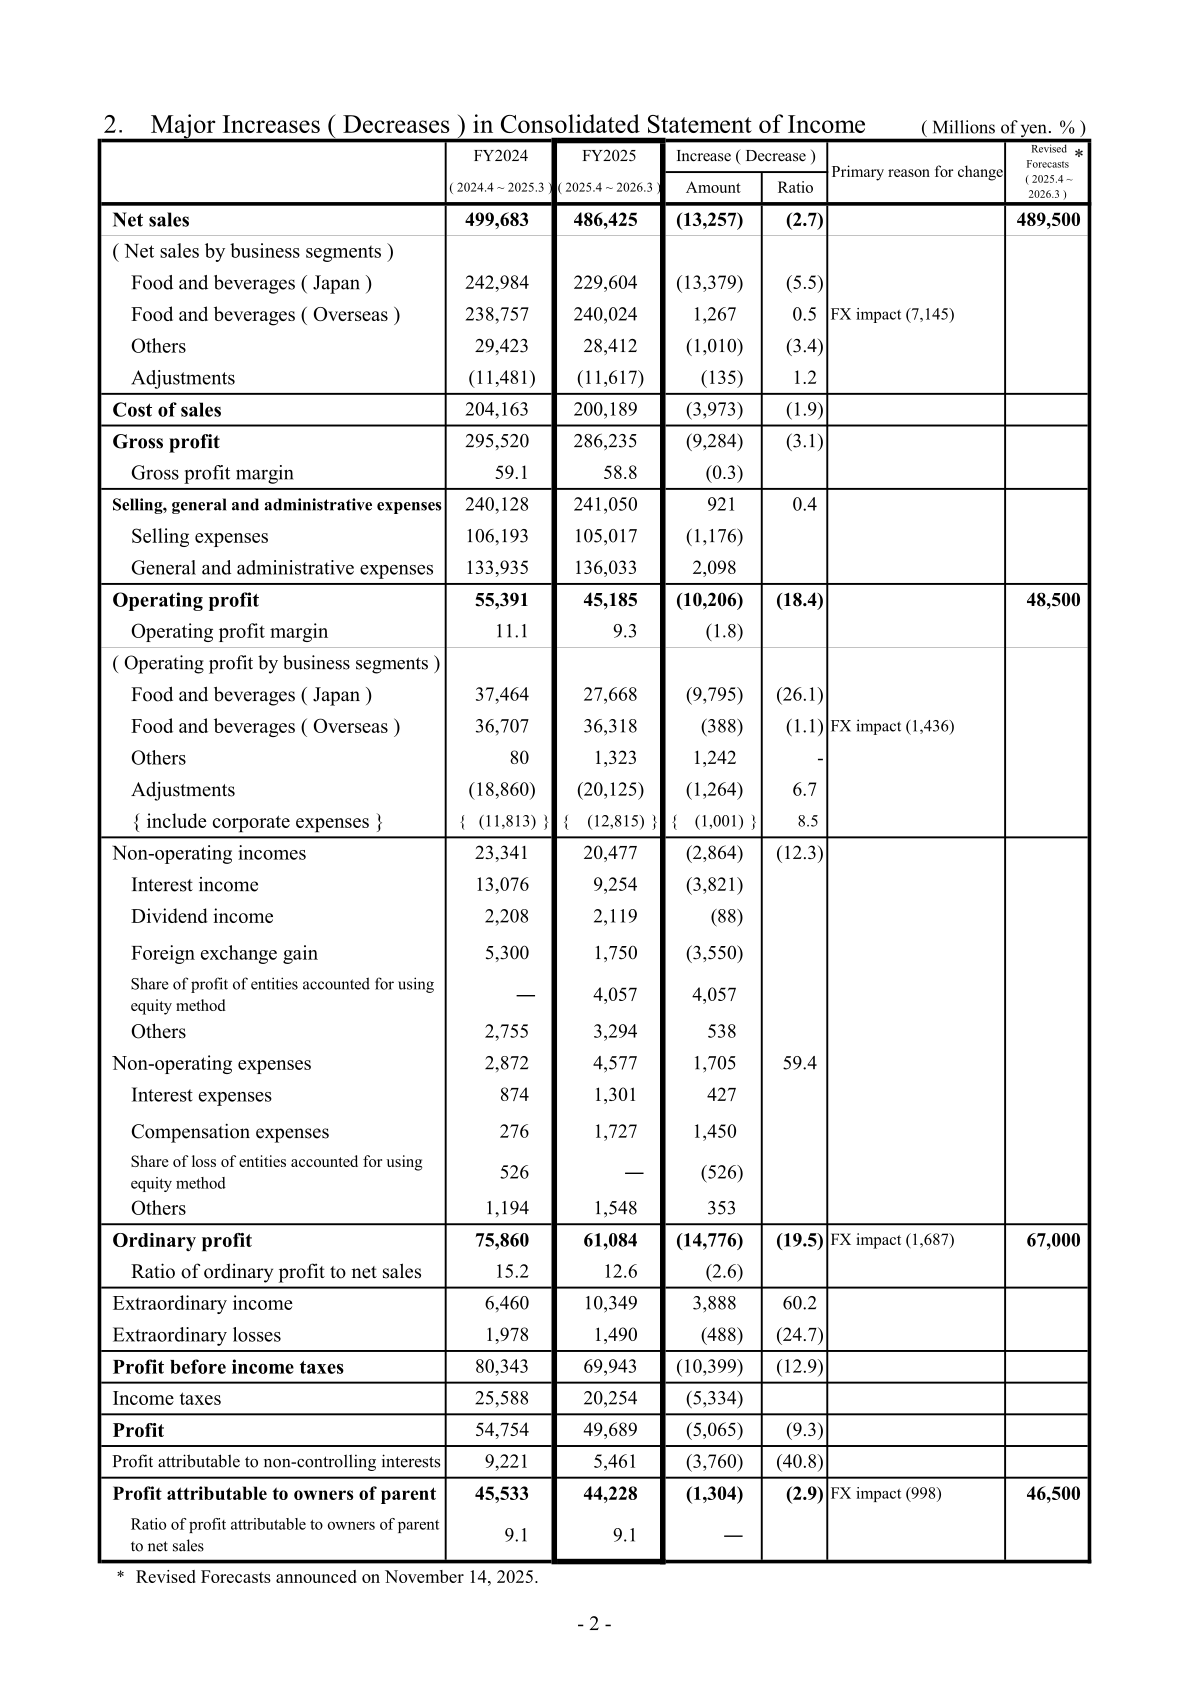
In this article, FY2025 refers to Yakult Honsha’s fiscal year ended March 31, 2026, consistent with the company’s own FY2025 label in these materials. Consolidated net sales fell 2.7% year on year to 486,425 million yen and operating profit fell 18.4% to 45,185 million yen, both below the revised forecasts of 489,500 million yen and 48,500 million yen announced on November 14, 2025. The decline was concentrated in the Food and beverages (Japan) business, where net sales fell 5.5% to 229,604 million yen and operating profit fell 26.1% to 27,668 million yen. Profit attributable to owners of parent held up better, down 2.9% to 44,228 million yen, helped by a 4,057 million yen share of profit of entities accounted for using equity method and by extraordinary income of 10,349 million yen. For the fiscal year ending March 31, 2027, Yakult forecasts net sales of 527,000 million yen (108.3% year on year) and operating profit of 44,000 million yen (97.4%).
Consolidated Results (Full-Year Actual)
Consolidated net sales decreased 13,257 million yen, or 2.7%, to 486,425 million yen. Cost of sales fell 1.9% to 200,189 million yen, but gross profit declined 3.1% to 286,235 million yen and the gross profit margin slipped to 58.8% from 59.1%. Selling, general and administrative expenses rose 0.4% to 241,050 million yen, as a 1,176 million yen decrease in selling expenses to 105,017 million yen was more than offset by a 2,098 million yen increase in general and administrative expenses to 136,033 million yen. Operating profit therefore fell 10,206 million yen, or 18.4%, to 45,185 million yen, with the operating profit margin down 1.8pt to 9.3%. Ordinary profit fell 19.5% to 61,084 million yen; the company cites an FX impact of 1,687 million yen, and non-operating income declined 12.3% to 20,477 million yen as interest income fell to 9,254 million yen from 13,076 million yen and foreign exchange gain fell to 1,750 million yen from 5,300 million yen. Non-operating expenses rose 59.4% to 4,577 million yen. Extraordinary income increased 60.2% to 10,349 million yen while extraordinary losses fell 24.7% to 1,490 million yen, so profit before income taxes declined 12.9% to 69,943 million yen. Profit attributable to non-controlling interests dropped 40.8% to 5,461 million yen, limiting the decline in profit attributable to owners of parent to 2.9%, at 44,228 million yen, with an FX impact of 998 million yen. The ratio of profit attributable to owners of parent to net sales was unchanged at 9.1%.
| Item (millions of yen) | FY2025 (FYE Mar. 2026) | FY2024 (FYE Mar. 2025) | Increase (Decrease) | Ratio (%) | FY2025 Revised Forecast |
|---|---|---|---|---|---|
| Net sales | 486,425 | 499,683 | (13,257) | (2.7) | 489,500 |
| Cost of sales | 200,189 | 204,163 | (3,973) | (1.9) | — |
| Gross profit | 286,235 | 295,520 | (9,284) | (3.1) | — |
| Gross profit margin (%) | 58.8 | 59.1 | (0.3) | — | — |
| Selling, general and administrative expenses | 241,050 | 240,128 | 921 | 0.4 | — |
| Operating profit | 45,185 | 55,391 | (10,206) | (18.4) | 48,500 |
| Operating profit margin (%) | 9.3 | 11.1 | (1.8) | — | — |
| Ordinary profit | 61,084 | 75,860 | (14,776) | (19.5) | 67,000 |
| Profit before income taxes | 69,943 | 80,343 | (10,399) | (12.9) | — |
| Profit | 49,689 | 54,754 | (5,065) | (9.3) | — |
| Profit attributable to owners of parent | 44,228 | 45,533 | (1,304) | (2.9) | 46,500 |
| Earnings per share (yen) | 150.72 | 150.48 | 0.24 | — | — |
Segment Results
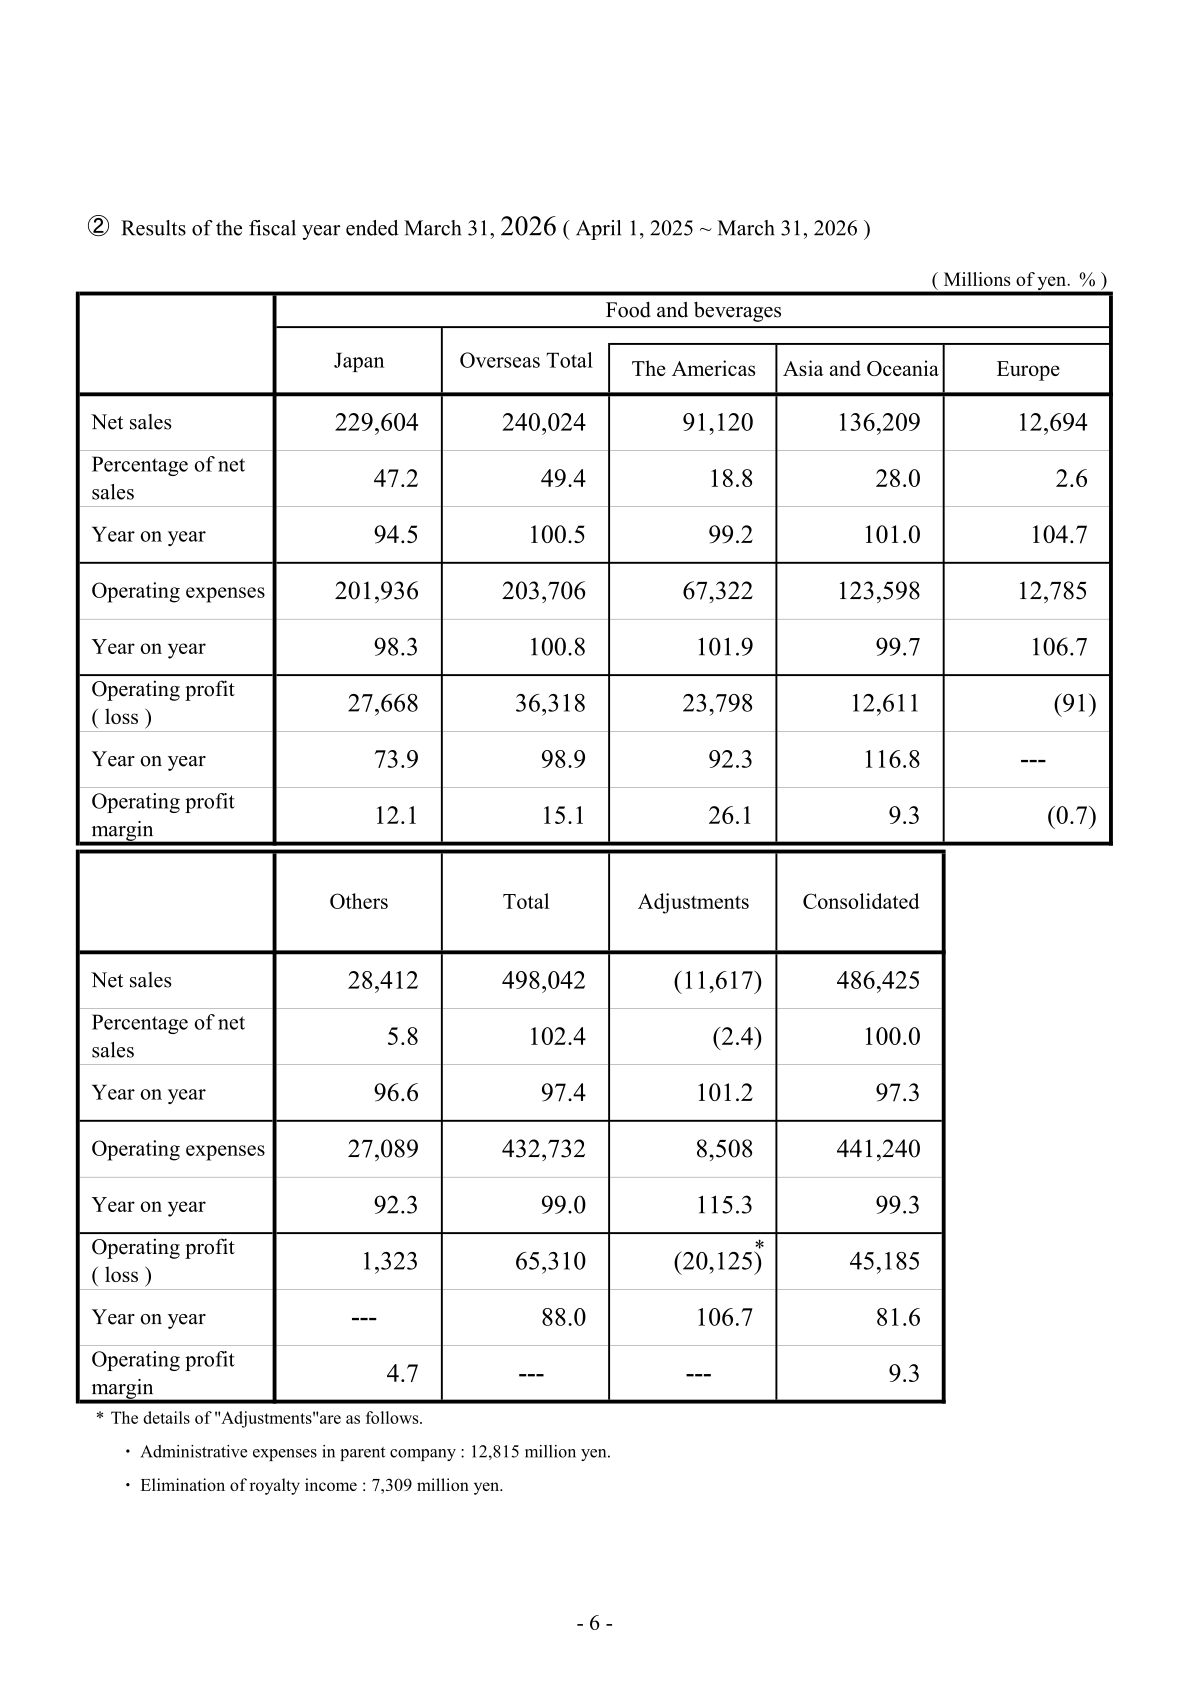
Food and beverages (Japan) net sales fell 13,379 million yen, or 5.5%, to 229,604 million yen (94.5% year on year), and operating profit fell 9,795 million yen, or 26.1%, to 27,668 million yen (73.9%), with the segment operating profit margin at 12.1%. Food and beverages (Overseas) net sales rose 1,267 million yen, or 0.5%, to 240,024 million yen (100.5%) despite an FX impact of 7,145 million yen, while operating profit edged down 388 million yen, or 1.1%, to 36,318 million yen (98.9%) after an FX impact of 1,436 million yen, leaving the overseas operating profit margin at 15.1%. Within the overseas business, The Americas posted net sales of 91,120 million yen (99.2%) and operating profit of 23,798 million yen (92.3%), Asia and Oceania posted net sales of 136,209 million yen (101.0%) and operating profit of 12,611 million yen (116.8%), and Europe posted net sales of 12,694 million yen (104.7%) with an operating loss of 91 million yen. The Others segment recorded net sales of 28,412 million yen (96.6%) and operating profit of 1,323 million yen, up from 80 million yen. Adjustments to operating profit widened 6.7% to negative 20,125 million yen, of which corporate expenses were 12,815 million yen. On a constant exchange rate basis, using the January to December 2024 average rate, consolidated net sales would have been 493,571 million yen (98.8%) and operating profit 46,621 million yen (84.2%).
| Segment | Metric (millions of yen) | FY2025 | FY2024 | Year on year (%) |
|---|---|---|---|---|
| Food and beverages (Japan) | Net sales | 229,604 | 242,984 | 94.5 |
| Food and beverages (Japan) | Operating profit | 27,668 | 37,464 | 73.9 |
| Food and beverages (Overseas) | Net sales | 240,024 | 238,757 | 100.5 |
| Food and beverages (Overseas) | Operating profit | 36,318 | 36,707 | 98.9 |
| The Americas | Net sales | 91,120 | 91,822 | 99.2 |
| The Americas | Operating profit | 23,798 | 25,769 | 92.3 |
| Asia and Oceania | Net sales | 136,209 | 134,803 | 101.0 |
| Asia and Oceania | Operating profit | 12,611 | 10,794 | 116.8 |
| Europe | Net sales | 12,694 | 12,130 | 104.7 |
| Europe | Operating profit (loss) | (91) | 143 | — |
| Others | Net sales | 28,412 | 29,423 | 96.6 |
| Others | Operating profit | 1,323 | 80 | — |
| Adjustments | Net sales | (11,617) | (11,481) | 101.2 |
| Adjustments | Operating profit | (20,125) | (18,860) | 106.7 |
| Consolidated | Net sales | 486,425 | 499,683 | 97.3 |
| Consolidated | Operating profit | 45,185 | 55,391 | 81.6 |
FY2026 Forecast
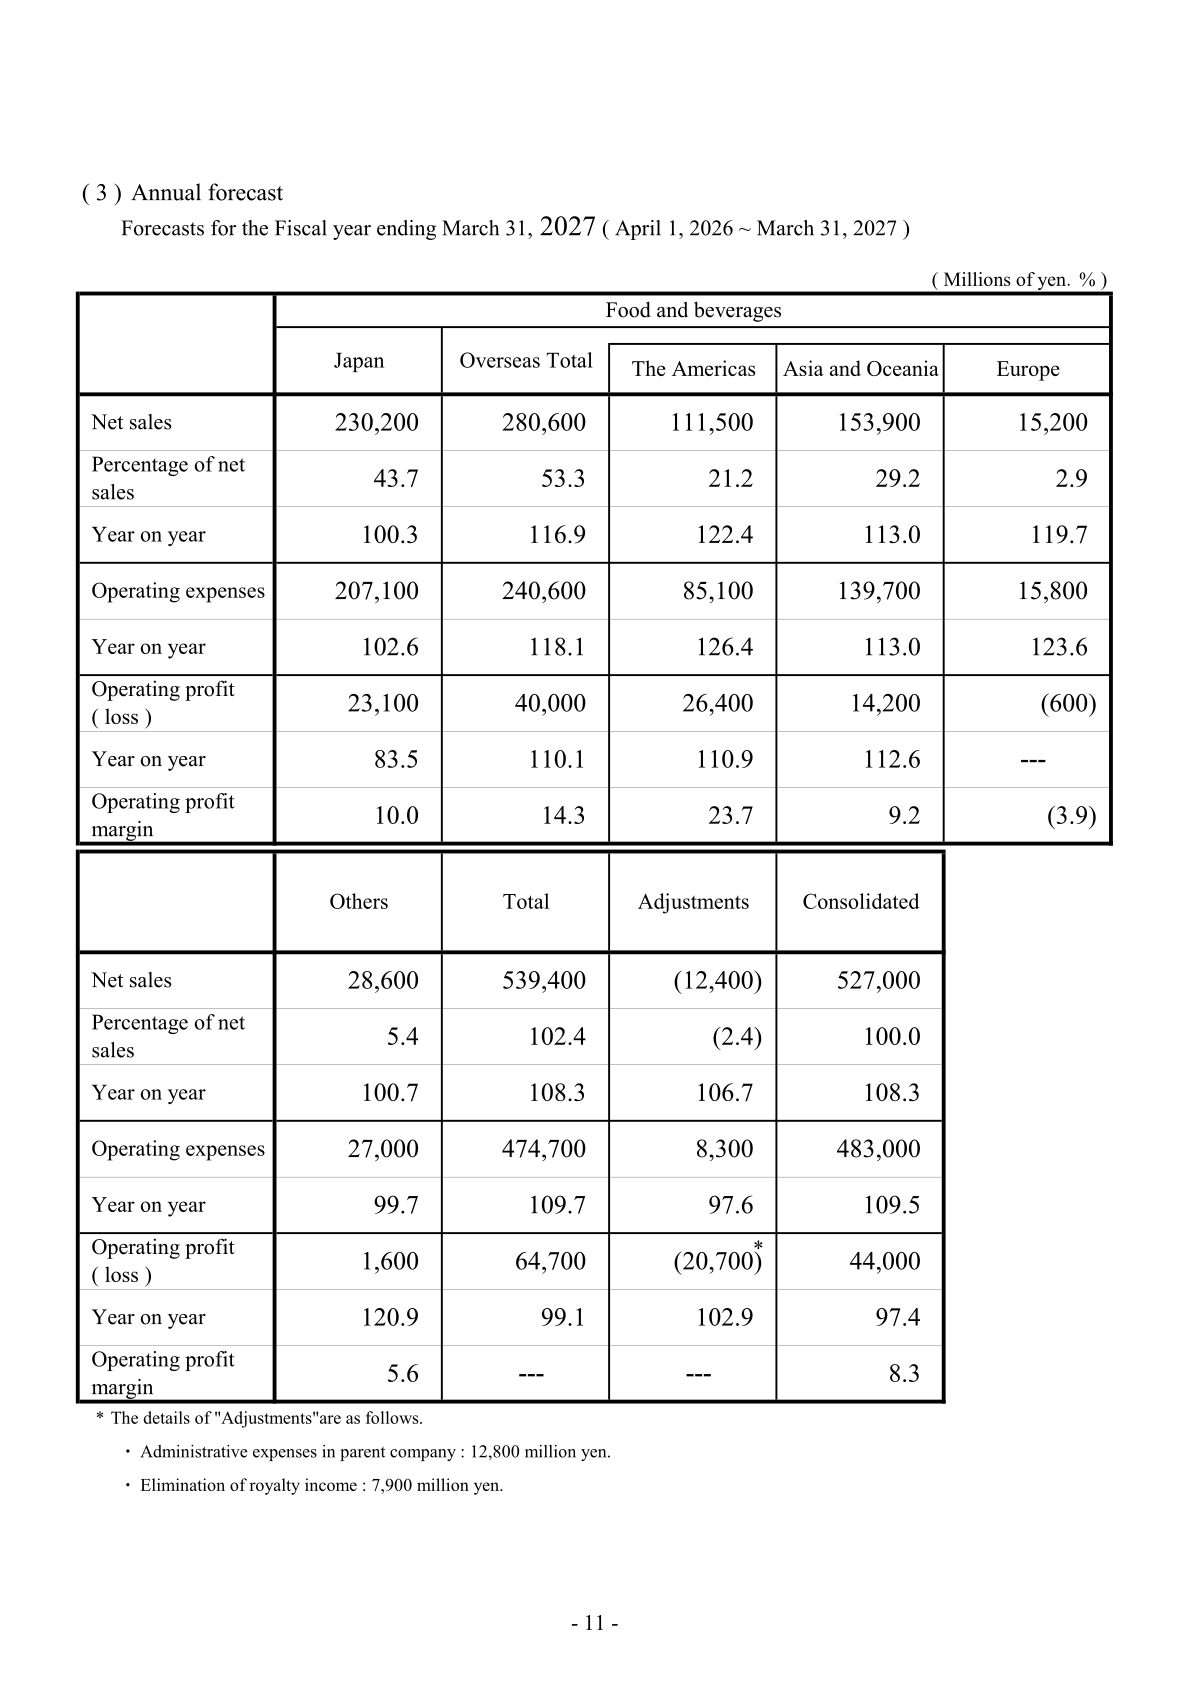
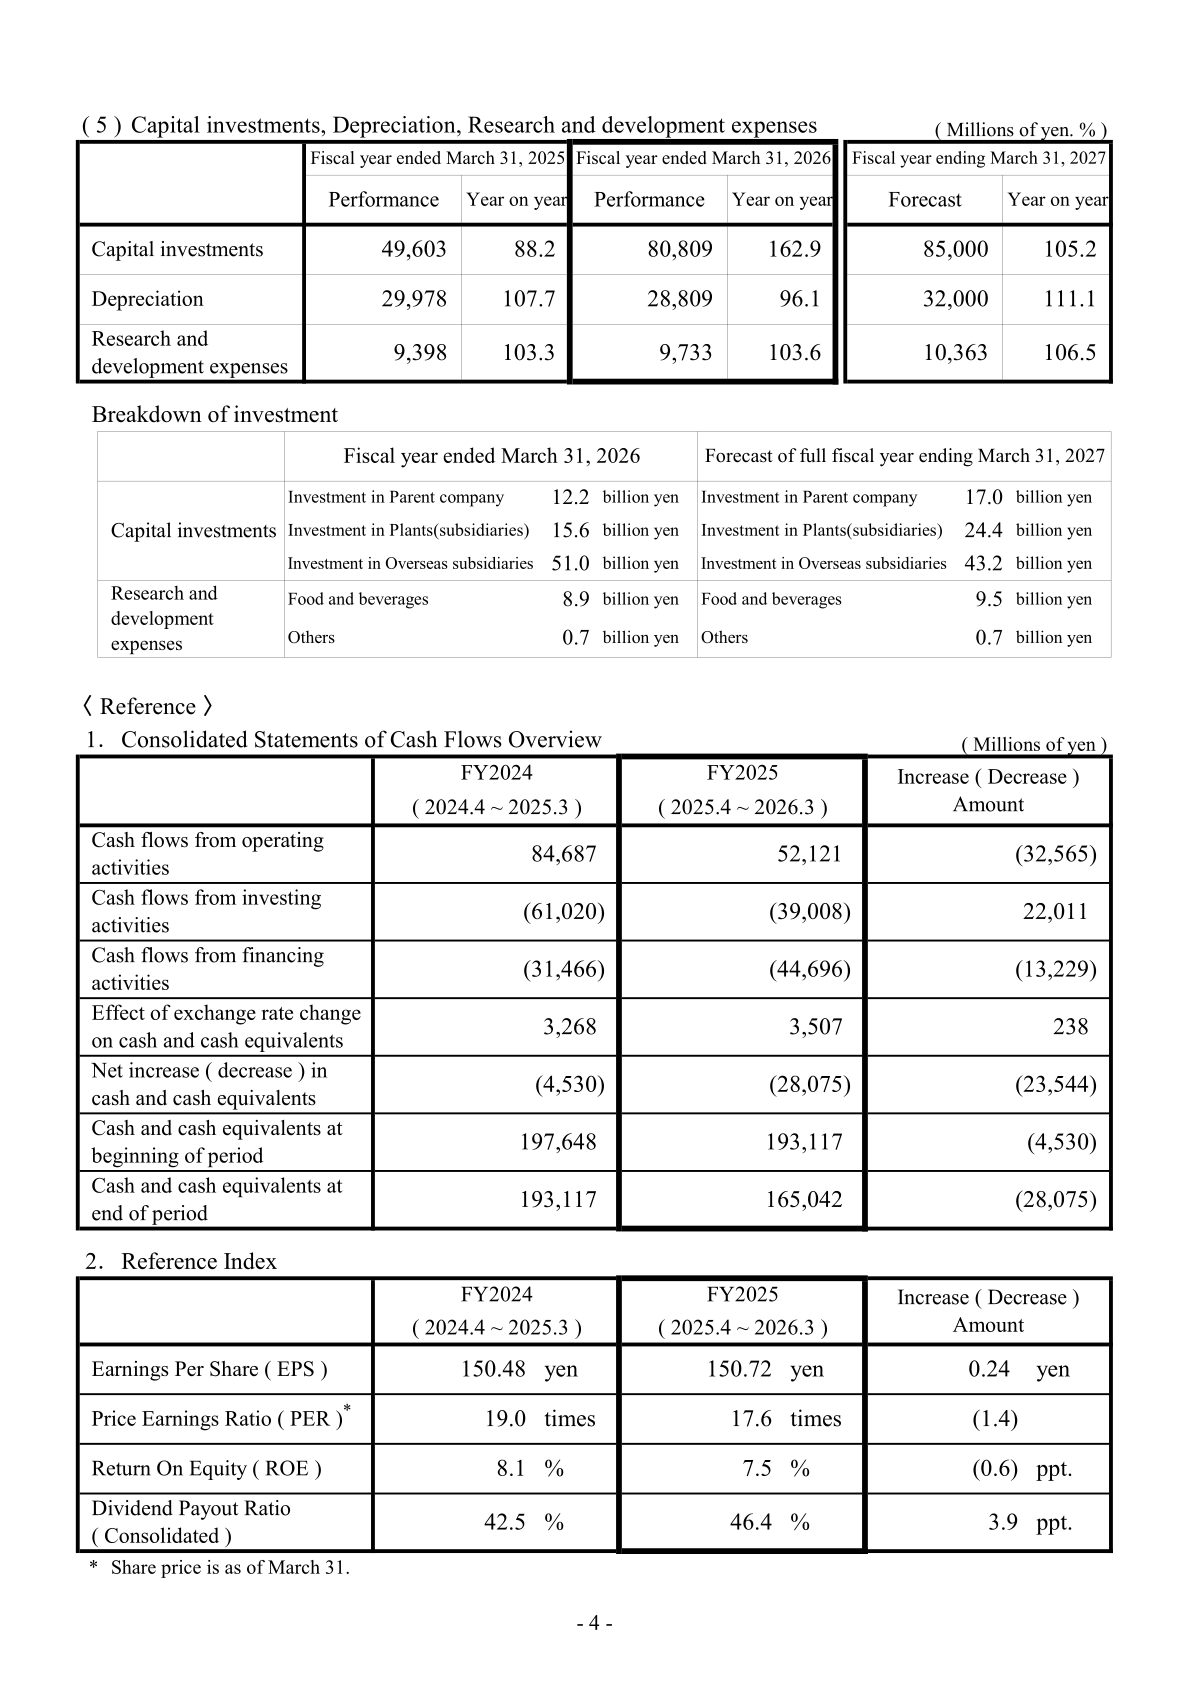
For the fiscal year ending March 31, 2027, Yakult forecasts consolidated net sales of 527,000 million yen (108.3% year on year), operating profit of 44,000 million yen (97.4%), ordinary profit of 57,500 million yen (94.1%) and profit attributable to owners of parent of 46,500 million yen (105.1%). By segment, Food and beverages (Japan) is forecast at net sales of 230,200 million yen (100.3%) and operating profit of 23,100 million yen (83.5%), while Food and beverages (Overseas) is forecast at net sales of 280,600 million yen (116.9%) and operating profit of 40,000 million yen (110.1%), comprising The Americas at 111,500 million yen of net sales (122.4%) and 26,400 million yen of operating profit (110.9%), Asia and Oceania at 153,900 million yen (113.0%) and 14,200 million yen (112.6%), and Europe at 15,200 million yen (119.7%) with a forecast operating loss of 600 million yen. The forecast uses the January to March 2026 average exchange rate; on the basis of the January to December 2025 average rate, the company shows reference figures of 504,900 million yen of net sales (103.8%) and 40,500 million yen of operating profit (89.6%). Capital investments are planned at 85,000 million yen (105.2%), depreciation at 32,000 million yen (111.1%) and research and development expenses at 10,363 million yen (106.5%); the capital investment plan comprises 17.0 billion yen for the parent company, 24.4 billion yen for subsidiary plants and 43.2 billion yen for overseas subsidiaries.
| Item (millions of yen) | FY2026 Forecast (FYE Mar. 2027) | FY2025 (Actual) | Year on year (%) |
|---|---|---|---|
| Net sales | 527,000 | 486,425 | 108.3 |
| Operating profit | 44,000 | 45,185 | 97.4 |
| Ordinary profit | 57,500 | 61,084 | 94.1 |
| Profit attributable to owners of parent | 46,500 | 44,228 | 105.1 |
| Capital investments | 85,000 | 80,809 | 105.2 |
| Depreciation | 32,000 | 28,809 | 111.1 |
| Research and development expenses | 10,363 | 9,733 | 103.6 |
Shareholder Returns
The consolidated dividend payout ratio rose 3.9pt to 46.4% in FY2025 from 42.5% in FY2024, while earnings per share edged up 0.24 yen to 150.72 yen. Return on equity fell 0.6pt to 7.5% from 8.1%, and the price earnings ratio, based on the share price as of March 31, was 17.6 times against 19.0 times a year earlier. In the accompanying briefing material “Approach to Enhancing Corporate Value Going Forward,” Yakult states that it will carry out share buybacks under its Medium-term Management Plan during the current fiscal year, with a total of 100 billion yen of buybacks planned by FY2030. Against buybacks of 15 billion yen in FY2024 and 18 billion yen in FY2025, and 12 billion yen already announced for FY2026 (bringing the announced cumulative total to 45 billion yen), a recent resolution adds a share buyback of 55 billion yen to be executed by the end of the current fiscal year, taking the FY2026 total to 67 billion yen. The company also states it will accelerate the reduction of cross-shareholdings toward 5% of consolidated net assets. Consolidated cash flows from operating activities fell to 52,121 million yen from 84,687 million yen, cash flows from investing activities were negative 39,008 million yen and cash flows from financing activities were negative 44,696 million yen, leaving cash and cash equivalents at the end of the period at 165,042 million yen.
| Reference Index | FY2024 | FY2025 | Increase (Decrease) |
|---|---|---|---|
| Earnings per share (yen) | 150.48 | 150.72 | 0.24 |
| Price earnings ratio (times) | 19.0 | 17.6 | (1.4) |
| Return on equity (%) | 8.1 | 7.5 | (0.6) |
| Dividend payout ratio, consolidated (%) | 42.5 | 46.4 | 3.9 |
Medium-Term Plan / Topics
In “Approach to Enhancing Corporate Value Going Forward,” presented alongside the results on May 12, 2026, Yakult identifies its current issues as a slowdown in the Food and beverages (Japan) business, a decrease in operating margin, and a decline in ROE from 8.1% to 7.5%, and sets out two responses: executing a regrowth strategy and cost of capital-conscious management. It targets ROE of 8% for the current fiscal year and 10% for FY2030. In the Japan business, the product policy centres on increasing product value: the company obtained approval for the function claim “Supporting immune health” for “Yakult 400 immunity and gut health” and “Yakult 400 LT immunity and gut health” and plans to expand this to other products, while for its Bifidobacterium breve strain Yakult products it raised the claim to “Increases the number of beneficial bacteria” (from 12 billion to 20 billion per bottle) alongside a price revision from 100 yen to 110 yen per bottle, and is considering price revisions for other products. Its channel strategy covers home delivery, distribution and EC, spanning 3.4 million customers, 175,000 business partners and 1 million EC users. From FY2027 the company will establish a Corporate Value Enhancement Committee to fundamentally review business strategy, capital policy and governance, with the outcome to be announced upon the release of second-quarter results in November 2026.
Domestic dairy products sales fell to 8,933 thousand bottles per day in FY2025 from 9,680 thousand (92.3% year on year), with the total for the Yakult series at 7,243 thousand bottles per day (90.7%) and the total for fermented milk at 1,521 thousand (98.5%); the FY2026 forecast is 8,850 thousand bottles per day (99.1%). Within the Yakult series, the Yakult 1000 series fell to 2,828 thousand bottles per day (93.9%), the New Yakult series to 2,744 thousand (90.1%) and the Yakult 400 series to 1,625 thousand (87.4%). Overseas, dairy products sales for January to December 2025 totalled 29,002 thousand bottles per day (101.5% year on year), comprising Asia and Oceania at 22,381 thousand (102.0%), The Americas at 5,945 thousand (99.6%) and Europe at 676 thousand (102.3%); preliminary figures for January to March 2026 show a total of 28,503 thousand bottles per day (102.8%). As of the end of December 2025 there were 49,491 Yakult Ladies outside Japan delivering to 1,029,862 stores, while in Japan the number of Yakult Ladies was 29,934 as of March 31, 2026, down from 30,653 as of September 30, 2025.
This article is an analysis based on publicly available information and is not a recommendation to buy or sell any specific securities. Investment decisions are your own responsibility.
![[Obayashi] Investors’ Guide 2026 — The Complete 24-Article Breakdown](https://japan-equity.com/wp-content/uploads/2026/07/hub_cover-1024x1024.png)
![[Obayashi] IR & SR Policy — Feeding Dialogue Back into Management](https://japan-equity.com/wp-content/uploads/2026/07/p32_sq-1024x1024.jpg)
![[Obayashi] Real Estate Development — 18.7% Margin, ¥287.7bn Unrealized Gains](https://japan-equity.com/wp-content/uploads/2026/07/p20_sq-1024x1024.jpg)
![[Obayashi] Domestic Civil Engineering — Resilience Spending Supports 9.6% Margin](https://japan-equity.com/wp-content/uploads/2026/07/p11_sq-1024x1024.jpg)
![[Obayashi] Share Price & External Ratings — vs TOPIX, ESG Index Inclusion](https://japan-equity.com/wp-content/uploads/2026/07/p40_sq-1024x1024.jpg)
![[Construction] ¥75.5tn Investment, Shrinking Workforce — Big-5 Market Share](https://japan-equity.com/wp-content/uploads/2026/07/p12_sq-1024x1024.jpg)



![[Obayashi] Capital Policy & Shareholder Returns — ROE 10%+, DOE ~5%, ¥100bn Buyback](https://japan-equity.com/wp-content/uploads/2026/07/p27_sq-1024x1024.jpg)
![[Obayashi] Reducing Cross-Shareholdings — ¥285.2bn Sold in Five Years](https://japan-equity.com/wp-content/uploads/2026/07/p29_sq-1024x1024.jpg)
![[Obayashi] ¥750bn Investment Plan — ¥300bn to Development, ¥190bn to Tech/DX](https://japan-equity.com/wp-content/uploads/2026/07/p30_sq-1024x1024.jpg)
![[Obayashi] MTP2022 KPIs — Operating Profit ~2x Target, ROE 14.4%](https://japan-equity.com/wp-content/uploads/2026/07/p25_sq-1024x1024.jpg)
![[Obayashi] Cash Allocation — ¥420bn Investment CF Over Five Years](https://japan-equity.com/wp-content/uploads/2026/07/p26_sq-1024x1024.jpg)
![[Obayashi] Green Energy — 44 Plants, 344MW, and the Green Hydrogen Challenge](https://japan-equity.com/wp-content/uploads/2026/07/p21_sq-1024x1024.jpg)
![[Obayashi] Tackling the Labor Shortage — Robotics Construction®](https://japan-equity.com/wp-content/uploads/2026/07/p14_sq-1024x1024.jpg)
