
This article is based on publicly available IR materials and is not a recommendation to buy or sell any specific securities.
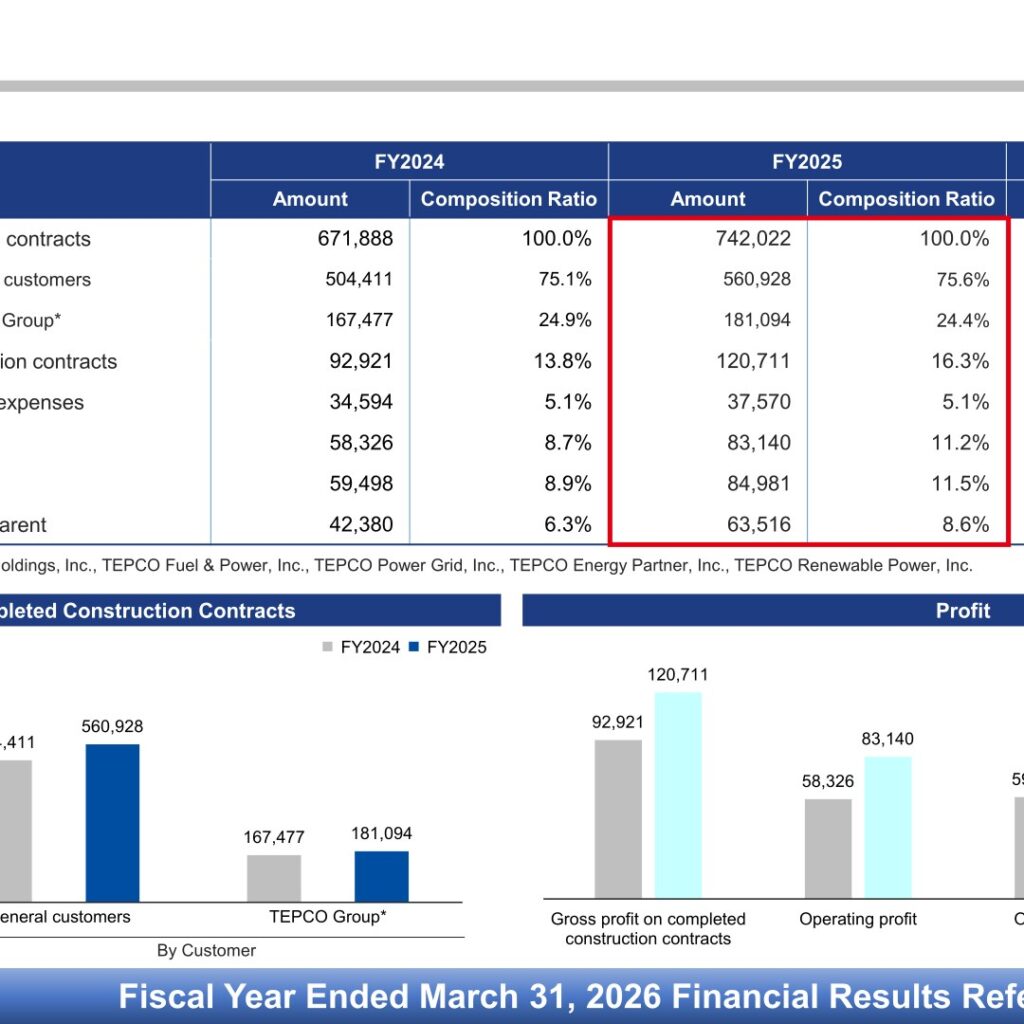
Kandenko Co., Ltd. released its Financial Results Reference Materials for the Fiscal Year Ended March 31, 2026 on April 28, 2026. The company refers to the year ended March 31, 2026 as FY2025. Consolidated net sales of completed construction contracts rose to 742,022 million yen from 671,888 million yen a year earlier (110.4% year on year), while operating profit reached 83,140 million yen (142.5%) and profit attributable to owners of the parent reached 63,516 million yen (149.9%). The gross profit margin on completed construction contracts improved to 16.3% from 13.8%.
Consolidated Results (Full-Year Actual)
On a consolidated basis, net sales of completed construction contracts increased by 70,134 million yen year on year. By customer, general customers accounted for 560,928 million yen (75.6% of the total) and the TEPCO Group for 181,094 million yen (24.4%). Gross profit on completed construction contracts grew by 27,790 million yen to 120,711 million yen, outpacing the 2,976 million yen increase in selling, general and administrative expenses, which held steady at 5.1% of net sales. Ordinary profit came to 84,981 million yen, or 11.5% of net sales.
| Item (Millions of yen) | FY2025 | FY2024 | Change | YoY |
|---|---|---|---|---|
| Net sales of completed construction contracts | 742,022 | 671,888 | 70,134 | 110.4% |
| (By customer) General customers | 560,928 | 504,411 | 56,517 | 111.2% |
| (By customer) TEPCO Group | 181,094 | 167,477 | 13,617 | 108.1% |
| Gross profit on completed construction contracts | 120,711 | 92,921 | 27,790 | 129.9% |
| Selling, general and administrative expenses | 37,570 | 34,594 | 2,976 | 108.6% |
| Operating profit | 83,140 | 58,326 | 24,814 | 142.5% |
| Ordinary profit | 84,981 | 59,498 | 25,483 | 142.8% |
| Profit attributable to owners of the parent | 63,516 | 42,380 | 21,136 | 149.9% |
The materials also show a five-year consolidated trend, with net sales of completed construction contracts moving from 495,567 million yen in FY2021 to 541,579 million yen, 598,427 million yen, 671,888 million yen and 742,022 million yen in FY2025, and profit attributable to owners of the parent moving from 20,315 million yen to 21,167 million yen, 27,345 million yen, 42,380 million yen and 63,516 million yen over the same period.
Non-Consolidated Results, Orders and Backlog
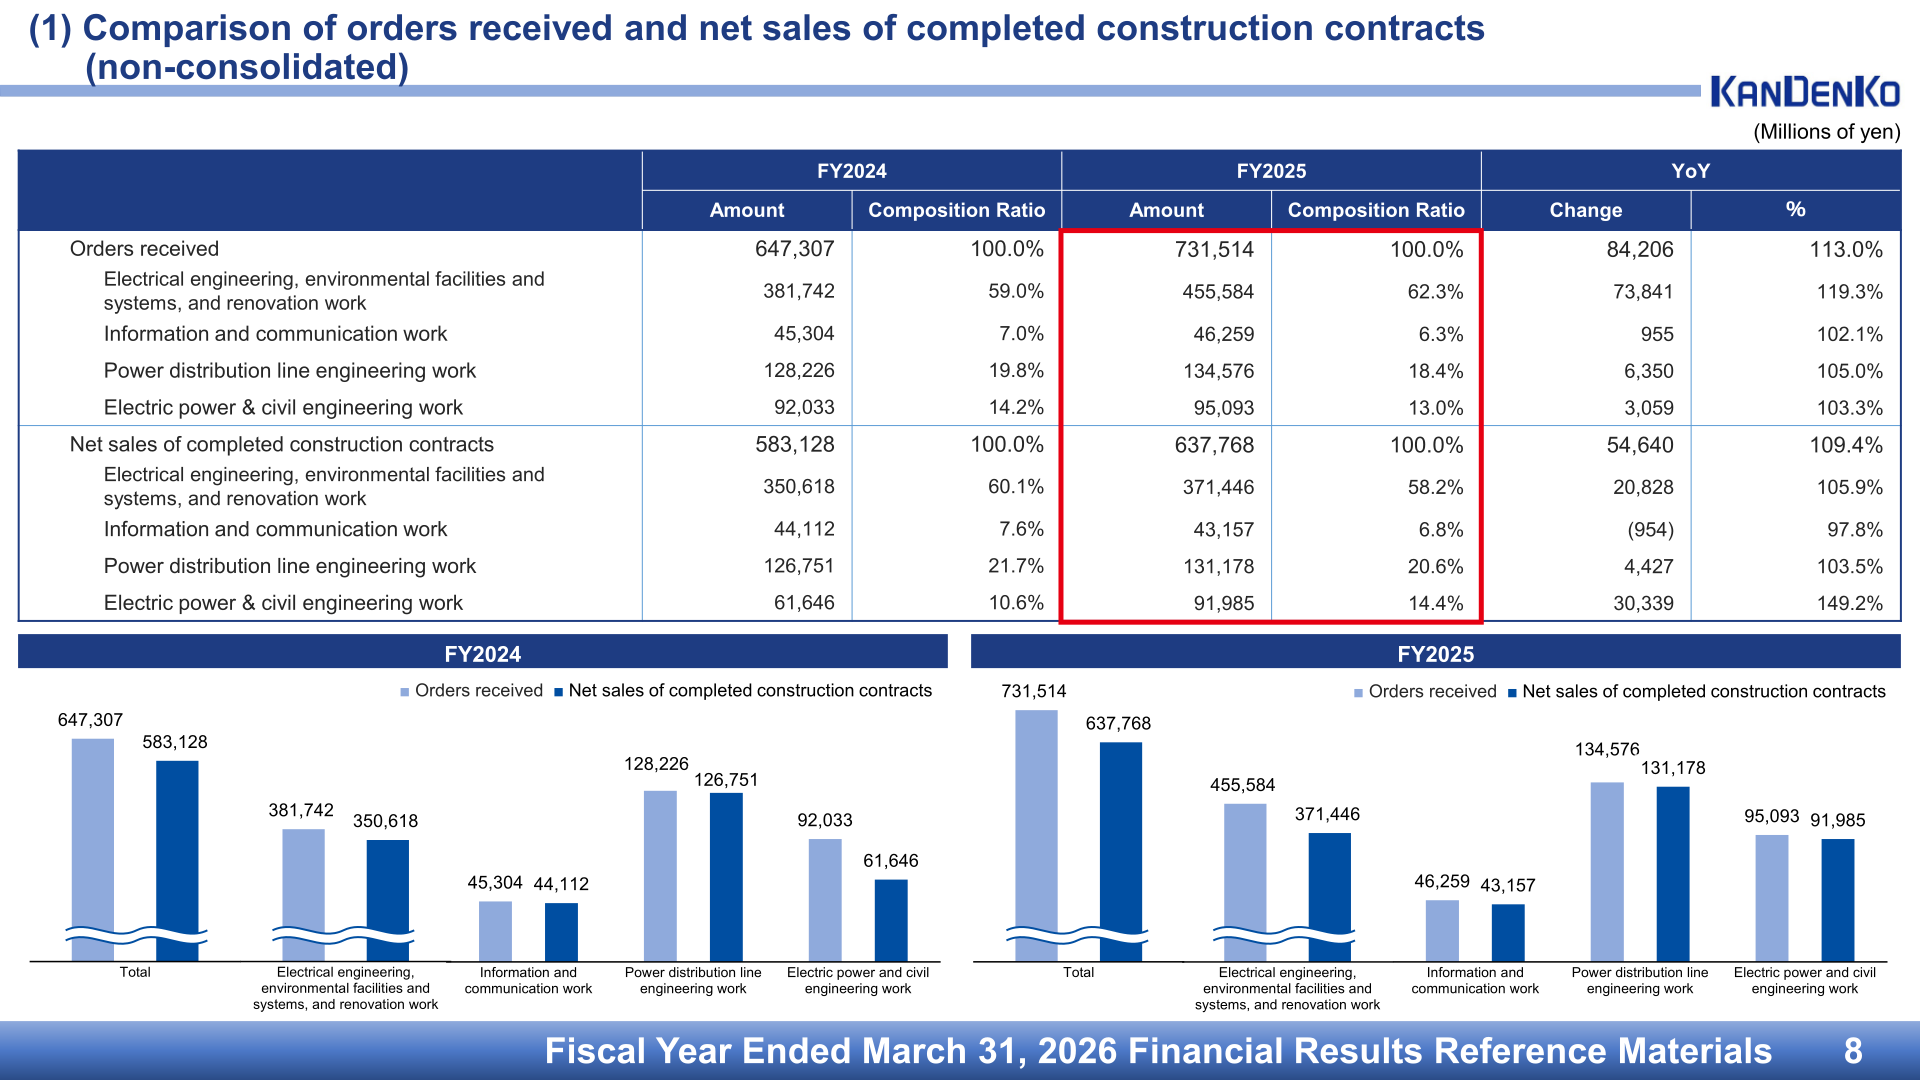
On a non-consolidated basis, orders received rose to 731,514 million yen (113.0% year on year) and net sales of completed construction contracts to 637,768 million yen (109.4%). Operating profit was 69,692 million yen (142.8%), ordinary profit 71,856 million yen (143.1%) and profit 56,520 million yen (151.4%). Earnings per share was 277.43 yen, compared with 182.59 yen in FY2024. Backlog at the end of FY2025 stood at 673,681 million yen, up 93,745 million yen or 116.2% from 579,935 million yen a year earlier.
Results by Construction Category (Non-Consolidated)
Electrical engineering, environmental facilities and systems, and renovation work was the largest category, with orders received of 455,584 million yen (119.3% year on year) and net sales of completed construction contracts of 371,446 million yen (105.9%). Electric power and civil engineering work recorded the sharpest sales growth, at 91,985 million yen (149.2%), while information and communication work saw net sales edge down to 43,157 million yen (97.8%). Within the electrical engineering category, orders received by building use included 148,473 million yen for offices and government buildings and 44,440 million yen for data centers, against 90,718 million yen and 29,322 million yen respectively in FY2024.
| Category (Non-Consolidated, Millions of yen) | Orders Received FY2025 | Orders Received FY2024 | Net Sales FY2025 | Net Sales FY2024 |
|---|---|---|---|---|
| Electrical engineering, environmental facilities and systems, and renovation work | 455,584 | 381,742 | 371,446 | 350,618 |
| Information and communication work | 46,259 | 45,304 | 43,157 | 44,112 |
| Power distribution line engineering work | 134,576 | 128,226 | 131,178 | 126,751 |
| Electric power & civil engineering work | 95,093 | 92,033 | 91,985 | 61,646 |
| Total | 731,514 | 647,307 | 637,768 | 583,128 |
Financial Position and Cash Flows
Consolidated total assets stood at 635,618 million yen at the end of FY2025, up 32,397 million yen, with total net assets of 405,687 million yen and equity of 390,270 million yen. The equity ratio was 61.4%, compared with 61.0% a year earlier. Cash flows provided by operating activities were 89,451 million yen, against 18,263 million yen in the prior year, helped by profit before income taxes of +91,731 million yen and an increase in advances received on construction contracts in progress of +17,049 million yen. Cash flows used in investing activities were 4,835 million yen and cash flows used in financing activities were 65,636 million yen, the latter reflecting purchase of treasury shares of -30,001 million yen and dividends paid of -20,644 million yen. Cash and cash equivalents at the end of the period were 77,151 million yen.
FY2026 Forecast
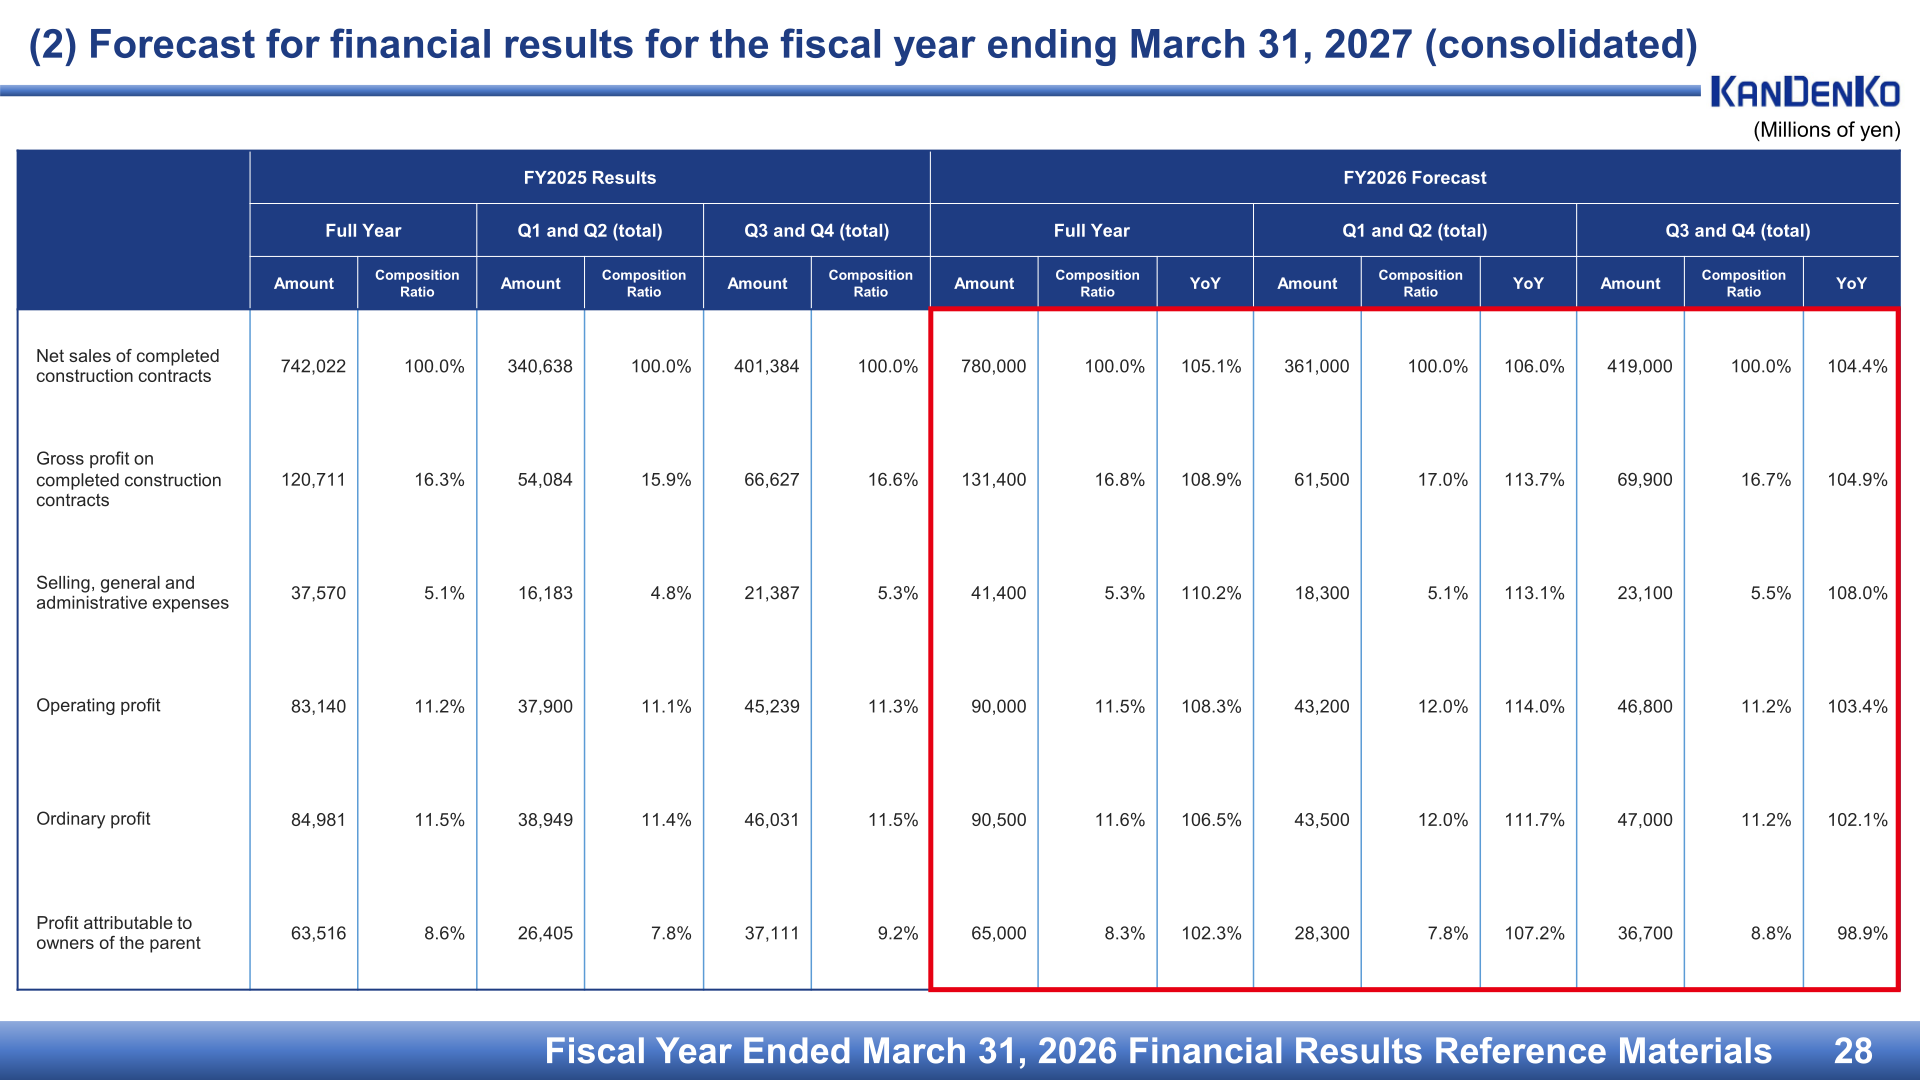
For the fiscal year ending March 31, 2027, which the company labels FY2026, Kandenko forecasts consolidated net sales of completed construction contracts of 780,000 million yen (105.1% year on year), operating profit of 90,000 million yen (108.3%), ordinary profit of 90,500 million yen (106.5%) and profit attributable to owners of the parent of 65,000 million yen (102.3%). On a non-consolidated basis, the company forecasts orders received of 809,000 million yen (110.6%), net sales of completed construction contracts of 674,000 million yen (105.7%), operating profit of 76,700 million yen (110.1%) and profit of 58,700 million yen (103.9%).
| Item (Consolidated, Millions of yen) | FY2026 Forecast | FY2025 (Actual) | YoY |
|---|---|---|---|
| Net sales of completed construction contracts | 780,000 | 742,022 | 105.1% |
| Gross profit on completed construction contracts | 131,400 | 120,711 | 108.9% |
| Selling, general and administrative expenses | 41,400 | 37,570 | 110.2% |
| Operating profit | 90,000 | 83,140 | 108.3% |
| Ordinary profit | 90,500 | 84,981 | 106.5% |
| Profit attributable to owners of the parent | 65,000 | 63,516 | 102.3% |
By construction category on a non-consolidated basis, the FY2026 forecast calls for orders received of 504,000 million yen in electrical engineering, environmental facilities and systems, and renovation work, 50,000 million yen in information and communication work, 137,500 million yen in power distribution line engineering work and 117,500 million yen in electric power and civil engineering work.
Shareholder Returns
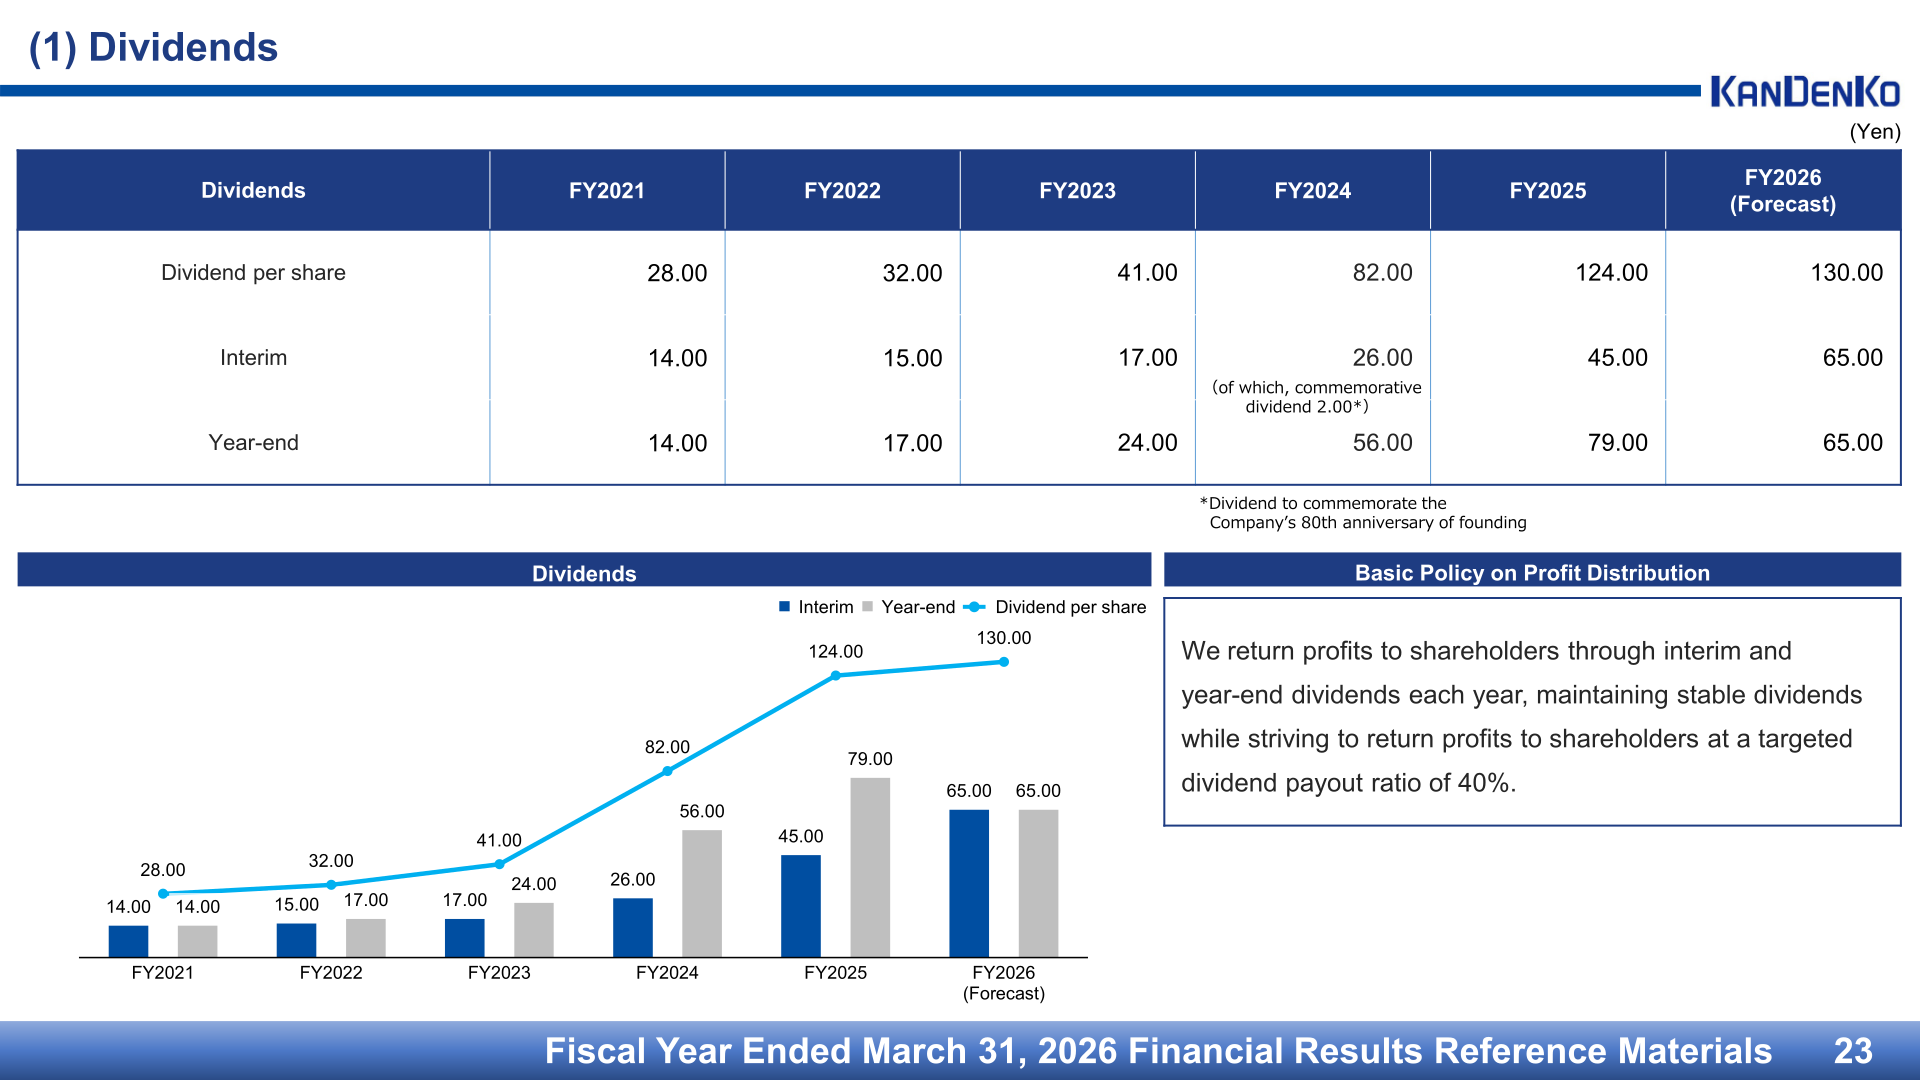
The dividend per share for FY2025 was 124.00 yen, comprising an interim dividend of 45.00 yen and a year-end dividend of 79.00 yen, up from 82.00 yen in FY2024. For FY2026 the company forecasts a dividend per share of 130.00 yen, split evenly between an interim dividend of 65.00 yen and a year-end dividend of 65.00 yen. The materials state the basic policy on profit distribution as follows: the company returns profits to shareholders through interim and year-end dividends each year, maintaining stable dividends while striving to return profits to shareholders at a targeted dividend payout ratio of 40%. A secondary offering of shares and a share repurchase were executed in FY2025 Q4.
| Dividends (Yen) | FY2023 | FY2024 | FY2025 | FY2026 (Forecast) |
|---|---|---|---|---|
| Interim | 17.00 | 26.00 | 45.00 | 65.00 |
| Year-end | 24.00 | 56.00 | 79.00 | 65.00 |
| Dividend per share | 41.00 | 82.00 | 124.00 | 130.00 |
Secondary Offering and Shareholder Composition
The materials describe a secondary offering of shares held by TEPCO Power Grid, Incorporated, including overallotment. TEPCO Power Grid held 46.2% of shares and 10.2% of shares were offered, with percentages within the shareholder mix stated as of March 31, 2025. The stated purposes were to have more business options, including strategic M&As and alliances; to increase the proportion of individuals and institutional investors, both in Japan and overseas, in the shareholder mix and to diversify the shareholder base; and to increase enterprise value by securing a fair valuation. As of March 31, 2026, TEPCO Power Grid remained the largest shareholder with 68,596,352 shares, or 34.46%. Ownership ratios by category as of March 31, 2026 were 37.50% domestic corporations, 25.60% foreign corporations, 19.13% financial institutions, 14.72% individuals and others, and 3.05% treasury stock.
Topics: Data Centers, Labor and Productivity
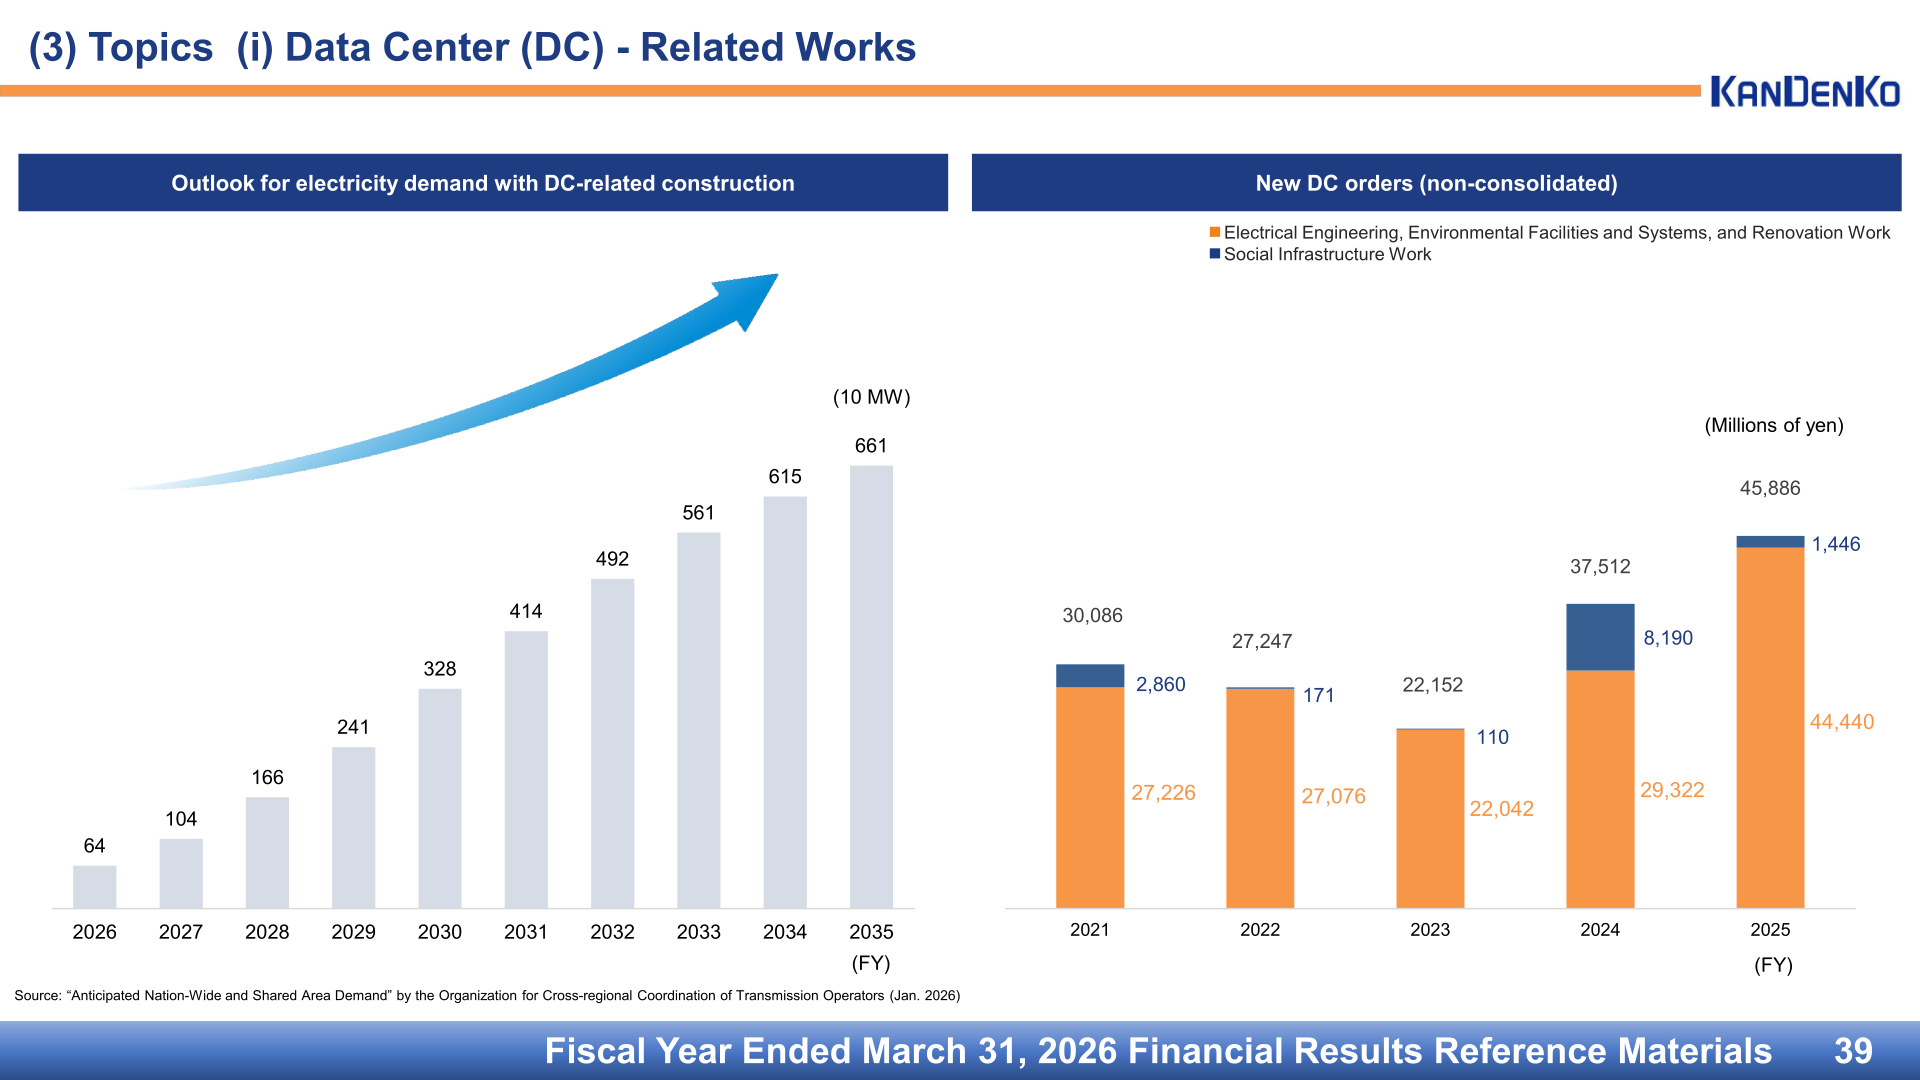
Kandenko highlights data center related works as a growth driver. New DC orders on a non-consolidated basis totalled 45,886 million yen in FY2025, comprising 44,440 million yen in electrical engineering, environmental facilities and systems, and renovation work and 1,446 million yen in social infrastructure work, compared with 37,512 million yen in FY2024. The company states that it receives the majority of orders relating to high-voltage and extra-high-voltage grid connection and underground power line projects in the TEPCO service area, that it possesses solutions in peripheral works such as dual power sources and installation of generators, and that construction of extra-high-voltage substations requires high technical capability in close collaboration with TEPCO.
On securing labor, the number of engineers and technicians at Kandenko on a non-consolidated basis rose to 6,432 in FY2025 from 6,223 in FY2024. On productivity, the non-consolidated gross profit margin on completed construction contracts reached 15.6% in FY2025 against 13.2% in FY2024, with gross profit on completed construction contracts of 99,406 million yen, and per capita gross profit on completed construction contracts of 15.5 million yen against 12.3 million yen. The company had 8,110 employees on a non-consolidated basis as of March 31, 2026, up 254 year on year, with capital of 10,264 million yen and 205,288,338 issued and outstanding shares.
This article is an analysis based on publicly available information and is not a recommendation to buy or sell any specific securities. Investment decisions are your own responsibility.
![[Obayashi] Investors’ Guide 2026 — The Complete 24-Article Breakdown](https://japan-equity.com/wp-content/uploads/2026/07/hub_cover-1024x1024.png)
![[Obayashi] IR & SR Policy — Feeding Dialogue Back into Management](https://japan-equity.com/wp-content/uploads/2026/07/p32_sq-1024x1024.jpg)
![[Obayashi] Real Estate Development — 18.7% Margin, ¥287.7bn Unrealized Gains](https://japan-equity.com/wp-content/uploads/2026/07/p20_sq-1024x1024.jpg)
![[Obayashi] Domestic Civil Engineering — Resilience Spending Supports 9.6% Margin](https://japan-equity.com/wp-content/uploads/2026/07/p11_sq-1024x1024.jpg)
![[Obayashi] Share Price & External Ratings — vs TOPIX, ESG Index Inclusion](https://japan-equity.com/wp-content/uploads/2026/07/p40_sq-1024x1024.jpg)
![[Construction] ¥75.5tn Investment, Shrinking Workforce — Big-5 Market Share](https://japan-equity.com/wp-content/uploads/2026/07/p12_sq-1024x1024.jpg)



![[Obayashi] Capital Policy & Shareholder Returns — ROE 10%+, DOE ~5%, ¥100bn Buyback](https://japan-equity.com/wp-content/uploads/2026/07/p27_sq-1024x1024.jpg)
![[Obayashi] Reducing Cross-Shareholdings — ¥285.2bn Sold in Five Years](https://japan-equity.com/wp-content/uploads/2026/07/p29_sq-1024x1024.jpg)
![[Obayashi] ¥750bn Investment Plan — ¥300bn to Development, ¥190bn to Tech/DX](https://japan-equity.com/wp-content/uploads/2026/07/p30_sq-1024x1024.jpg)
![[Obayashi] MTP2022 KPIs — Operating Profit ~2x Target, ROE 14.4%](https://japan-equity.com/wp-content/uploads/2026/07/p25_sq-1024x1024.jpg)
![[Obayashi] Cash Allocation — ¥420bn Investment CF Over Five Years](https://japan-equity.com/wp-content/uploads/2026/07/p26_sq-1024x1024.jpg)
![[Obayashi] Green Energy — 44 Plants, 344MW, and the Green Hydrogen Challenge](https://japan-equity.com/wp-content/uploads/2026/07/p21_sq-1024x1024.jpg)
![[Obayashi] Tackling the Labor Shortage — Robotics Construction®](https://japan-equity.com/wp-content/uploads/2026/07/p14_sq-1024x1024.jpg)
