
This article is based on publicly available IR materials and is not a recommendation to buy or sell any specific securities.
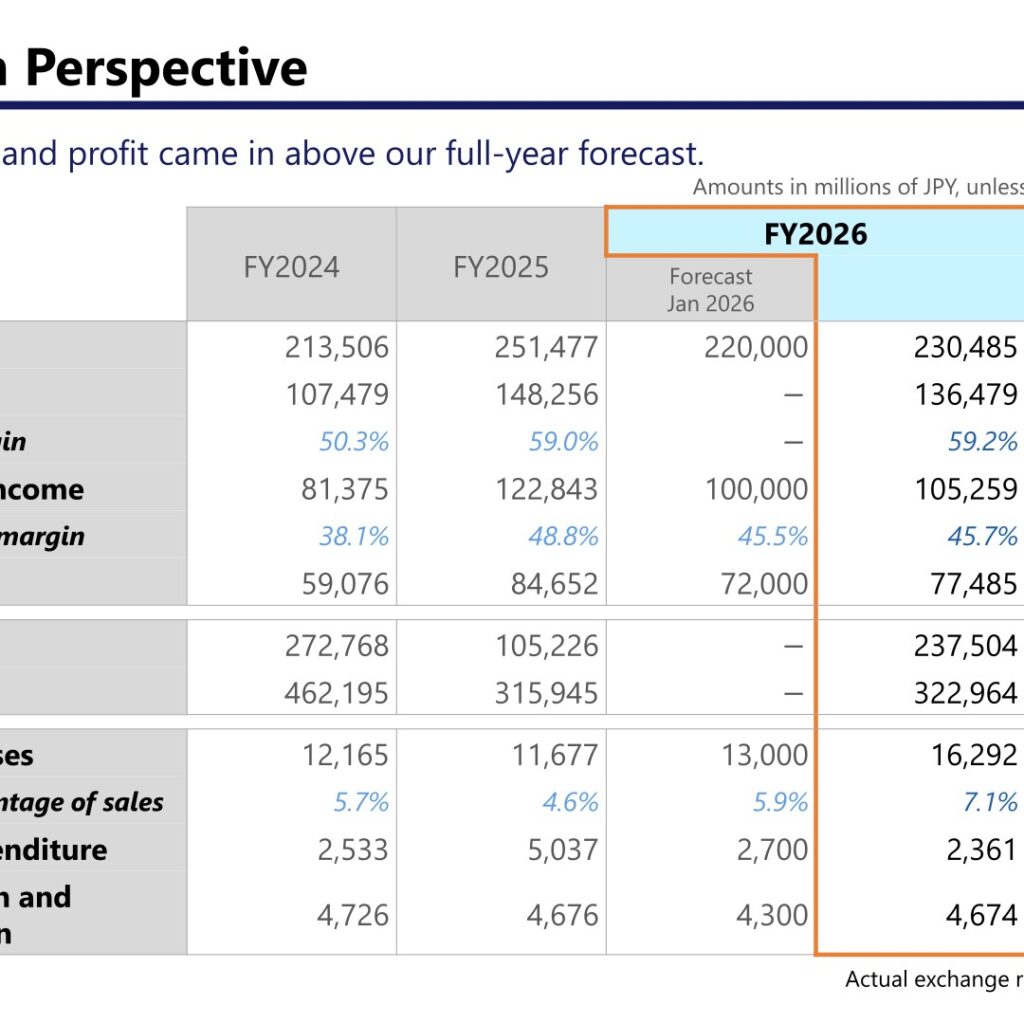
Note: Lasertec Corporation closes its books at the end of June, and the company labels the year ended June 30, 2026 as “FY2026”; this article keeps the company’s own fiscal-year labels throughout. For the year ended June 2026, net sales were 230,485 million yen, down 8.3% year on year, operating income was 105,259 million yen, down 14.3%, and net income was 77,485 million yen, down 8.5%. The presentation states that both net sales and profit came in above the company’s full-year forecast. Orders rebounded to 237,504 million yen, up 125.7% year on year, and the company expects sales and profits to reach record highs in FY2027.
Consolidated Results (Full-Year Actual)
Net sales of 230,485 million yen exceeded the 220,000 million yen forecast issued in January 2026, and operating income of 105,259 million yen exceeded the 100,000 million yen forecast. Gross profit was 136,479 million yen with a gross margin of 59.2%, up from 59.0% in FY2025, while the operating margin was 45.7% versus 48.8% a year earlier. R&D expenses rose 39.5% to 16,292 million yen, equivalent to 7.1% of sales, while capital expenditure fell 53.1% to 2,361 million yen. The actual exchange rate for the year was 150 JPY/USD.
| Item (millions of JPY) | FY2026 | FY2026 Forecast (Jan 2026) | FY2025 | YoY (vs FY2025) |
|---|---|---|---|---|
| Net Sales | 230,485 | 220,000 | 251,477 | (8.3%) |
| Gross profit | 136,479 | — | 148,256 | (7.9%) |
| Gross margin | 59.2% | — | 59.0% | — |
| Operating income | 105,259 | 100,000 | 122,843 | (14.3%) |
| Operating margin | 45.7% | 45.5% | 48.8% | — |
| Net income | 77,485 | 72,000 | 84,652 | (8.5%) |
| Orders | 237,504 | — | 105,226 | +125.7% |
| Backlog | 322,964 | — | 315,945 | +2.2% |
| R&D expenses | 16,292 | 13,000 | 11,677 | +39.5% |
| R&D percentage of sales | 7.1% | 5.9% | 4.6% | — |
| Capital expenditure | 2,361 | 2,700 | 5,037 | (53.1%) |
| Depreciation and amortization | 4,674 | 4,300 | 4,676 | (0.1%) |
On a quarterly basis, fourth-quarter net sales were 60,945 million yen, down 26.3% versus FY25 Q4 but up 47.6% versus FY26 Q3. Fourth-quarter operating income was 27,068 million yen with an operating margin of 44.4%, and net income was 20,662 million yen. Fourth-quarter R&D expenses of 5,752 million yen were up 40.3% year on year and represented 9.4% of quarterly sales.
Results by Product
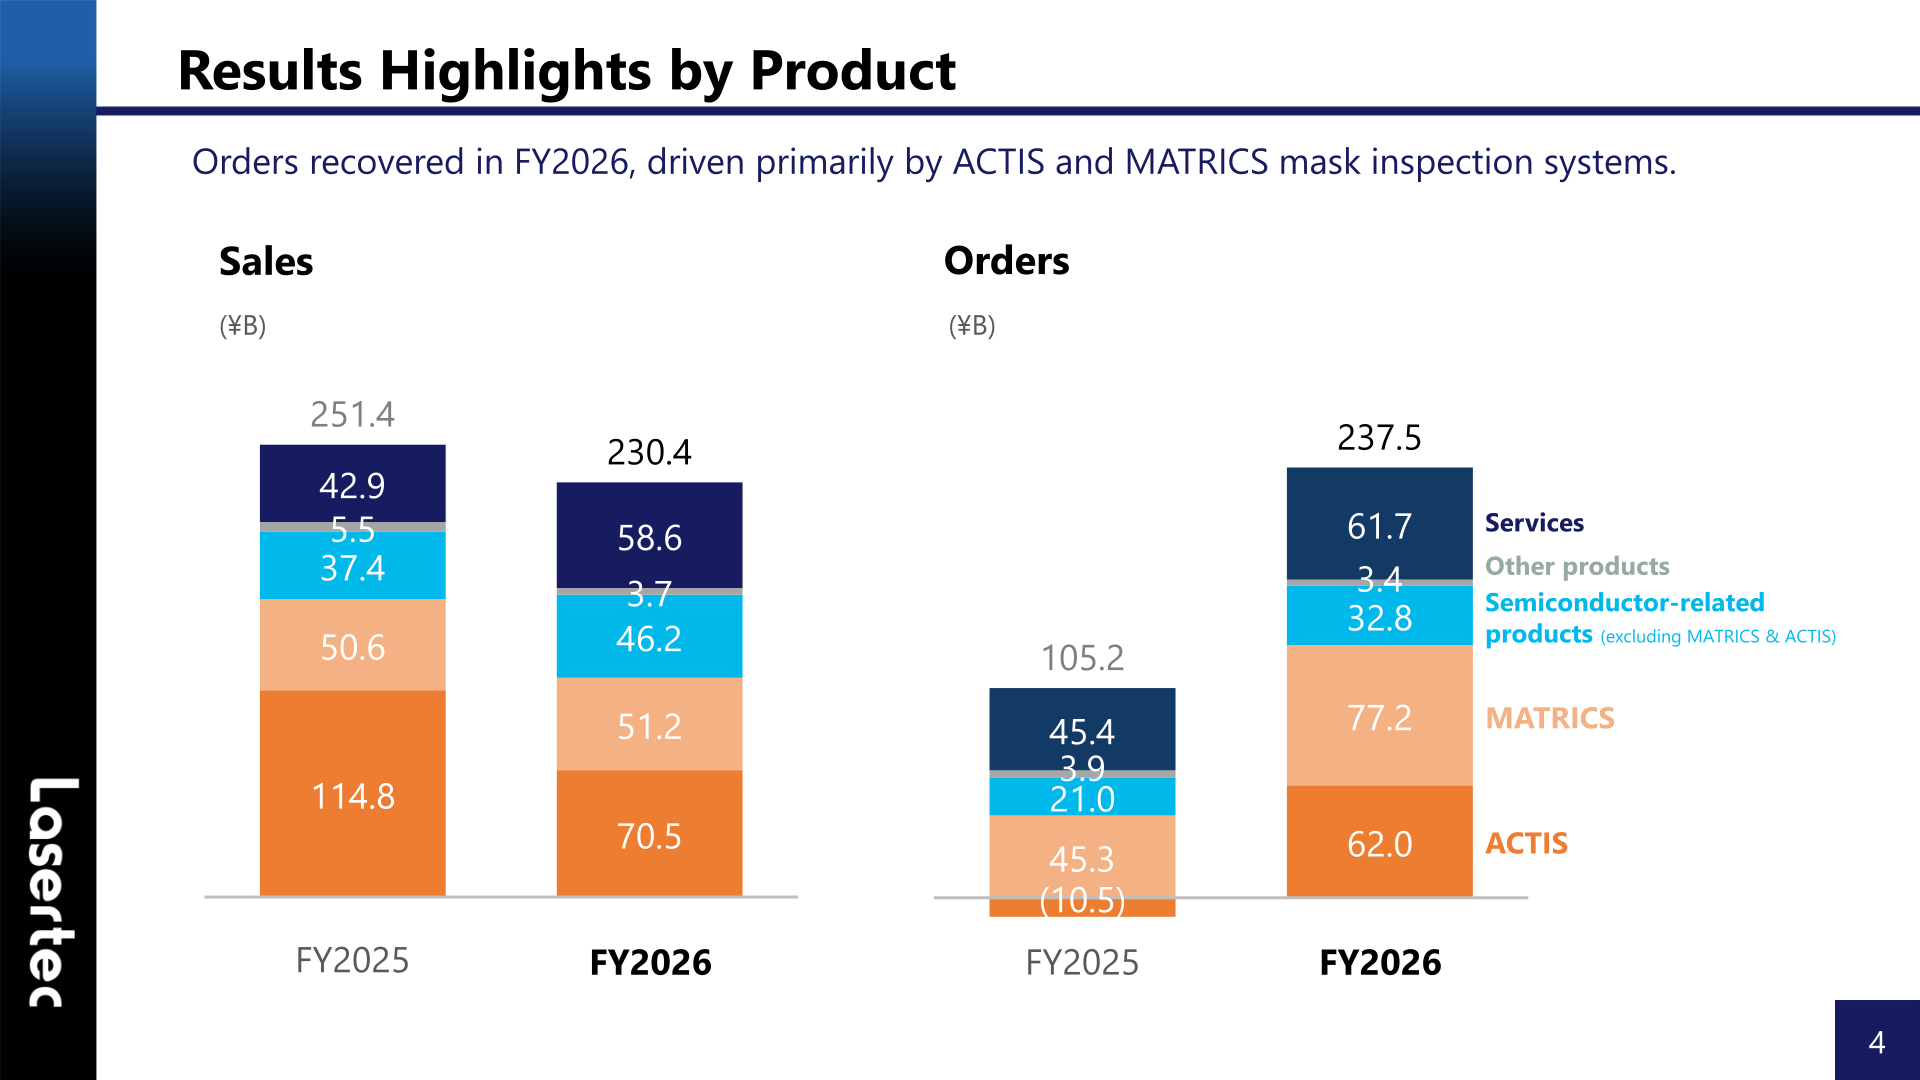
The presentation states that orders recovered in FY2026, driven primarily by ACTIS and MATRICS mask inspection systems. On the sales side, ACTIS declined from 114.8 billion yen to 70.5 billion yen, while services rose from 42.9 billion yen to 58.6 billion yen and MATRICS was broadly flat at 51.2 billion yen. On the order side, ACTIS swung from negative 10.5 billion yen in FY2025 to 62.0 billion yen, and MATRICS orders rose from 45.3 billion yen to 77.2 billion yen.
| Product category (¥B) | Sales FY2026 | Sales FY2025 | Orders FY2026 | Orders FY2025 |
|---|---|---|---|---|
| ACTIS | 70.5 | 114.8 | 62.0 | (10.5) |
| MATRICS | 51.2 | 50.6 | 77.2 | 45.3 |
| Semiconductor-related products (excluding MATRICS & ACTIS) | 46.2 | 37.4 | 32.8 | 21.0 |
| Other products | 3.7 | 5.5 | 3.4 | 3.9 |
| Services | 58.6 | 42.9 | 61.7 | 45.4 |
| Total | 230.4 | 251.4 | 237.5 | 105.2 |
Orders and Backlog
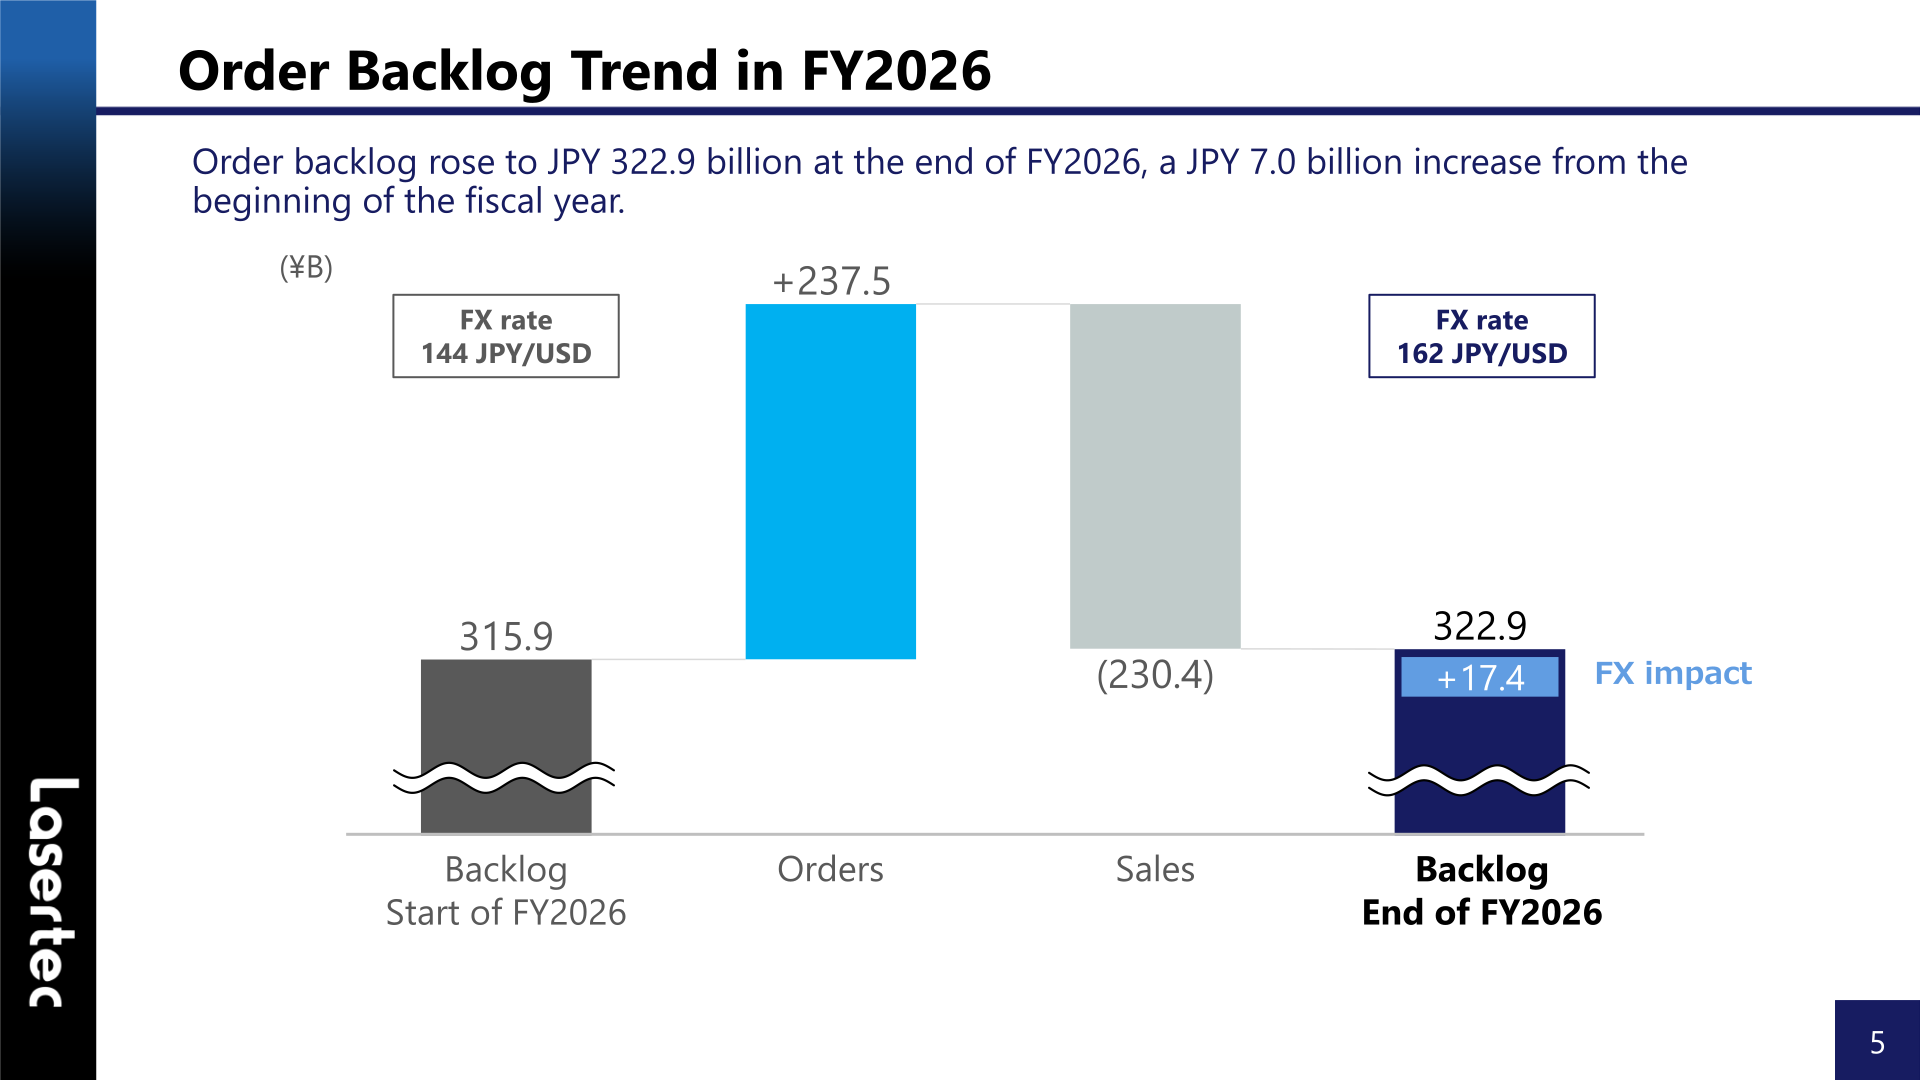
Order backlog rose to 322.9 billion yen at the end of FY2026, a 7.0 billion yen increase from the beginning of the fiscal year. The bridge shows an opening backlog of 315.9 billion yen, plus orders of 237.5 billion yen, less sales of 230.4 billion yen, plus an FX impact of 17.4 billion yen. The exchange rate used moved from 144 JPY/USD at the start of the year to 162 JPY/USD at the end.
On the balance sheet, net assets stood at 246.8 billion yen at the end of the fourth quarter, and the presentation notes that inventories remained elevated. Cash on hand was 91.5 billion yen at the end of the fourth quarter, and cash inflow from operating activities in the quarter amounted to 11.7 billion yen.
Business Environment and FY2027 Outlook
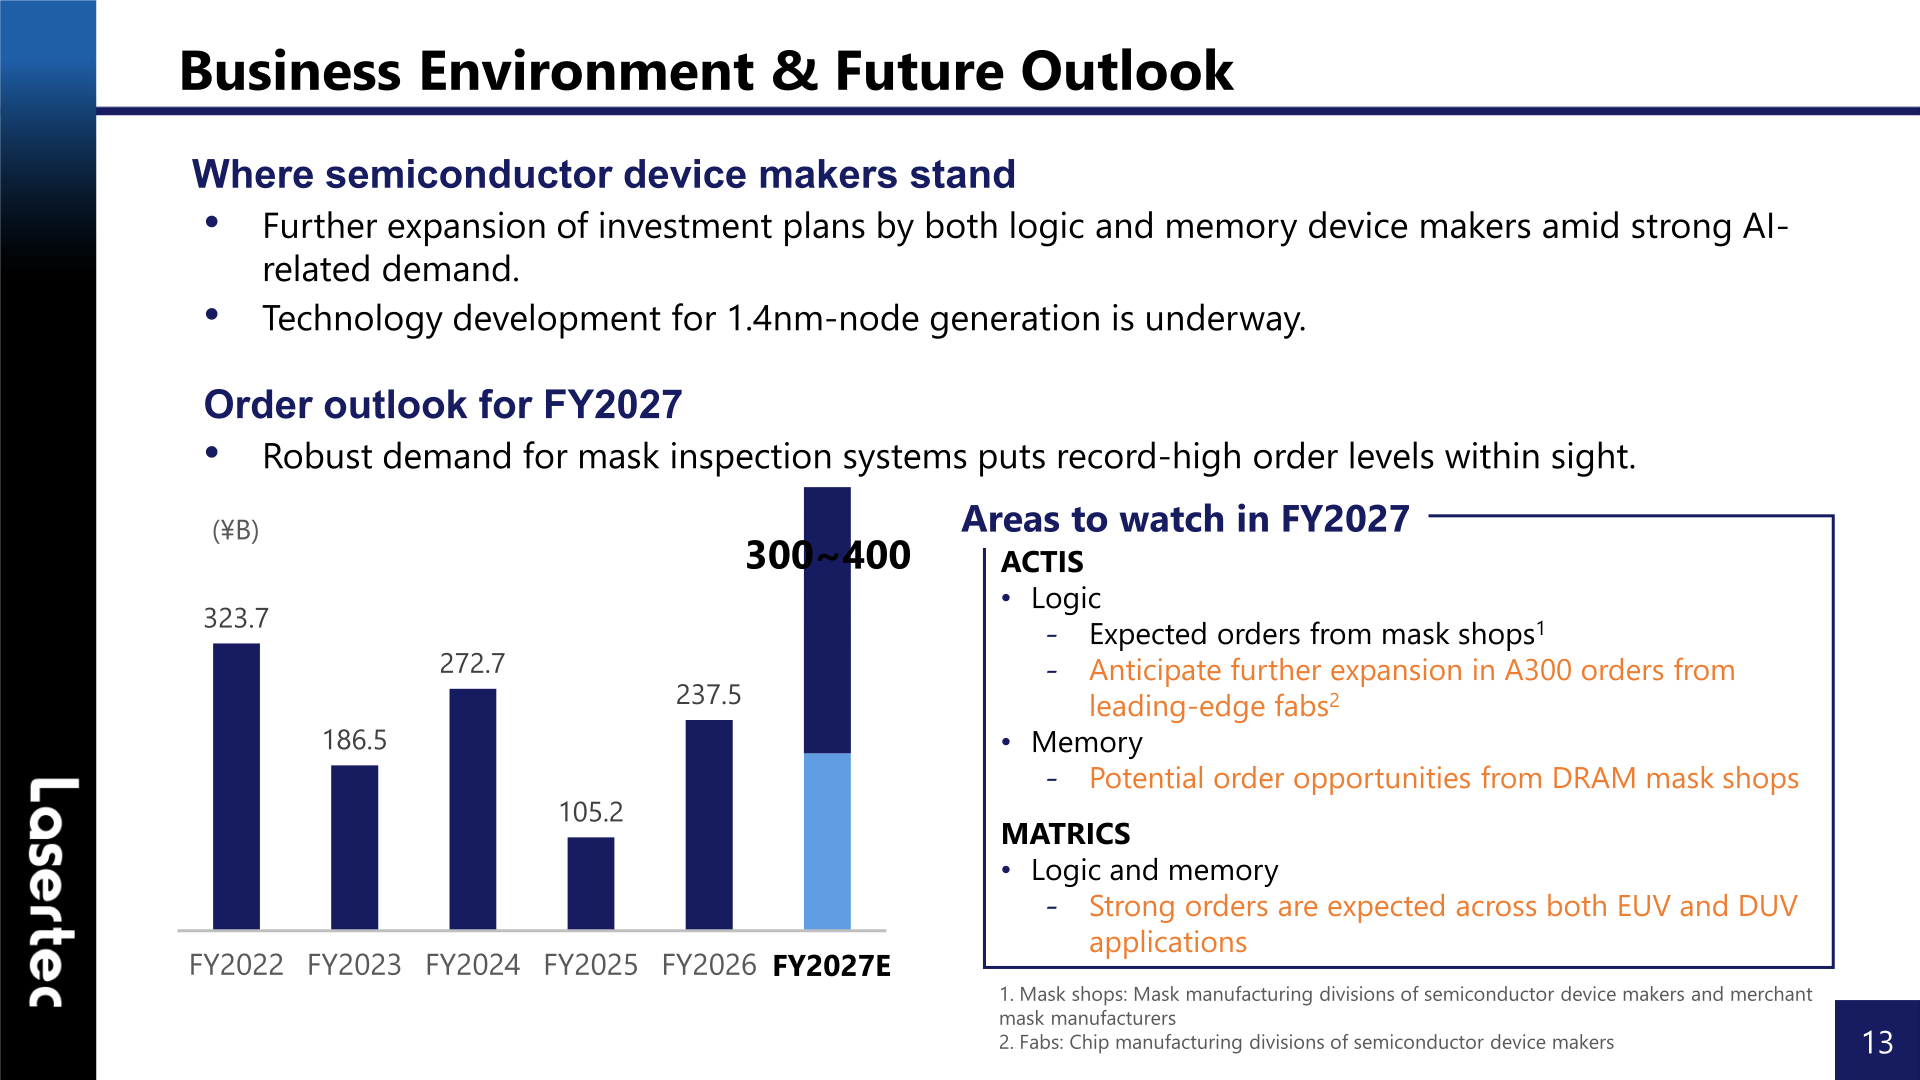
On the business environment, the company points to further expansion of investment plans by both logic and memory device makers amid strong AI-related demand, and notes that technology development for the 1.4nm-node generation is underway. For FY2027, it states that robust demand for mask inspection systems puts record-high order levels within sight, and presents an order outlook of 300 to 400 billion yen against actual orders of 323.7 billion yen in FY2022, 186.5 billion yen in FY2023, 272.7 billion yen in FY2024, 105.2 billion yen in FY2025 and 237.5 billion yen in FY2026.
Areas to watch in FY2027 are set out by product. For ACTIS, the company cites expected orders from logic mask shops and anticipates further expansion in A300 orders from leading-edge fabs, plus potential order opportunities from DRAM mask shops on the memory side. For MATRICS, it expects strong orders across both EUV and DUV applications in logic and memory. The presentation defines mask shops as the mask manufacturing divisions of semiconductor device makers and merchant mask manufacturers, and fabs as the chip manufacturing divisions of semiconductor device makers.
FY2027 Forecast
For the fiscal year ending June 2027, Lasertec forecasts net sales of 290,000 million yen, up 25.8%, operating income of 125,000 million yen, up 18.8%, and net income of 90,000 million yen, up 16.2%. The forecast assumes an exchange rate of 150 JPY/USD, unchanged from the FY2026 actual rate. The operating income bridge attributes the 19.7 billion yen increase to a 24.9 billion yen rise in gross profit, offset by a 3.7 billion yen increase in R&D expenses and a 1.5 billion yen increase in other SG&A. Headcount is planned to rise by 207 to 1,542, comprising 586 in Japan and 956 overseas.
| Item (millions of JPY) | FY2027 Forecast | FY2026 | FY2025 | YoY (vs FY2026) |
|---|---|---|---|---|
| Net sales | 290,000 | 230,485 | 251,477 | +25.8% |
| Semiconductor-related products | 225,000 | 168,090 | 202,965 | +33.9% |
| Other products | 3,500 | 3,747 | 5,552 | (6.6%) |
| Service | 61,500 | 58,646 | 42,959 | +4.9% |
| Operating income | 125,000 | 105,259 | 122,843 | +18.8% |
| Operating margin | 43.1% | 45.7% | 48.8% | — |
| Net income | 90,000 | 77,485 | 84,652 | +16.2% |
| R&D expenses | 20,000 | 16,292 | 11,677 | +22.8% |
| R&D percentage of sales | 6.9% | 7.1% | 4.6% | — |
| Capital expenditure | 5,700 | 2,361 | 5,037 | +141.3% |
| Depreciation and amortization | 3,600 | 4,674 | 4,676 | (23.0%) |
| Foreign exchange rate | 150 JPY/USD | 150 JPY/USD | 148 JPY/USD | — |
| Number of employees | 1,542 | 1,335 | 1,163 | +207 |
Shareholder Returns
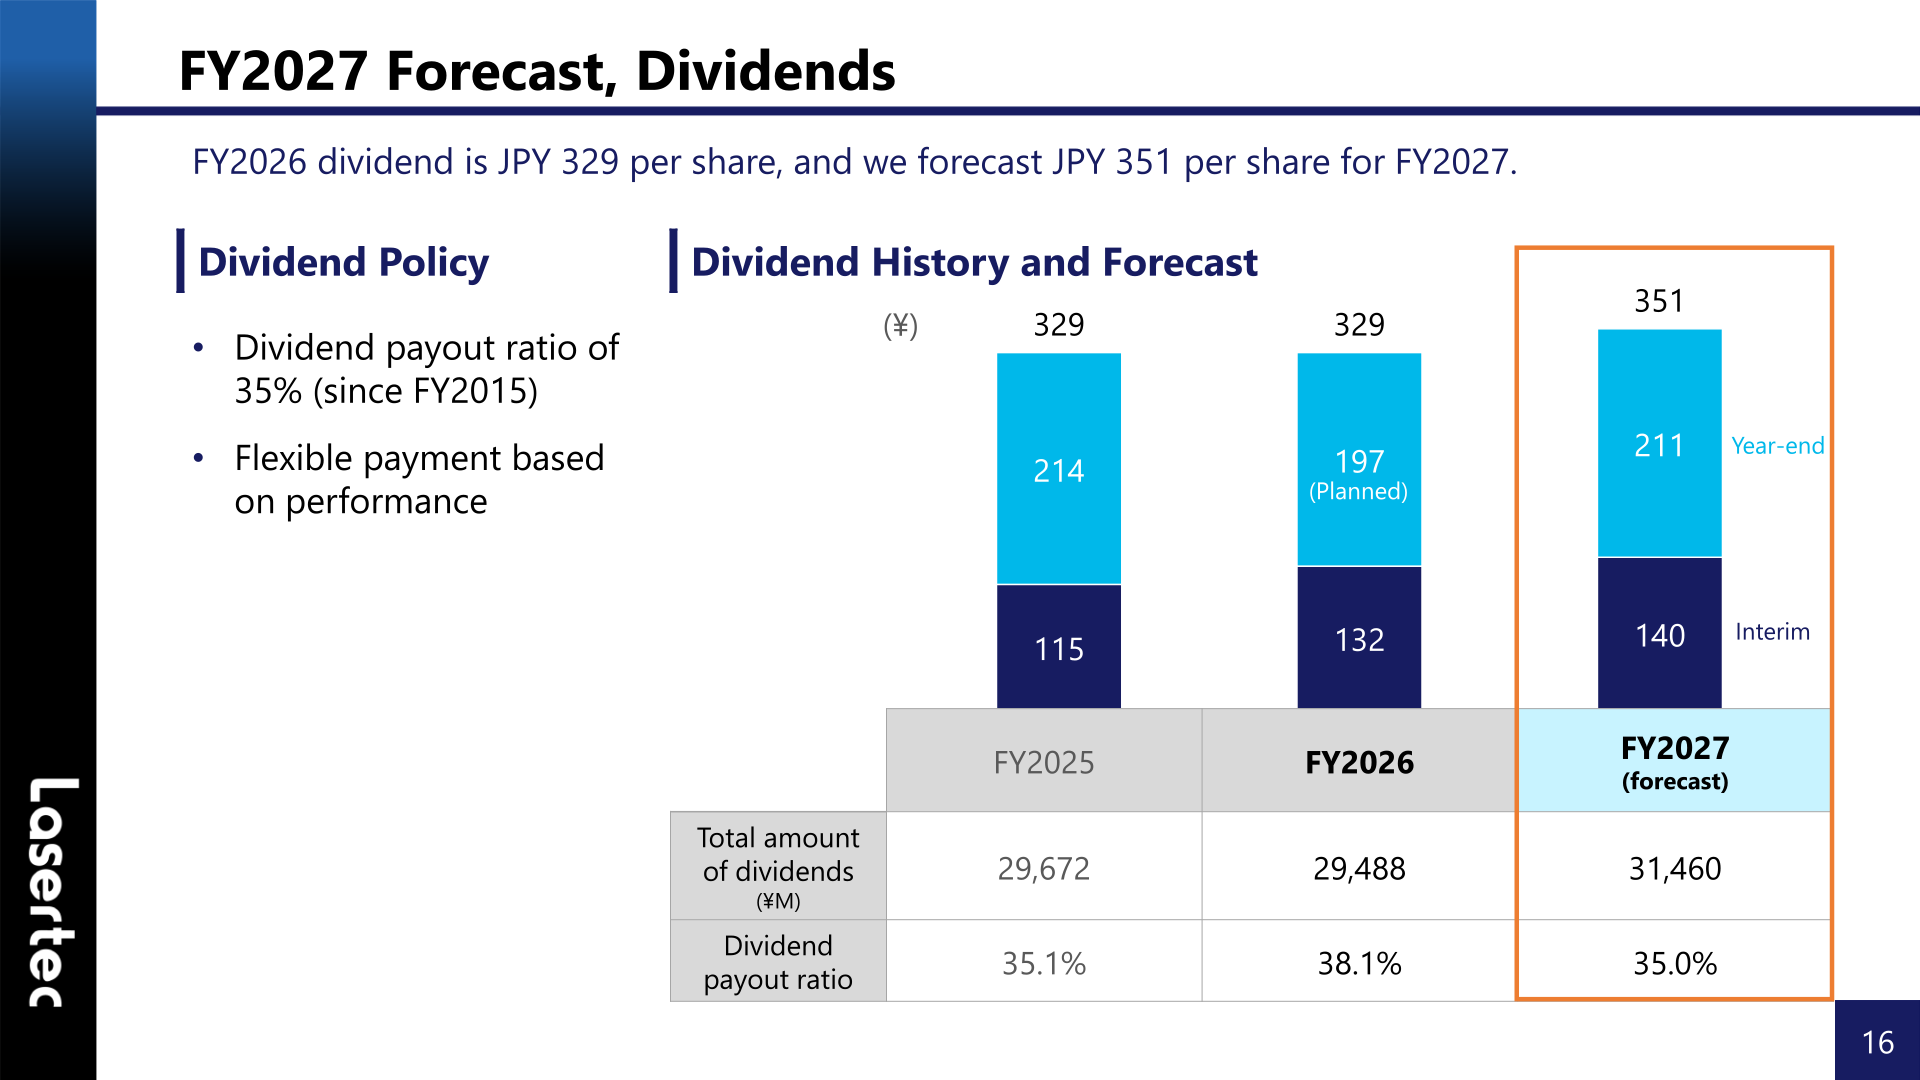
The stated dividend policy is a dividend payout ratio of 35% (since FY2015), with flexible payment based on performance. The FY2026 dividend is 329 yen per share, consisting of an interim dividend of 132 yen and a planned year-end dividend of 197 yen, for a total dividend amount of 29,488 million yen and a payout ratio of 38.1%. For FY2027 the company forecasts 351 yen per share, made up of a 140 yen interim dividend and a 211 yen year-end dividend, a total of 31,460 million yen and a payout ratio of 35.0%.
| Item | FY2025 | FY2026 | FY2027 (forecast) |
|---|---|---|---|
| Interim dividend per share (¥) | 115 | 132 | 140 |
| Year-end dividend per share (¥) | 214 | 197 (Planned) | 211 |
| Total dividend per share (¥) | 329 | 329 | 351 |
| Total amount of dividends (¥M) | 29,672 | 29,488 | 31,460 |
| Dividend payout ratio | 35.1% | 38.1% | 35.0% |
Other Key Indicators
R&D expenses exceeded the full-year forecast by 3.2 billion yen, reaching 16.2 billion yen against a 13.0 billion yen plan, a progress rate of 125.3%. Capital expenditure came in at 2.3 billion yen versus a 2.7 billion yen plan, a progress rate of 87.5%, and depreciation and amortization was 4.6 billion yen versus a 4.3 billion yen plan, a progress rate of 108.7%. The company states that hiring progressed broadly as planned, with employee numbers reaching 1,335 at the end of FY2026, of which 534 were in Japan (HQ) and 801 overseas.
This article is an analysis based on publicly available information and is not a recommendation to buy or sell any specific securities. Investment decisions are your own responsibility.
![[Obayashi] Investors’ Guide 2026 — The Complete 24-Article Breakdown](https://japan-equity.com/wp-content/uploads/2026/07/hub_cover-1024x1024.png)
![[Obayashi] IR & SR Policy — Feeding Dialogue Back into Management](https://japan-equity.com/wp-content/uploads/2026/07/p32_sq-1024x1024.jpg)
![[Obayashi] Domestic Civil Engineering — Resilience Spending Supports 9.6% Margin](https://japan-equity.com/wp-content/uploads/2026/07/p11_sq-1024x1024.jpg)
![[Obayashi] Overseas Construction — Orders Reach ¥1.2tn](https://japan-equity.com/wp-content/uploads/2026/07/p15_sq-1024x1024.jpg)
![[Obayashi] Share Price & External Ratings — vs TOPIX, ESG Index Inclusion](https://japan-equity.com/wp-content/uploads/2026/07/p40_sq-1024x1024.jpg)
![[Construction] ¥75.5tn Investment, Shrinking Workforce — Big-5 Market Share](https://japan-equity.com/wp-content/uploads/2026/07/p12_sq-1024x1024.jpg)



![[Obayashi] Capital Policy & Shareholder Returns — ROE 10%+, DOE ~5%, ¥100bn Buyback](https://japan-equity.com/wp-content/uploads/2026/07/p27_sq-1024x1024.jpg)
![[Obayashi] Reducing Cross-Shareholdings — ¥285.2bn Sold in Five Years](https://japan-equity.com/wp-content/uploads/2026/07/p29_sq-1024x1024.jpg)
![[Obayashi] ¥750bn Investment Plan — ¥300bn to Development, ¥190bn to Tech/DX](https://japan-equity.com/wp-content/uploads/2026/07/p30_sq-1024x1024.jpg)
![[Obayashi] MTP2022 KPIs — Operating Profit ~2x Target, ROE 14.4%](https://japan-equity.com/wp-content/uploads/2026/07/p25_sq-1024x1024.jpg)
![[Obayashi] Cash Allocation — ¥420bn Investment CF Over Five Years](https://japan-equity.com/wp-content/uploads/2026/07/p26_sq-1024x1024.jpg)
![[Obayashi] Green Energy — 44 Plants, 344MW, and the Green Hydrogen Challenge](https://japan-equity.com/wp-content/uploads/2026/07/p21_sq-1024x1024.jpg)
![[Obayashi] Tackling the Labor Shortage — Robotics Construction®](https://japan-equity.com/wp-content/uploads/2026/07/p14_sq-1024x1024.jpg)
