
This article is based on publicly available IR materials and is not a recommendation to buy or sell any specific securities.
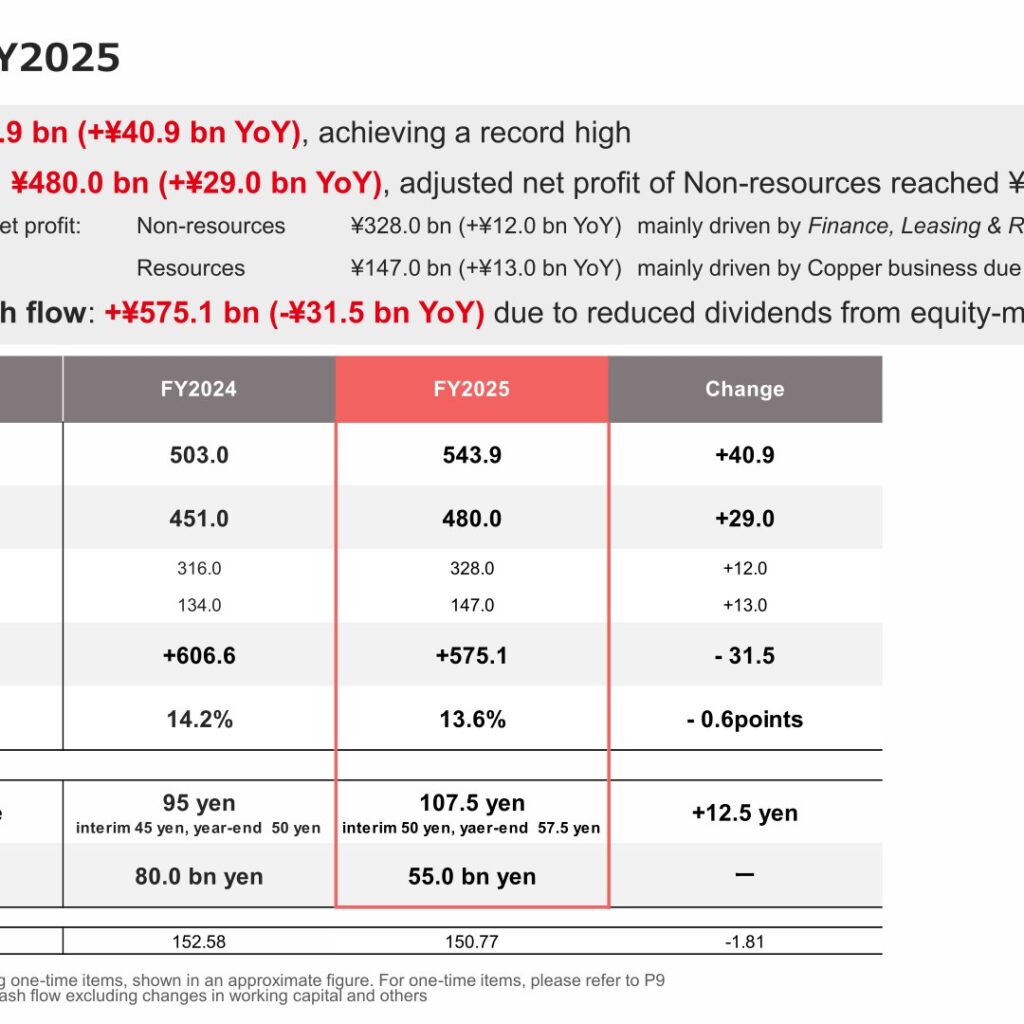
Marubeni Corporation (8002) reported net profit of ¥543.9 bn for FY2025 (fiscal year ended March 31, 2026), up ¥40.9 bn year on year and a record high. Adjusted net profit — net profit excluding one-time items — rose to ¥480.0 bn (+¥29.0 bn YoY), with Non-resources adjusted net profit reaching a record ¥328.0 bn. For FY2026, Marubeni forecasts net profit of ¥580.0 bn and adjusted net profit of ¥540.0 bn, both anticipated to reach record highs, and has raised its annual dividend forecast to ¥115 per share while resolving share buybacks of up to ¥45.0 bn.
Consolidated Results (Full-Year Actual)
Net profit for FY2025 was ¥543.9 bn, up ¥40.9 bn (8%) year on year. Adjusted net profit was ¥480.0 bn (+¥29.0 bn YoY): Non-resources adjusted net profit rose to ¥328.0 bn (+¥12.0 bn YoY), a record high, mainly driven by the Finance, Leasing & Real Estate Business, while Resources adjusted net profit rose to ¥147.0 bn (+¥13.0 bn YoY), mainly driven by the copper business amid higher commodity prices. Core operating cash flow was +¥575.1 bn, down ¥31.5 bn YoY due to reduced dividends from equity-method affiliates. ROE was 13.6%, down 0.6 points YoY. On an IFRS income-statement basis, revenue was ¥8,265.8 bn (+6% YoY), gross trading profit was ¥1,182.7 bn (+3% YoY), operating profit (loss) was ¥256.7 bn (-6% YoY), and profit before tax was ¥664.5 bn (+6% YoY).
| Item | FY2024 | FY2025 | Change |
|---|---|---|---|
| Net profit | 503.0 | 543.9 | +40.9 |
| Adjusted net profit | 451.0 | 480.0 | +29.0 |
| Non-resources | 316.0 | 328.0 | +12.0 |
| Resources | 134.0 | 147.0 | +13.0 |
| Core operating cash flow | +606.6 | +575.1 | -31.5 |
| ROE | 14.2% | 13.6% | -0.6 points |
| Annual dividend per share | 95 yen (interim 45, year-end 50) | 107.5 yen (interim 50, year-end 57.5) | +12.5 yen |
| Share buyback | 80.0 bn yen | 55.0 bn yen | ー |
| USD/JPY Term Average | 152.58 | 150.77 | -1.81 |
Segment Results
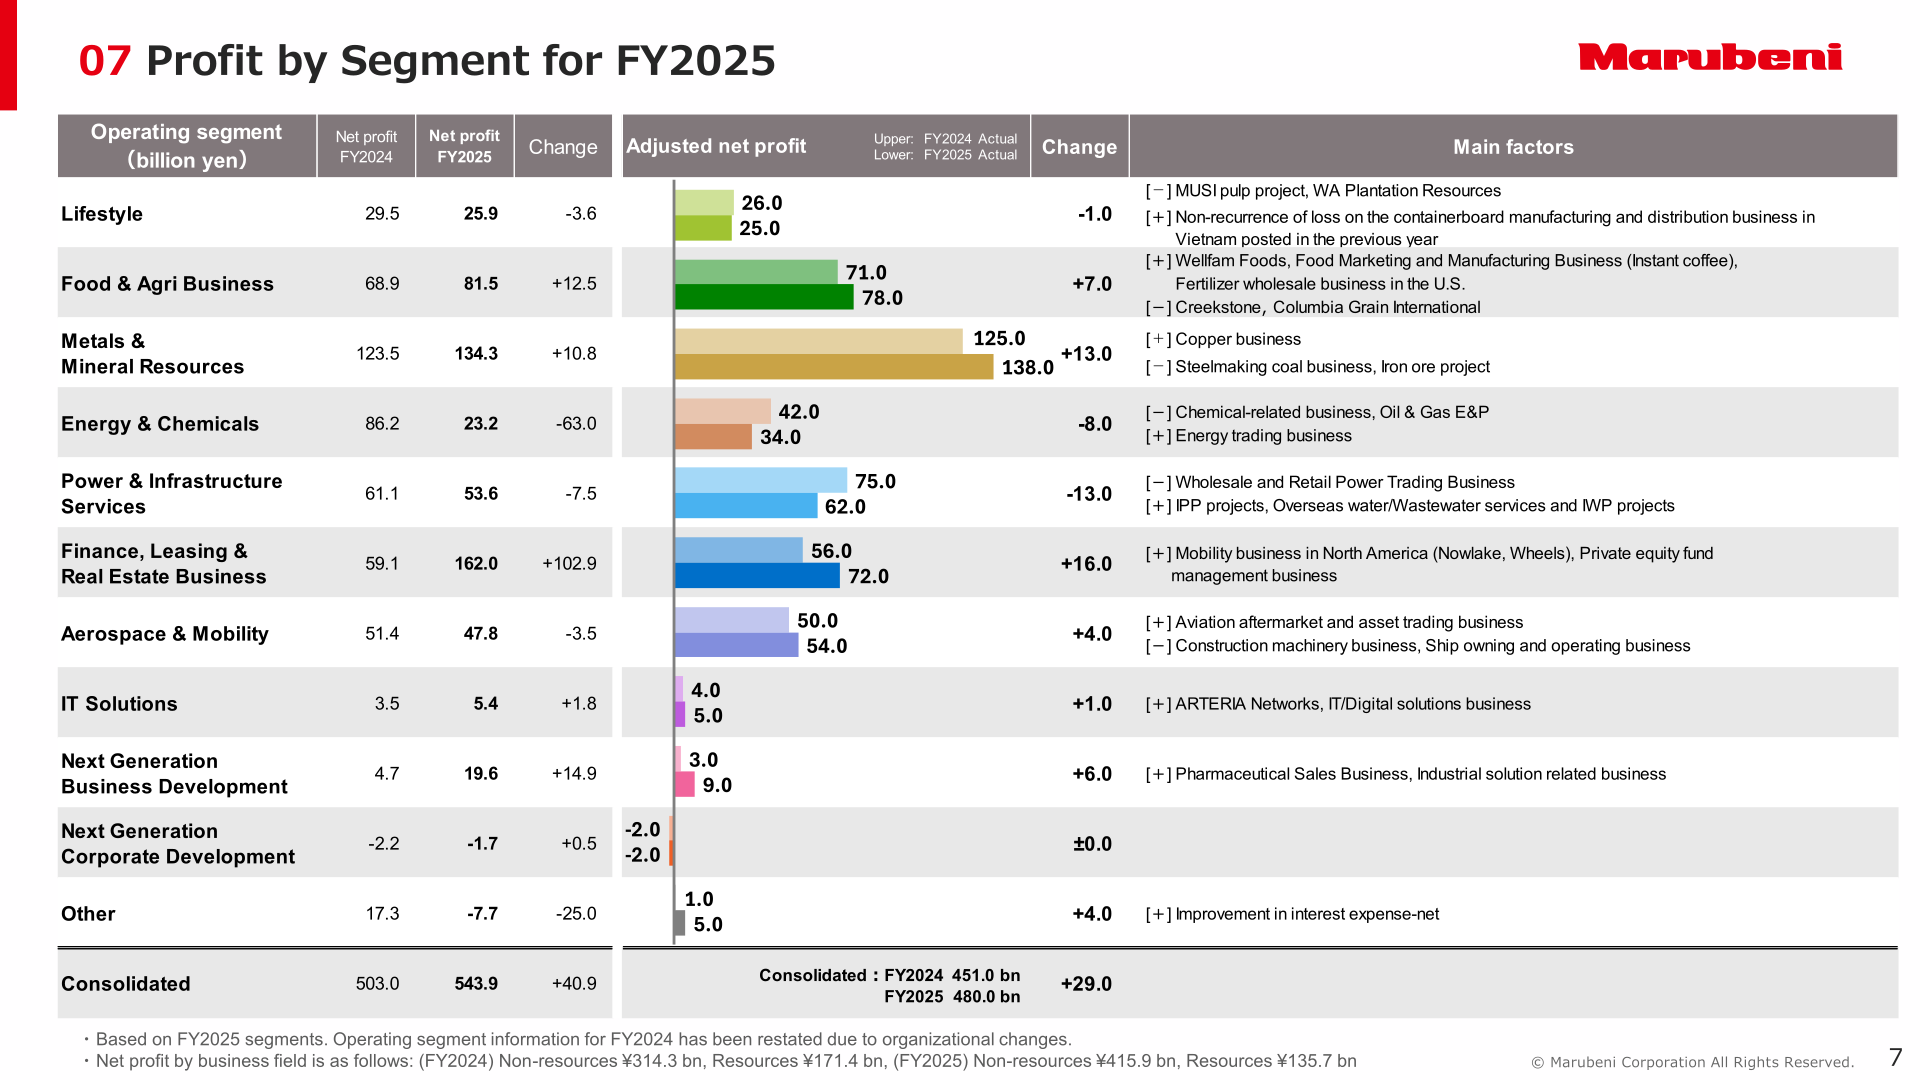
Marubeni reports results across eleven operating segments (FY2025 organization basis). Finance, Leasing & Real Estate Business was the largest driver of profit growth, with net profit up ¥102.9 bn to ¥162.0 bn, reflecting a valuation gain from the integration of the domestic real estate business with Dai-ichi Life Holdings, Inc. (currently Daiichi Life Group, Inc.), a gain on sale of the North American railcar leasing business, and increased profits from the mobility business in North America and the aircraft leasing business. Food & Agri Business net profit rose ¥12.5 bn to ¥81.5 bn, and Metals & Mineral Resources rose ¥10.8 bn to ¥134.3 bn on higher profit from the copper business. Energy & Chemicals net profit fell ¥63.0 bn to ¥23.2 bn, mainly due to the absence of a prior-year realized gain from foreign currency translation adjustments tied to the end of the Qatar LNG project, an impairment loss on property, plant and equipment for oil and gas E&P, and lower profit from petrochemical products trading. Power & Infrastructure Services net profit fell ¥7.5 bn to ¥53.6 bn on lower profit from the wholesale and retail power trading business and an impairment loss on the geothermal IPP project in Indonesia.
| Segment | FY2024 | FY2025 | Change |
|---|---|---|---|
| Lifestyle | 29.5 | 25.9 | -3.6 |
| Food & Agri Business | 68.9 | 81.5 | +12.5 |
| Metals & Mineral Resources | 123.5 | 134.3 | +10.8 |
| Energy & Chemicals | 86.2 | 23.2 | -63.0 |
| Power & Infrastructure Services | 61.1 | 53.6 | -7.5 |
| Finance, Leasing & Real Estate Business | 59.1 | 162.0 | +102.9 |
| Aerospace & Mobility | 51.4 | 47.8 | -3.5 |
| IT Solutions | 3.5 | 5.4 | +1.8 |
| Next Generation Business Development | 4.7 | 19.6 | +14.9 |
| Next Generation Corporate Development | -2.2 | -1.7 | +0.5 |
| Other | 17.3 | -7.7 | -25.0 |
| Consolidated | 503.0 | 543.9 | +40.9 |
FY2026 Forecast
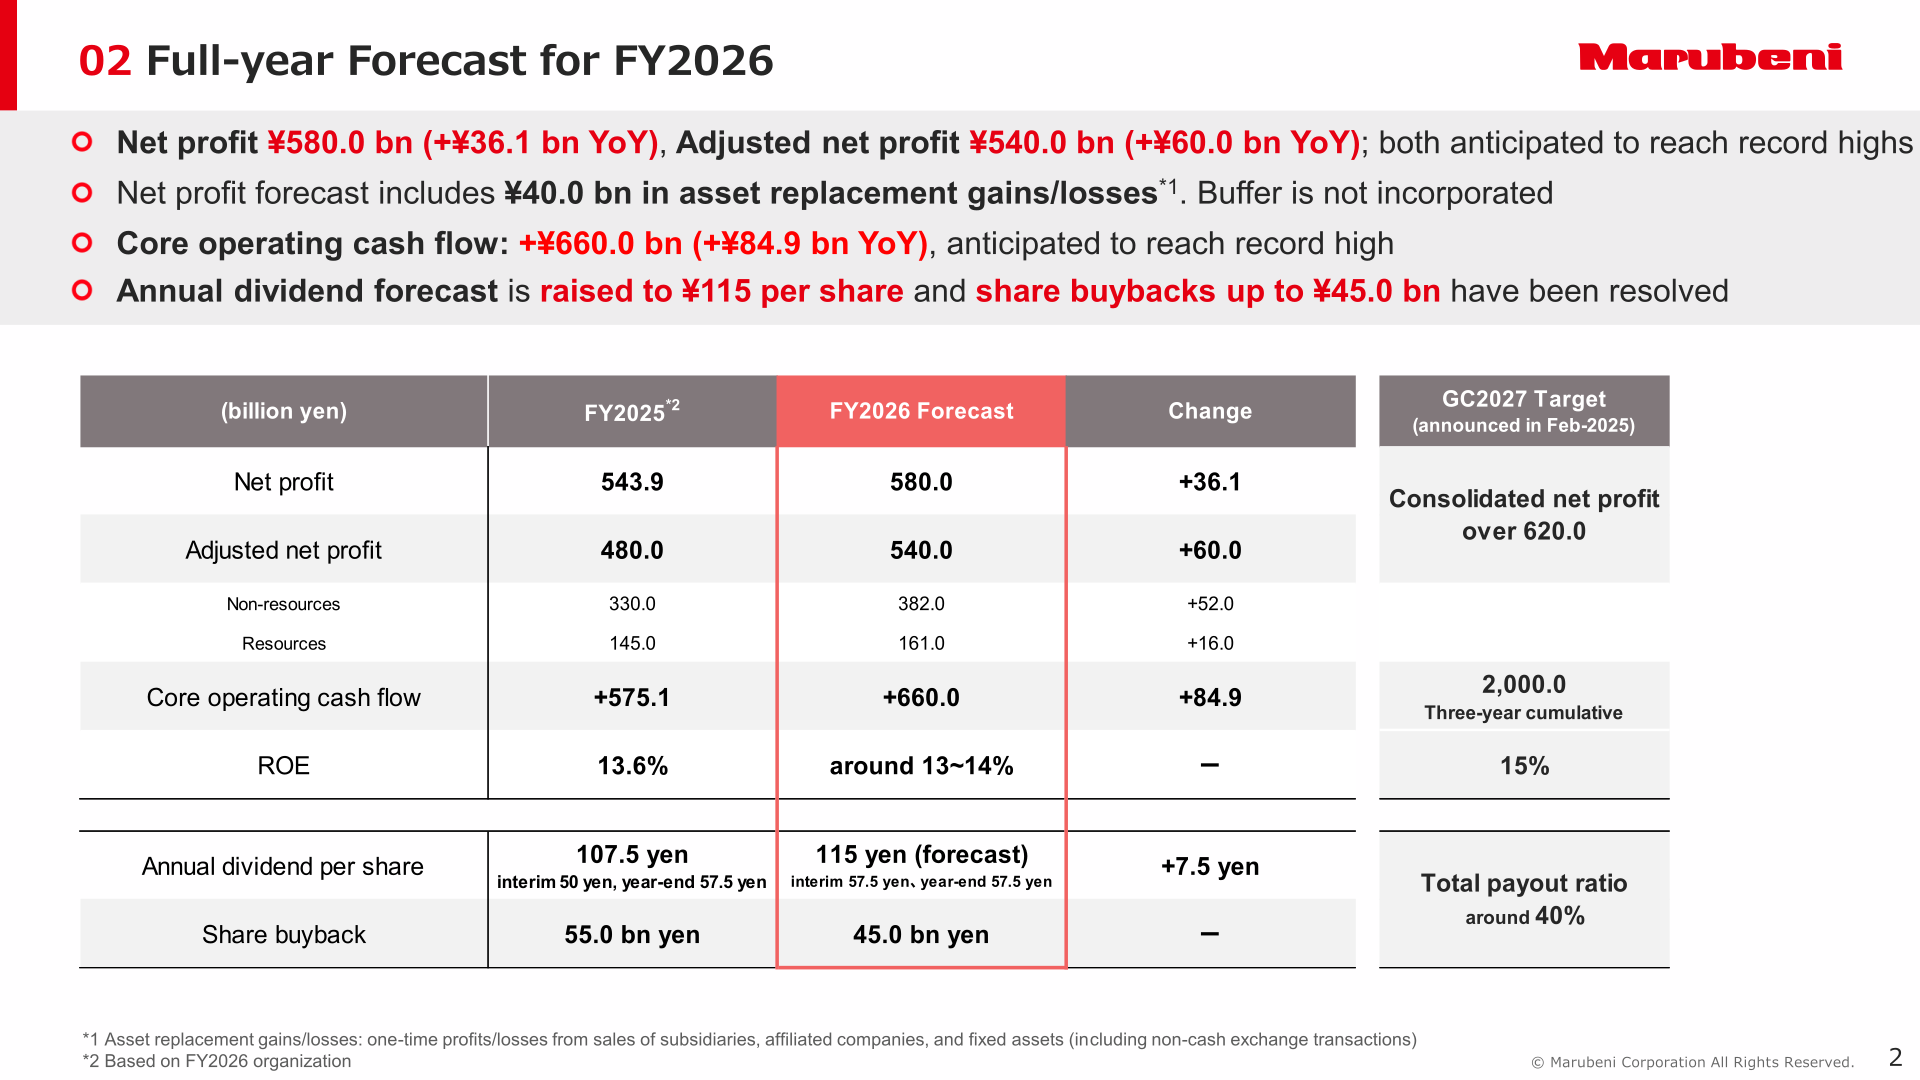
For FY2026, Marubeni forecasts net profit of ¥580.0 bn (+¥36.1 bn YoY) and adjusted net profit of ¥540.0 bn (+¥60.0 bn YoY), both anticipated to reach record highs. The net profit forecast includes approximately ¥40.0 bn in asset replacement gains/losses, with no buffer incorporated. On a FY2026-organization basis, Non-resources adjusted net profit is forecast at ¥382.0 bn (+¥52.0 bn YoY) and Resources at ¥161.0 bn (+¥16.0 bn YoY). Core operating cash flow is forecast at +¥660.0 bn (+¥84.9 bn YoY), also a record high. ROE is expected to be around 13~14%.
| Item | FY2025 | FY2026 Forecast | Change |
|---|---|---|---|
| Net profit | 543.9 | 580.0 | +36.1 |
| Adjusted net profit | 480.0 | 540.0 | +60.0 |
| Non-resources | 330.0 | 382.0 | +52.0 |
| Resources | 145.0 | 161.0 | +16.0 |
| Core operating cash flow | +575.1 | +660.0 | +84.9 |
| ROE | 13.6% | around 13~14% | ー |
| Annual dividend per share | 107.5 yen (interim 50, year-end 57.5) | 115 yen (forecast) (interim 57.5, year-end 57.5) | +7.5 yen |
| Share buyback | 55.0 bn yen | 45.0 bn yen | ー |
| Total payout ratio | – | around 40% | – |
Shareholder Returns
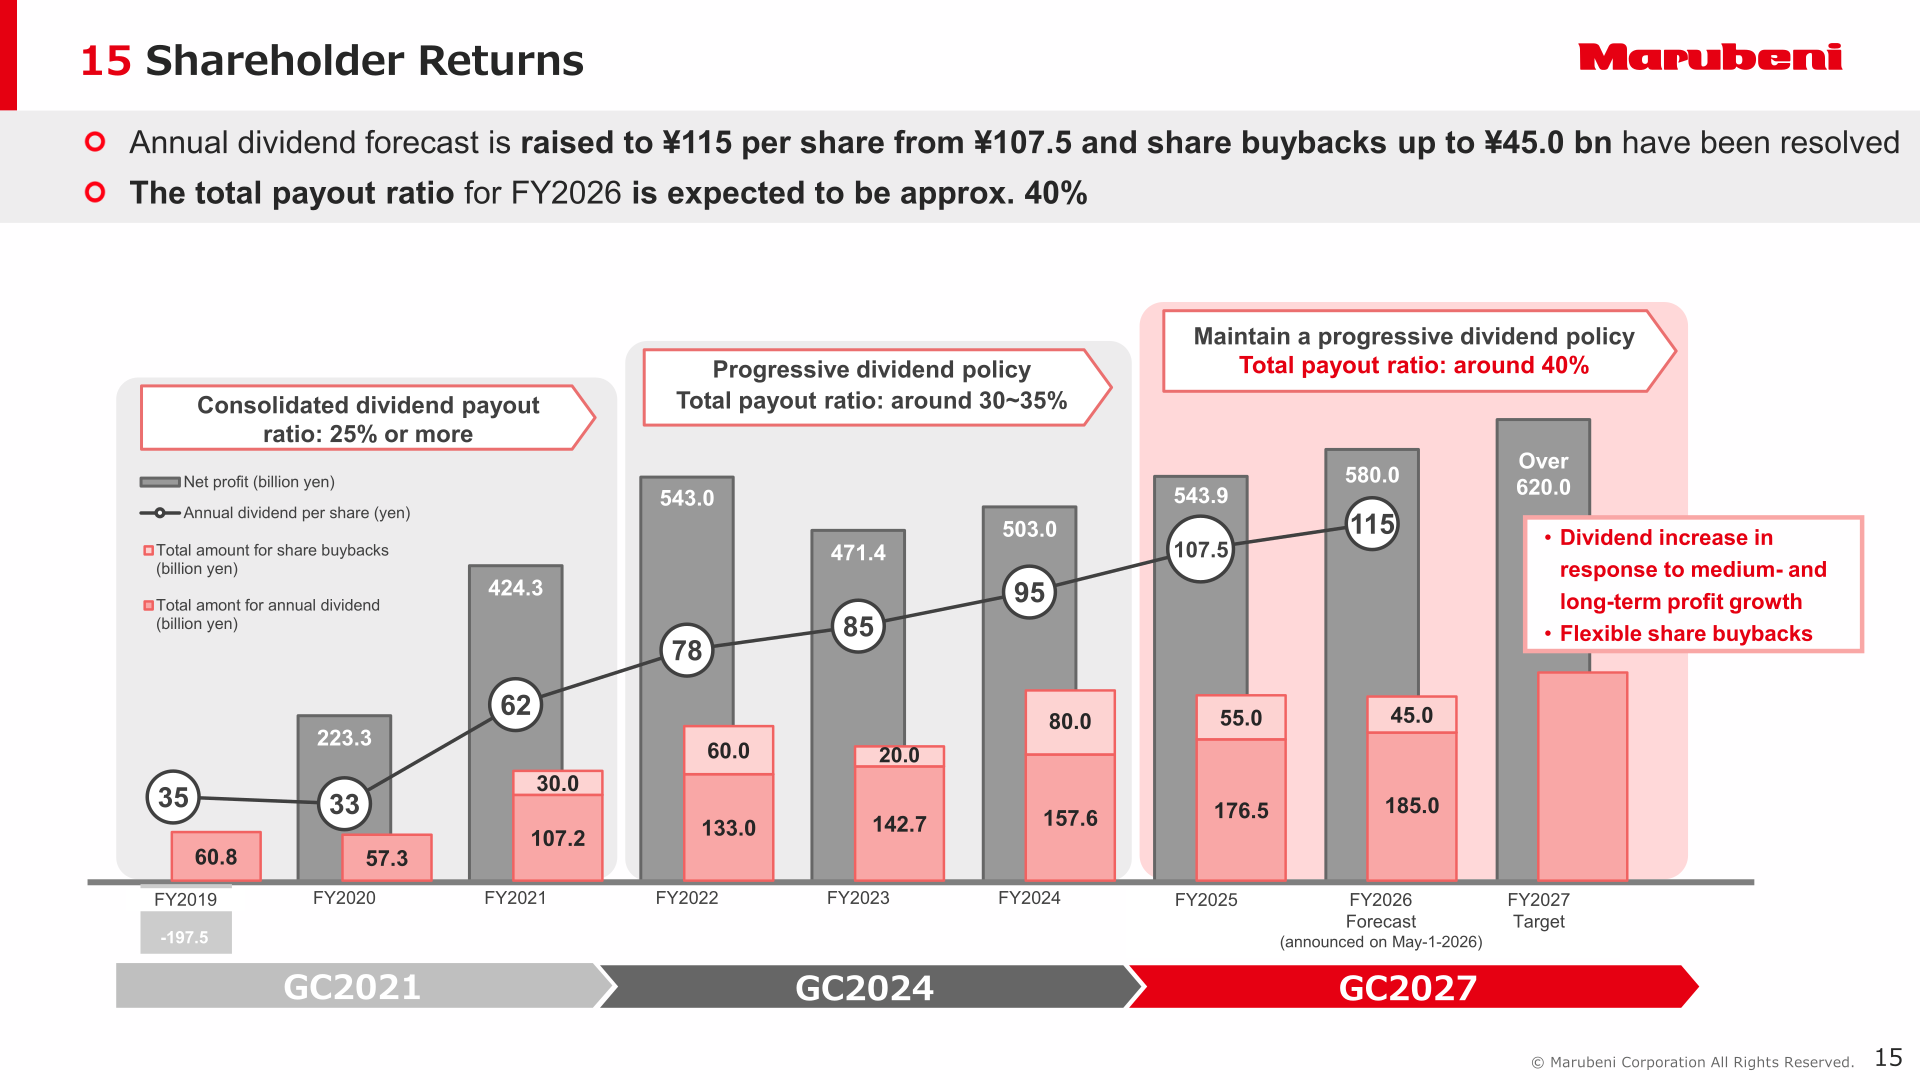
Marubeni raised its FY2026 annual dividend forecast to ¥115 per share (interim ¥57.5, year-end ¥57.5), up from the FY2025 actual of ¥107.5 per share (interim ¥50, year-end ¥57.5). Share buybacks of up to ¥45.0 bn have been resolved for FY2026, including ¥15.0 bn announced on February 4, 2026, following FY2025 buybacks of ¥55.0 bn (down from ¥80.0 bn in FY2024). The total payout ratio for FY2026 is expected to be approximately 40%. Marubeni’s capital allocation policy is to maintain a progressive dividend policy with a total payout ratio of around 40% and a consolidated dividend payout ratio of 25% or more.
| Item | FY2025 Actual | FY2026 Forecast |
|---|---|---|
| Annual dividend per share | 107.5 yen (interim 50, year-end 57.5) | 115 yen (forecast) (interim 57.5, year-end 57.5) |
| Share buyback | 55.0 bn yen | 45.0 bn yen (incl. ¥15.0 bn announced Feb 4, 2026) |
| Total payout ratio | – | around 40% |
Medium-Term Plan / Topics
Under its GC2027 medium-term management plan (announced February 2025), Marubeni targets, on a three-year cumulative basis, core operating cash flow of ¥2,000.0 bn, divestments of ¥600.0 bn, shareholder distributions of ¥700.0 bn, and new investments/CAPEX and others of ¥1,700.0 bn. Two-year cumulative progress against these targets (through the FY2026 forecast) stands at core operating cash flow of ¥1,235.1 bn (62%), divestments of ¥506.8 bn (84%), shareholder distributions of ¥461.5 bn (66%), and new investments/CAPEX and others of ¥1,064.9 bn (63%). GC2027 also targets consolidated net profit of over ¥620.0 bn, ROE of around 15%, a total payout ratio of around 40%, and a Non-resources ROIC target of over 10% toward FY2030. Marubeni newly added the Pharmaceutical Sales Business to its Core Strategic Platform Businesses (core SPBs) in FY2025. Combined adjusted net profit from the seven core SPBs was ¥131.0 bn in FY2025 (+¥2.0 bn YoY, ROIC 10%), forecast to rise to ¥164.0 bn in FY2026 (ROIC around 11%). Marubeni’s market capitalization reached ¥10 tn on February 10, 2026, achieving the GC2027 market-cap target ahead of schedule and placing the company in the global top 400 by market capitalization, with a long-term target of ranking among the global top 100. In November 2025, S&P upgraded Marubeni’s long-term issuer rating from BBB+ to A- (Stable).
This article is an analysis based on publicly available information and is not a recommendation to buy or sell any specific securities. Investment decisions are your own responsibility.
![[Obayashi] Investors’ Guide 2026 — The Complete 24-Article Breakdown](https://japan-equity.com/wp-content/uploads/2026/07/hub_cover-1024x1024.png)
![[Obayashi] IR & SR Policy — Feeding Dialogue Back into Management](https://japan-equity.com/wp-content/uploads/2026/07/p32_sq-1024x1024.jpg)
![[Obayashi] Domestic Civil Engineering — Resilience Spending Supports 9.6% Margin](https://japan-equity.com/wp-content/uploads/2026/07/p11_sq-1024x1024.jpg)
![[Obayashi] Overseas Construction — Orders Reach ¥1.2tn](https://japan-equity.com/wp-content/uploads/2026/07/p15_sq-1024x1024.jpg)
![[Obayashi] Share Price & External Ratings — vs TOPIX, ESG Index Inclusion](https://japan-equity.com/wp-content/uploads/2026/07/p40_sq-1024x1024.jpg)
![[Construction] ¥75.5tn Investment, Shrinking Workforce — Big-5 Market Share](https://japan-equity.com/wp-content/uploads/2026/07/p12_sq-1024x1024.jpg)



![[Obayashi] Capital Policy & Shareholder Returns — ROE 10%+, DOE ~5%, ¥100bn Buyback](https://japan-equity.com/wp-content/uploads/2026/07/p27_sq-1024x1024.jpg)
![[Obayashi] Reducing Cross-Shareholdings — ¥285.2bn Sold in Five Years](https://japan-equity.com/wp-content/uploads/2026/07/p29_sq-1024x1024.jpg)
![[Obayashi] ¥750bn Investment Plan — ¥300bn to Development, ¥190bn to Tech/DX](https://japan-equity.com/wp-content/uploads/2026/07/p30_sq-1024x1024.jpg)
![[Obayashi] MTP2022 KPIs — Operating Profit ~2x Target, ROE 14.4%](https://japan-equity.com/wp-content/uploads/2026/07/p25_sq-1024x1024.jpg)
![[Obayashi] Cash Allocation — ¥420bn Investment CF Over Five Years](https://japan-equity.com/wp-content/uploads/2026/07/p26_sq-1024x1024.jpg)
![[Obayashi] Green Energy — 44 Plants, 344MW, and the Green Hydrogen Challenge](https://japan-equity.com/wp-content/uploads/2026/07/p21_sq-1024x1024.jpg)
![[Obayashi] Tackling the Labor Shortage — Robotics Construction®](https://japan-equity.com/wp-content/uploads/2026/07/p14_sq-1024x1024.jpg)
