

This article is based on publicly available IR materials and is not a recommendation to buy or sell any specific securities.
Nissan Motor reported FY2025 (fiscal year ended March 31, 2026) consolidated net revenue of 12,007.9 billion yen, down from 12,633.2 billion yen in FY2024, with operating profit of 58.0 billion yen (0.5% margin), versus 69.8 billion yen (0.6% margin) a year earlier. Net loss attributable to owners of the parent narrowed to 533.1 billion yen from 670.9 billion yen in FY2024. Global retail sales volume declined 5.8% year on year to 3,151 thousand units. For FY2026, Nissan guides to net revenue of 13,000.0 billion yen, operating profit of 200.0 billion yen (1.5% margin), and a return to net income of 20.0 billion yen, supported by continued cost savings under the Re:Nissan plan.
Consolidated Results (Full-Year Actual)
Consolidated net revenue declined 625.3 billion yen year on year to 12,007.9 billion yen, and operating profit fell 11.8 billion yen to 58.0 billion yen (0.5% margin, down 0.1 point). Ordinary profit fell to 1.1 billion yen from 210.2 billion yen, and profit before tax was -440.4 billion yen (down 26.8 billion yen). Net income attributable to owners of the parent improved by 137.8 billion yen to a loss of 533.1 billion yen. The average exchange rate was 151 yen/USD in FY2025 versus 153 yen/USD in FY2024, and 175 yen/EUR versus 164 yen/EUR.
| Item | FY2025 | FY2024 | Change |
|---|---|---|---|
| Net Revenue (billion yen) | 12,007.9 | 12,633.2 | -625.3 |
| Operating Profit (billion yen, margin) | 58.0 (0.5%) | 69.8 (0.6%) | -11.8 |
| Ordinary Profit (billion yen) | 1.1 | 210.2 | -209.1 |
| Profit Before Tax (billion yen) | -440.4 | -413.6 | -26.8 |
| Net Income attributable to owners of the parent (billion yen) | -533.1 | -670.9 | +137.8 |
Segment Results
In the Automobile & Eliminations segment, net revenue declined to 10,689.9 billion yen from 11,371.1 billion yen, and operating loss widened to -239.9 billion yen (-2.2% margin) from -215.9 billion yen (-1.9% margin). Automotive free cash flow was -480.8 billion yen, compared with -242.8 billion yen in FY2024, while auto net cash decreased to 1,170.4 billion yen from 1,498.4 billion yen. In the Sales Financing business (Source: P.31), total assets rose to 10,726.8 billion yen from 10,145.6 billion yen, net revenue rose to 1,318.0 billion yen from 1,262.1 billion yen, and operating profit rose to 297.9 billion yen from 285.6 billion yen, mainly due to a one-time loss provision reversal, despite negative foreign exchange impact. Penetration declined to 41% from 45% amid intensified market competition, and the net credit loss ratio rose to 0.75% from 0.63%, in line with the industry.
| Segment | Metric | FY2025 | FY2024 |
|---|---|---|---|
| Automobile & Eliminations | Net Revenue (billion yen) | 10,689.9 | 11,371.1 |
| Automobile & Eliminations | Operating Profit (billion yen, margin) | -239.9 (-2.2%) | -215.9 (-1.9%) |
| Automobile & Eliminations | Free Cash Flow (billion yen) | -480.8 | -242.8 |
| Automobile & Eliminations | Net Cash (billion yen) | 1,170.4 | 1,498.4 |
| Sales Financing | Total Assets (billion yen) | 10,726.8 | 10,145.6 |
| Sales Financing | Net Revenue (billion yen) | 1,318.0 | 1,262.1 |
| Sales Financing | Operating Profit (billion yen) | 297.9 | 285.6 |
| Sales Financing | Penetration | 41% | 45% |
| Sales Financing | Net Credit Loss Ratio | 0.75% | 0.63% |

Regional Sales Volume
Global retail sales volume fell 5.8% year on year to 3,151 thousand units in FY2025 (down 5.7% excluding China). By region, retail volume declined in China, Japan, North America, Europe and Others. For FY2026, Nissan guides to global retail sales volume of 3,300 thousand units, up 4.7% year on year (up 3.7% excluding China), with growth expected in all regions, led by China.
| Region | FY2025 (thousand units) | FY2024 (thousand units) | Change |
|---|---|---|---|
| China | 653 | 697 | -6.3% |
| Japan | 399 | 461 | -13.5% |
| North America | 1,291 | 1,303 | -0.9% |
| Europe | 317 | 351 | -9.7% |
| Others | 491 | 535 | -8.1% |
| Total | 3,151 | 3,346 | -5.8% (-5.7% excl. China) |
FY2026 Forecast
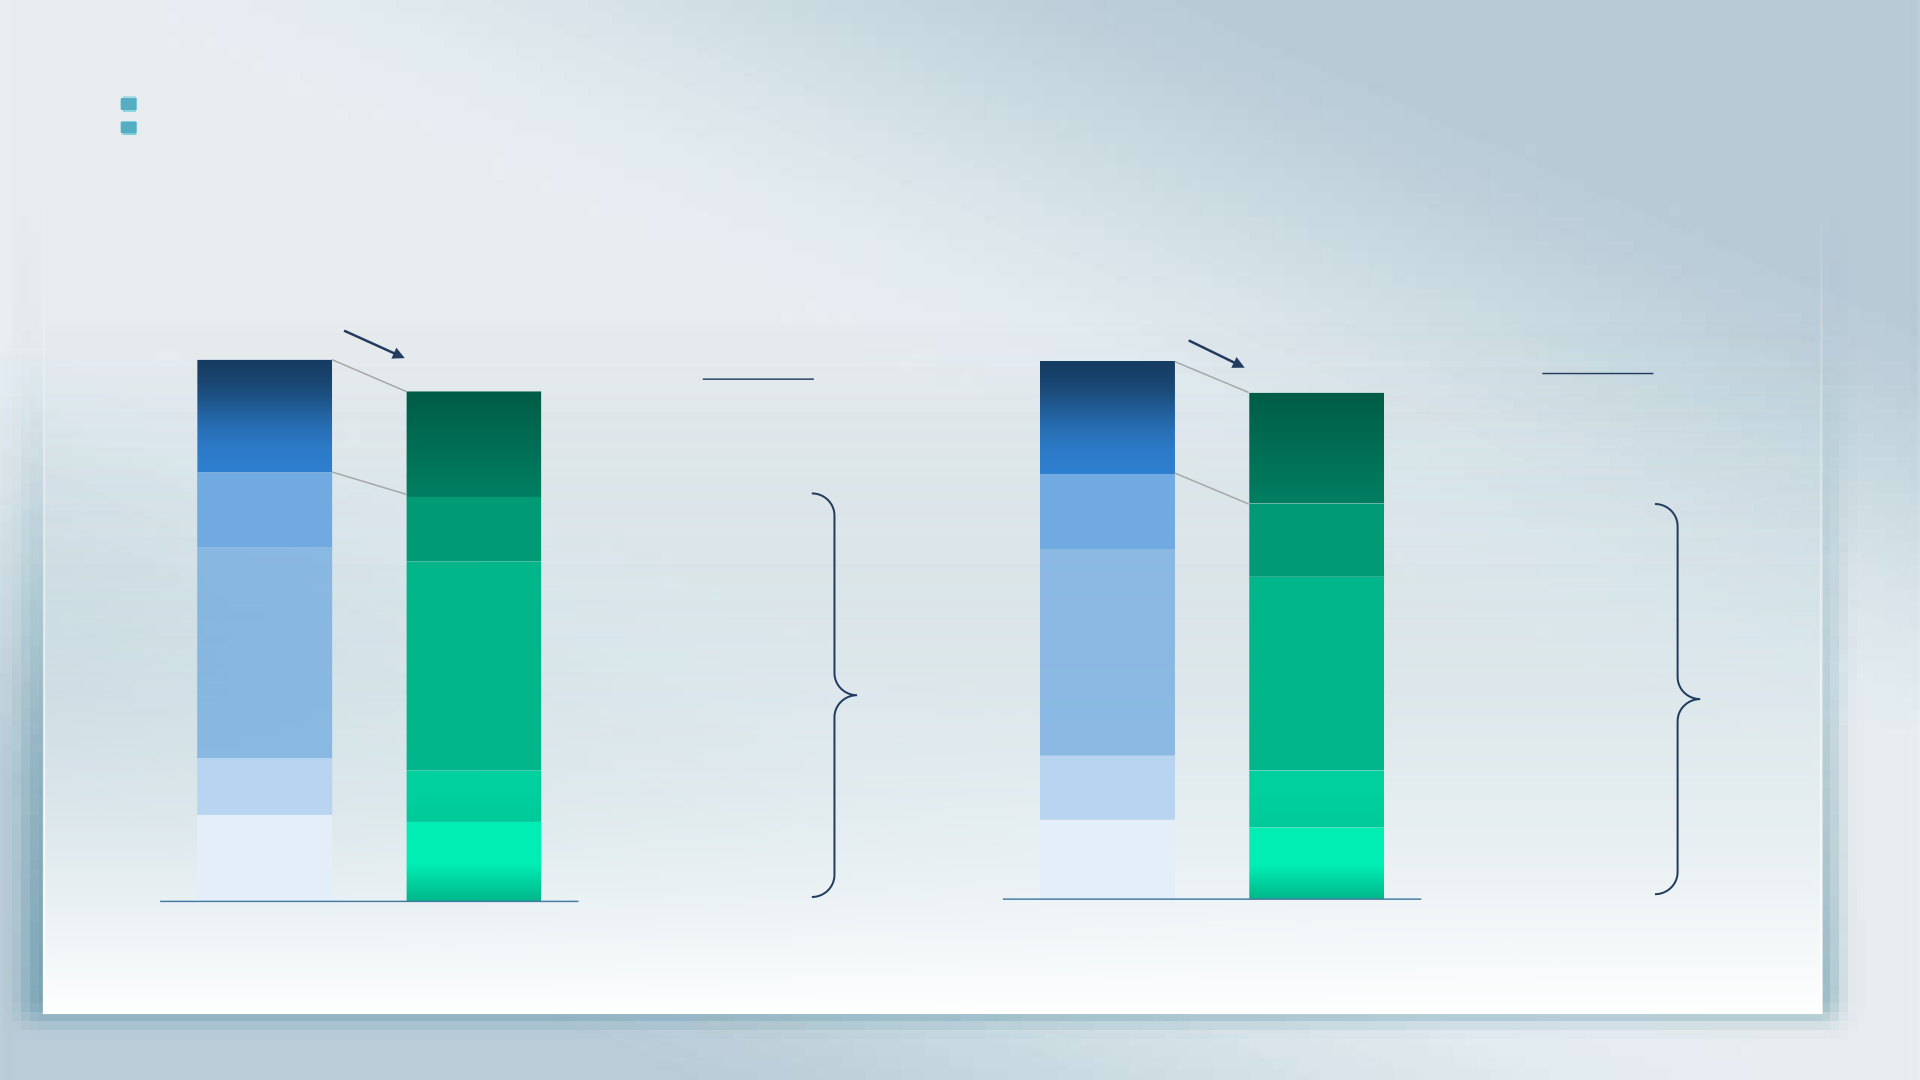
For FY2026, Nissan guides to net revenue of 13,000.0 billion yen (up 992.1 billion yen), operating profit of 200.0 billion yen (1.5% margin, up 142.0 billion yen), and net income of 20.0 billion yen (up 553.1 billion yen from a loss), assuming exchange rates of 150 yen/USD (versus 151 yen in FY2025) and 175 yen/EUR (unchanged). Production volume is guided at 2,950 thousand units, up 1.6% from 2,903 thousand units in FY2025. The company states that FY2026 targets a positive operating profit and positive automotive free cash flow and operating profit before tariffs, despite continued inflation and raw material cost pressure, with auto net cash expected to exceed 1 trillion yen at year end.
| Item | FY2026 Outlook | FY2025 (Actual) | Variance |
|---|---|---|---|
| Net Revenue (billion yen) | 13,000.0 | 12,007.9 | +992.1 |
| Operating Profit (billion yen) | 200.0 | 58.0 | +142.0 |
| OP Margin | 1.5% | 0.5% | +1.0pt |
| Net Income attributable to owners of the parent (billion yen) | 20.0 | -533.1 | +553.1 |
| FX Rate (USD/JPY, full-year average) | 150 | 151 | -1 |
| FX Rate (EUR/JPY, full-year average) | 175 | 175 | – |
| Dividend per share | 0 yen | 0 yen | – |

Shareholder Returns
Dividend per share for FY2025 was 0 yen, and Nissan’s FY2026 outlook also assumes a dividend per share of 0 yen.
Re:Nissan Plan / Topics
Under the Re:Nissan plan, Nissan reported ahead-of-plan fixed cost savings, reaching more than 200 billion yen cumulatively by Q4 FY2025 against a full-year target of 250 billion yen, and realized 55 billion yen in variable cost savings in FY2025. On manufacturing restructuring, the company aims to reduce production capacity from 3.5 million to 2.5 million units (excluding China) by consolidating production sites from 17 to 10 by FY2027; it announced actions at all 7 planned sites within 10 months and completed consolidation of 6 sites. Engineering cost per hour was reduced 18% against a 20% reduction target, and marketing efficiency improved 14% year on year. The company is resizing its workforce by reducing 20,000 positions by FY2027, with a Voluntary Separation Program implemented in the US, UK and Japan.

This article is an analysis based on publicly available information and is not a recommendation to buy or sell any specific securities. Investment decisions are your own responsibility.
![[Obayashi] Investors’ Guide 2026 — The Complete 24-Article Breakdown](https://japan-equity.com/wp-content/uploads/2026/07/hub_cover-1024x1024.png)
![[Obayashi] IR & SR Policy — Feeding Dialogue Back into Management](https://japan-equity.com/wp-content/uploads/2026/07/p32_sq-1024x1024.jpg)
![[Obayashi] Real Estate Development — 18.7% Margin, ¥287.7bn Unrealized Gains](https://japan-equity.com/wp-content/uploads/2026/07/p20_sq-1024x1024.jpg)
![[Obayashi] Domestic Civil Engineering — Resilience Spending Supports 9.6% Margin](https://japan-equity.com/wp-content/uploads/2026/07/p11_sq-1024x1024.jpg)
![[Obayashi] Share Price & External Ratings — vs TOPIX, ESG Index Inclusion](https://japan-equity.com/wp-content/uploads/2026/07/p40_sq-1024x1024.jpg)
![[Construction] ¥75.5tn Investment, Shrinking Workforce — Big-5 Market Share](https://japan-equity.com/wp-content/uploads/2026/07/p12_sq-1024x1024.jpg)



![[Obayashi] Capital Policy & Shareholder Returns — ROE 10%+, DOE ~5%, ¥100bn Buyback](https://japan-equity.com/wp-content/uploads/2026/07/p27_sq-1024x1024.jpg)
![[Obayashi] Reducing Cross-Shareholdings — ¥285.2bn Sold in Five Years](https://japan-equity.com/wp-content/uploads/2026/07/p29_sq-1024x1024.jpg)
![[Obayashi] ¥750bn Investment Plan — ¥300bn to Development, ¥190bn to Tech/DX](https://japan-equity.com/wp-content/uploads/2026/07/p30_sq-1024x1024.jpg)
![[Obayashi] MTP2022 KPIs — Operating Profit ~2x Target, ROE 14.4%](https://japan-equity.com/wp-content/uploads/2026/07/p25_sq-1024x1024.jpg)
![[Obayashi] Cash Allocation — ¥420bn Investment CF Over Five Years](https://japan-equity.com/wp-content/uploads/2026/07/p26_sq-1024x1024.jpg)
![[Obayashi] Green Energy — 44 Plants, 344MW, and the Green Hydrogen Challenge](https://japan-equity.com/wp-content/uploads/2026/07/p21_sq-1024x1024.jpg)
![[Obayashi] Tackling the Labor Shortage — Robotics Construction®](https://japan-equity.com/wp-content/uploads/2026/07/p14_sq-1024x1024.jpg)
