
This article is based on publicly available IR materials and is not a recommendation to buy or sell any specific securities.
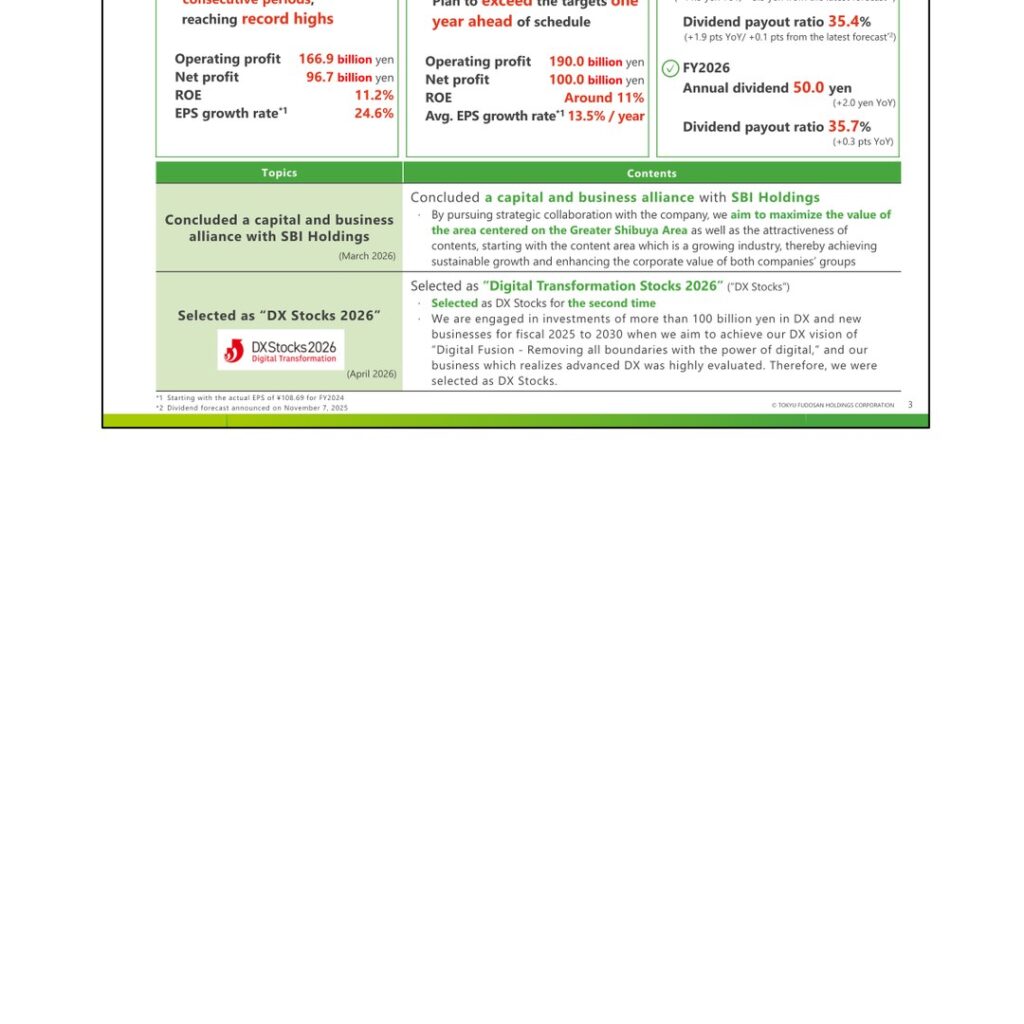
Tokyu Fudosan Holdings Corporation (3289) reported record-high operating revenue and profit at every stage for FY2025 (fiscal year ended March 31, 2026), marking the fifth consecutive period of revenue and profit growth. Operating revenue rose to ¥1,246.0 billion (+¥95.7 billion year on year) and operating profit rose to ¥166.9 billion (+¥26.1 billion), driven by strong performance in the real estate agents business and sales to investors, as well as robust operation of offices and commercial facilities centered in the Greater Shibuya Area. Net profit attributable to owners of parent rose to ¥96.7 billion (+¥19.1 billion), with ROE reaching 11.2% and EPS growth of 24.6% year on year. Both net profit and ROE already exceeded the company’s FY2027 Medium-Term Management Plan targets, two years ahead of schedule. For FY2026, the company forecasts a further record year, with operating profit of ¥190.0 billion and net profit of ¥100.0 billion.
Consolidated Results (Full-Year Actual)
All profit lines exceeded the company’s revised forecast (announced November 7, 2025): operating profit of ¥166.9 billion topped the ¥160.0 billion forecast by ¥6.9 billion, and net profit of ¥96.7 billion topped the ¥90.0 billion forecast by ¥6.7 billion, while operating revenue of ¥1,246.0 billion came in ¥54.0 billion below the ¥1,300.0 billion forecast. FY2025 major indices were ROE 11.2%, ROA 5.0%, EPS ¥135.45 (+¥26.76 year on year), and EPS growth of 24.6% per year (FY2024–FY2025). Extraordinary income of ¥9.8 billion included profit on sales of affiliated company shares of ¥9.5 billion, while extraordinary losses of ¥10.5 billion included an impairment loss of ¥5.7 billion and a provision for loss on business liquidation of ¥3.4 billion. On the balance sheet, total assets rose to ¥3,419.1 billion (+¥164.3 billion), primarily reflecting an increase in real estate for sale to ¥1,082.4 billion (+¥73.3 billion) amid progress in investment activity, while interest-bearing debt rose to ¥1,826.9 billion (+¥79.1 billion). As of the end of March 2026, the long-term ratio of interest-bearing debt was approx. 96%, the fixed ratio was approx. 94%, and the external long-term credit rating from Japan Credit Rating Agency was A+ (stable). Unrealized gains on leased properties expanded to ¥498.8 billion (+¥63.7 billion), driven primarily by rising office rents, and NAV per share rose to ¥1,739 (+¥167 year on year).
| Item | FY2024 | FY2025 (Actual) | YoY Change | FY2025 Forecast (Nov 2025) | vs. Forecast |
|---|---|---|---|---|---|
| Operating revenue (¥ billion) | 1,150.3 | 1,246.0 | +95.7 | 1,300.0 | (54.0) |
| Operating profit (¥ billion) | 140.8 | 166.9 | +26.1 | 160.0 | +6.9 |
| Ordinary profit (¥ billion) | 129.2 | 147.8 | +18.7 | 139.0 | +8.8 |
| Net profit attributable to owners of parent (¥ billion) | 77.6 | 96.7 | +19.1 | 90.0 | +6.7 |
Segment Results
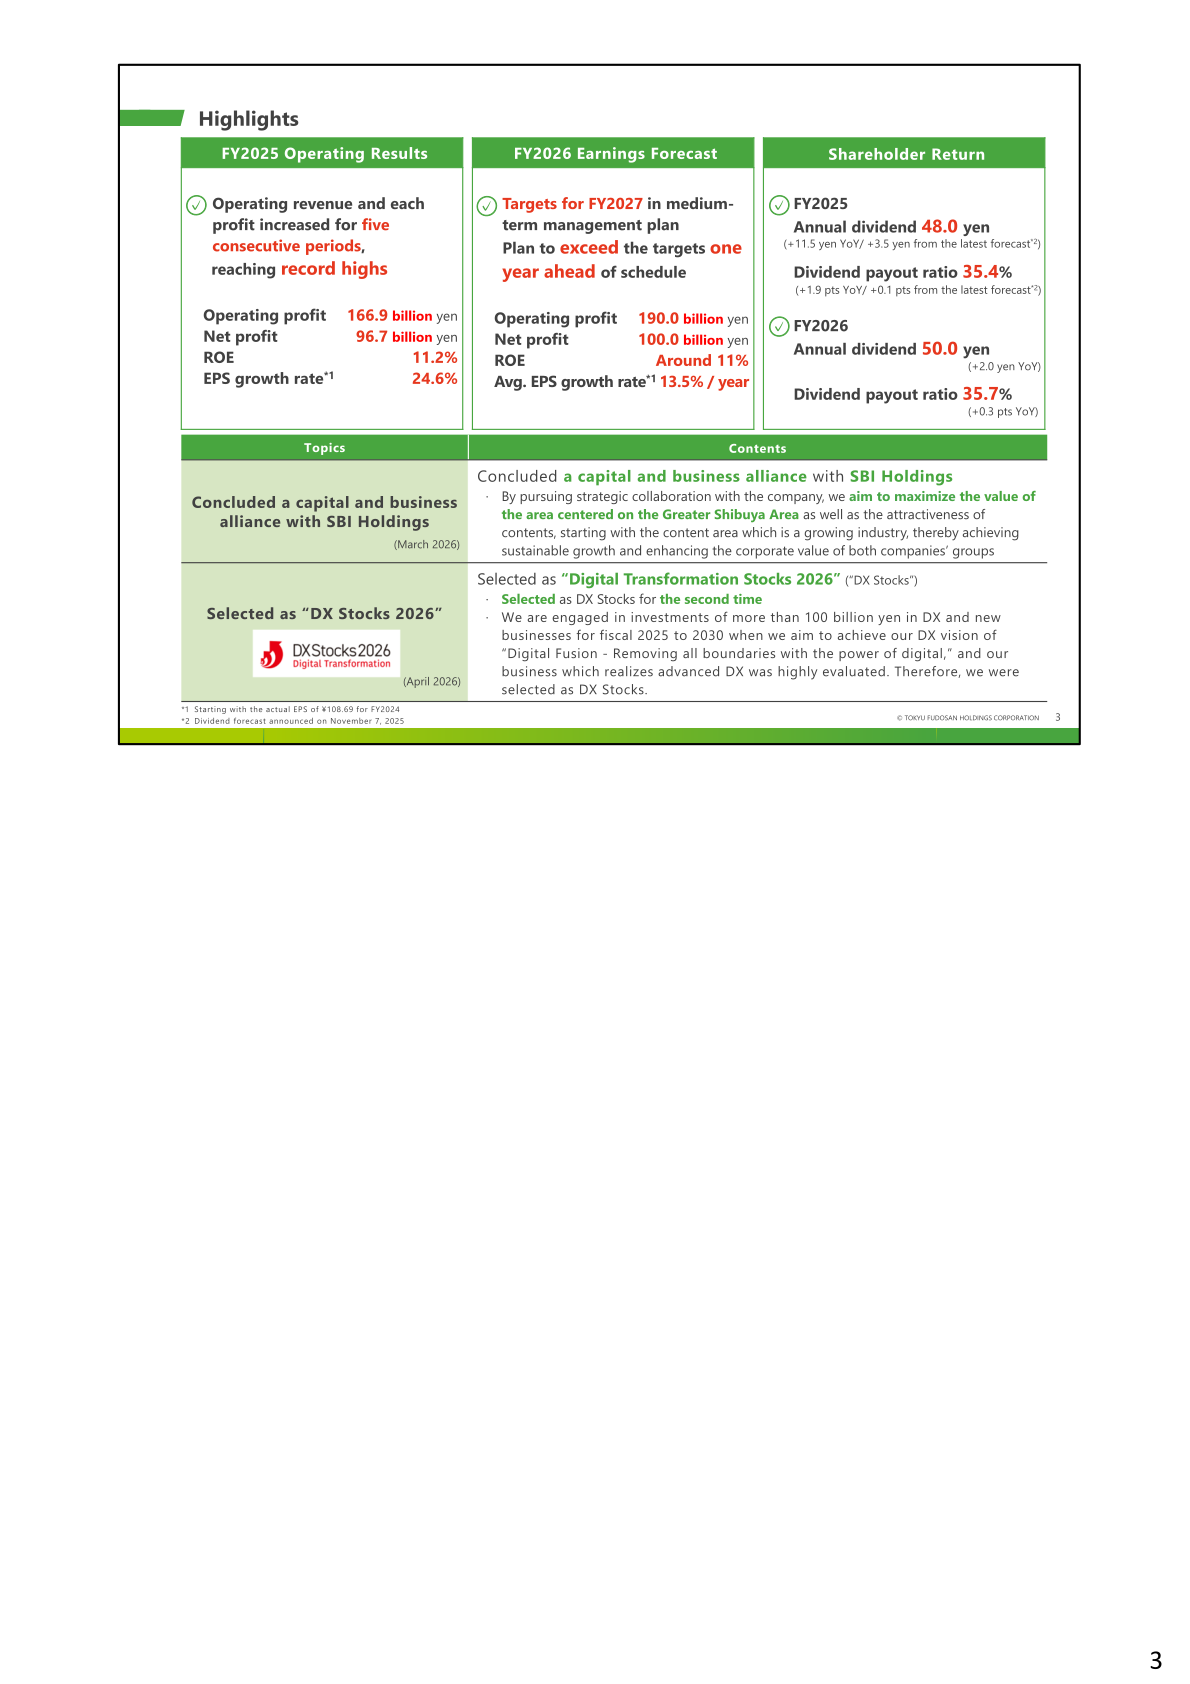
All four business segments increased operating profit in FY2025, led by the Real Estate Agents segment. Urban Development revenue rose to ¥399.9 billion (+¥51.1 billion) and operating profit rose to ¥75.2 billion (+¥4.7 billion), supported by strong condominium sales to investors (+¥62.1 billion) and improved occupancy of offices and commercial facilities. Strategic Investment revenue rose to ¥146.6 billion (+¥35.8 billion) and operating profit rose to ¥13.2 billion (+¥8.1 billion), helped by an improvement in profit and loss during the period in the U.S. business (+¥6.4 billion for Overseas operations). Property Management & Operation revenue declined slightly to ¥364.4 billion (¥1.5 billion) while operating profit rose to ¥27.2 billion (+¥2.2 billion), as continued strong hotel performance (+¥2.1 billion) and higher property management fees offset a decrease in sales to investors. Real Estate Agents revenue rose to ¥364.7 billion (+¥19.2 billion) and operating profit rose to ¥64.4 billion (+¥13.6 billion), with the Real Estate Agents sub-segment itself up ¥12.7 billion (brokerage +¥7.8 billion, real estate sales +¥4.4 billion). Within the Real Estate Agents business, Tokyu Livable held the top position in the amount of real estate brokerage transactions and commission income among major real estate agents for the first half of FY2025, with transaction amount of ¥1,190,879 million (+13.1% year on year) and commission income of ¥51,160 million (+8.6%).
| Segment | Metric | FY2024 | FY2025 (Actual) | YoY Change |
|---|---|---|---|---|
| Urban Development | Operating revenue (¥ billion) | 348.8 | 399.9 | +51.1 |
| Urban Development | Operating profit (¥ billion) | 70.5 | 75.2 | +4.7 |
| Strategic Investment | Operating revenue (¥ billion) | 110.8 | 146.6 | +35.8 |
| Strategic Investment | Operating profit (¥ billion) | 5.2 | 13.2 | +8.1 |
| Property Management & Operation | Operating revenue (¥ billion) | 365.8 | 364.4 | (1.5) |
| Property Management & Operation | Operating profit (¥ billion) | 25.0 | 27.2 | +2.2 |
| Real Estate Agents | Operating revenue (¥ billion) | 345.4 | 364.7 | +19.2 |
| Real Estate Agents | Operating profit (¥ billion) | 50.8 | 64.4 | +13.6 |
| Elimination | Operating revenue (¥ billion) | (20.6) | (29.5) | (8.9) |
| Elimination | Operating profit (¥ billion) | (10.8) | (13.2) | (2.4) |
FY2026 Forecast
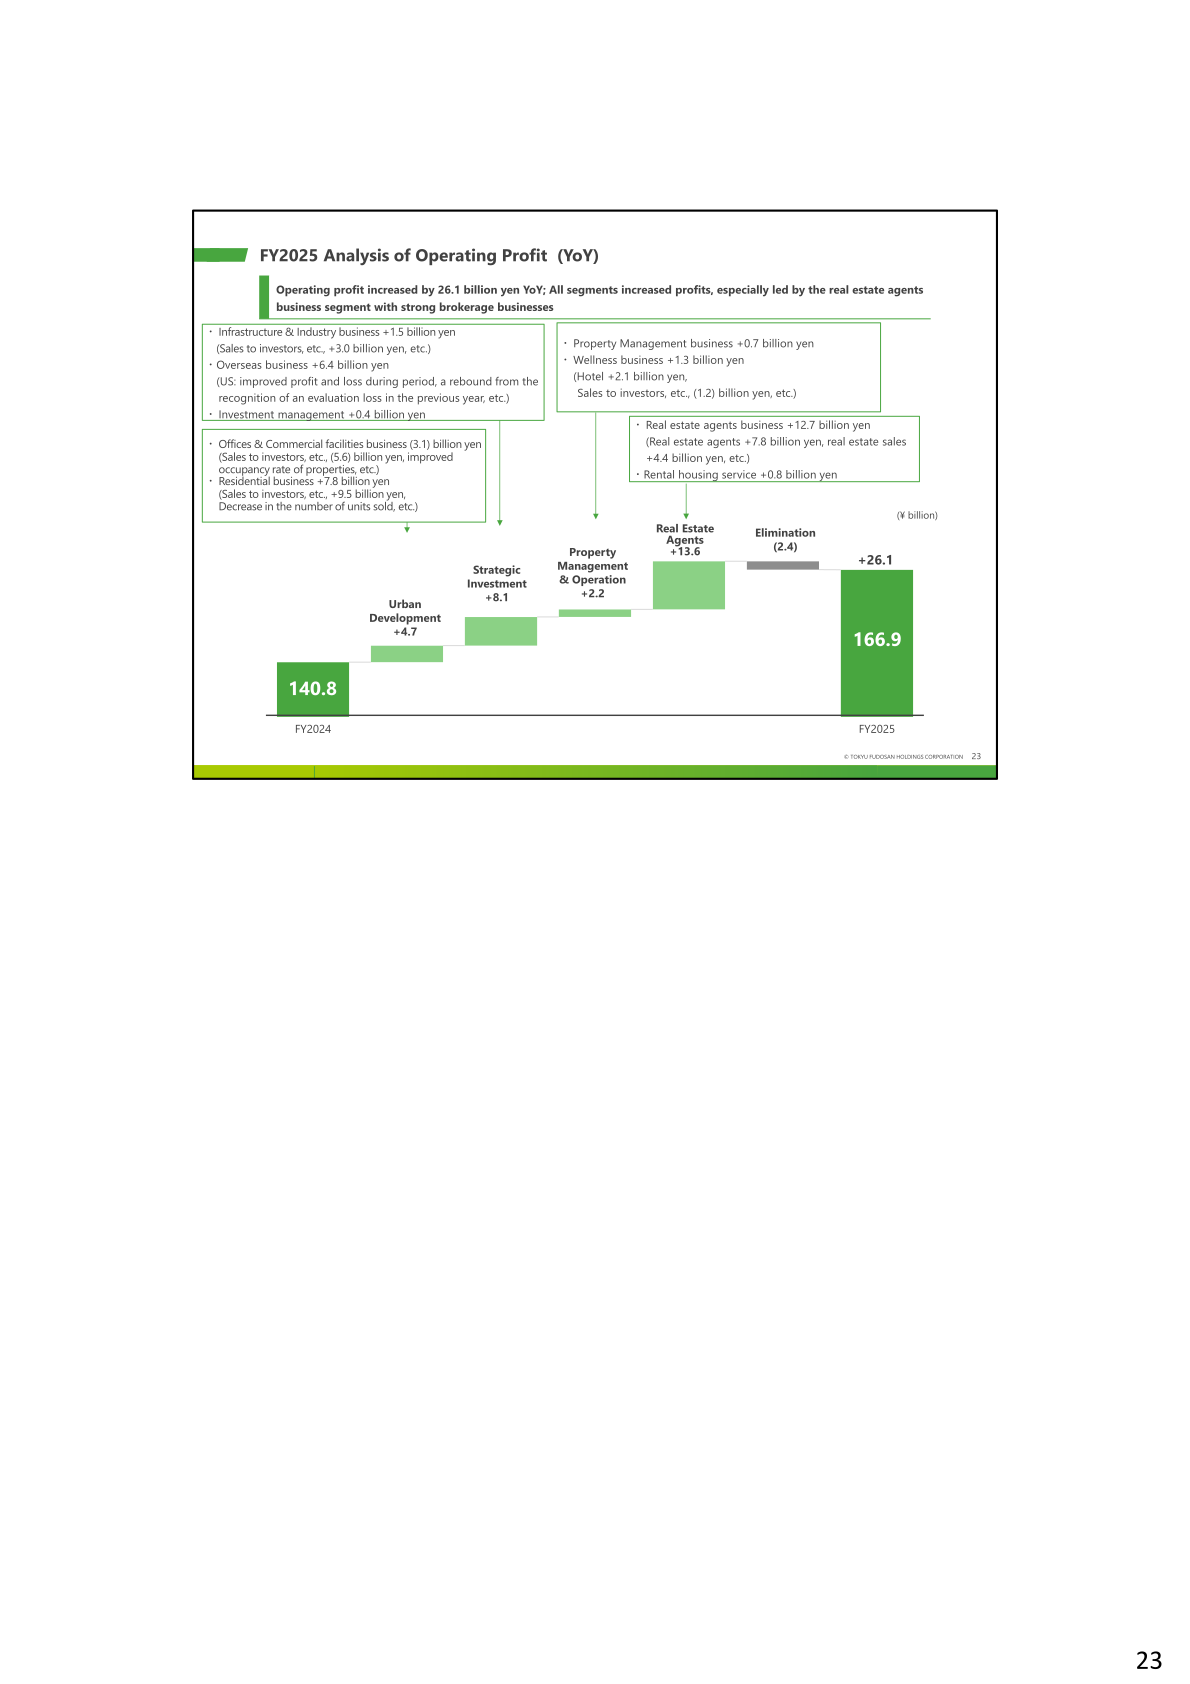
For FY2026 (fiscal year ending March 31, 2027), the company forecasts operating revenue of ¥1,400.0 billion (+¥154.0 billion), operating profit of ¥190.0 billion (+¥23.1 billion), ordinary profit of ¥161.0 billion (+¥13.2 billion), and net profit of ¥100.0 billion (+¥3.3 billion), forecasting a new record profit driven by expectations of strong performance in sales to investors, condominium sales, and the real estate agents business. FY2026 major indices are forecast at ROE approx. 11%, ROA approx. 5.5%, EPS ¥140.02, and average EPS growth of 13.5% per year (FY2024–FY2026). By segment, the largest driver of the forecast profit increase is Property Management & Operation (+¥15.1 billion to ¥42.3 billion), primarily due to increased sales to investors in the Wellness business (+¥16.4 billion), followed by Strategic Investment (+¥6.1 billion to ¥19.3 billion) on higher sales to investors in the Renewable energy business and improved overseas profit and loss, and Real Estate Agents (+¥2.1 billion to ¥66.5 billion) on continued brokerage strength. Urban Development operating profit is forecast roughly flat (+¥0.1 billion to ¥75.3 billion), as an increase in the Residential business (+¥9.2 billion, driven by a planned increase of 315 units sold to 1,214 units) is largely offset by a decline in the Offices and Commercial Facilities business (¥9.2 billion, mainly lower sales to investors).
| Item | FY2025 (Actual) | FY2026 Forecast | YoY Change |
|---|---|---|---|
| Operating revenue (¥ billion) | 1,246.0 | 1,400.0 | +154.0 |
| Operating profit (¥ billion) | 166.9 | 190.0 | +23.1 |
| Ordinary profit (¥ billion) | 147.8 | 161.0 | +13.2 |
| Net profit attributable to owners of parent (¥ billion) | 96.7 | 100.0 | +3.3 |
| Segment | Metric | FY2025 (Actual) | FY2026 Forecast | YoY Change |
|---|---|---|---|---|
| Urban Development | Operating revenue (¥ billion) | 399.9 | 475.5 | +75.5 |
| Urban Development | Operating profit (¥ billion) | 75.2 | 75.3 | +0.1 |
| Strategic Investment | Operating revenue (¥ billion) | 146.6 | 176.5 | +29.9 |
| Strategic Investment | Operating profit (¥ billion) | 13.2 | 19.3 | +6.1 |
| Property Management & Operation | Operating revenue (¥ billion) | 364.4 | 398.0 | +33.7 |
| Property Management & Operation | Operating profit (¥ billion) | 27.2 | 42.3 | +15.1 |
| Real Estate Agents | Operating revenue (¥ billion) | 364.7 | 378.0 | +13.4 |
| Real Estate Agents | Operating profit (¥ billion) | 64.4 | 66.5 | +2.1 |
| Elimination | Operating revenue (¥ billion) | (29.5) | (28.0) | +1.5 |
| Elimination | Operating profit (¥ billion) | (13.2) | (13.4) | (0.2) |
Shareholder Returns
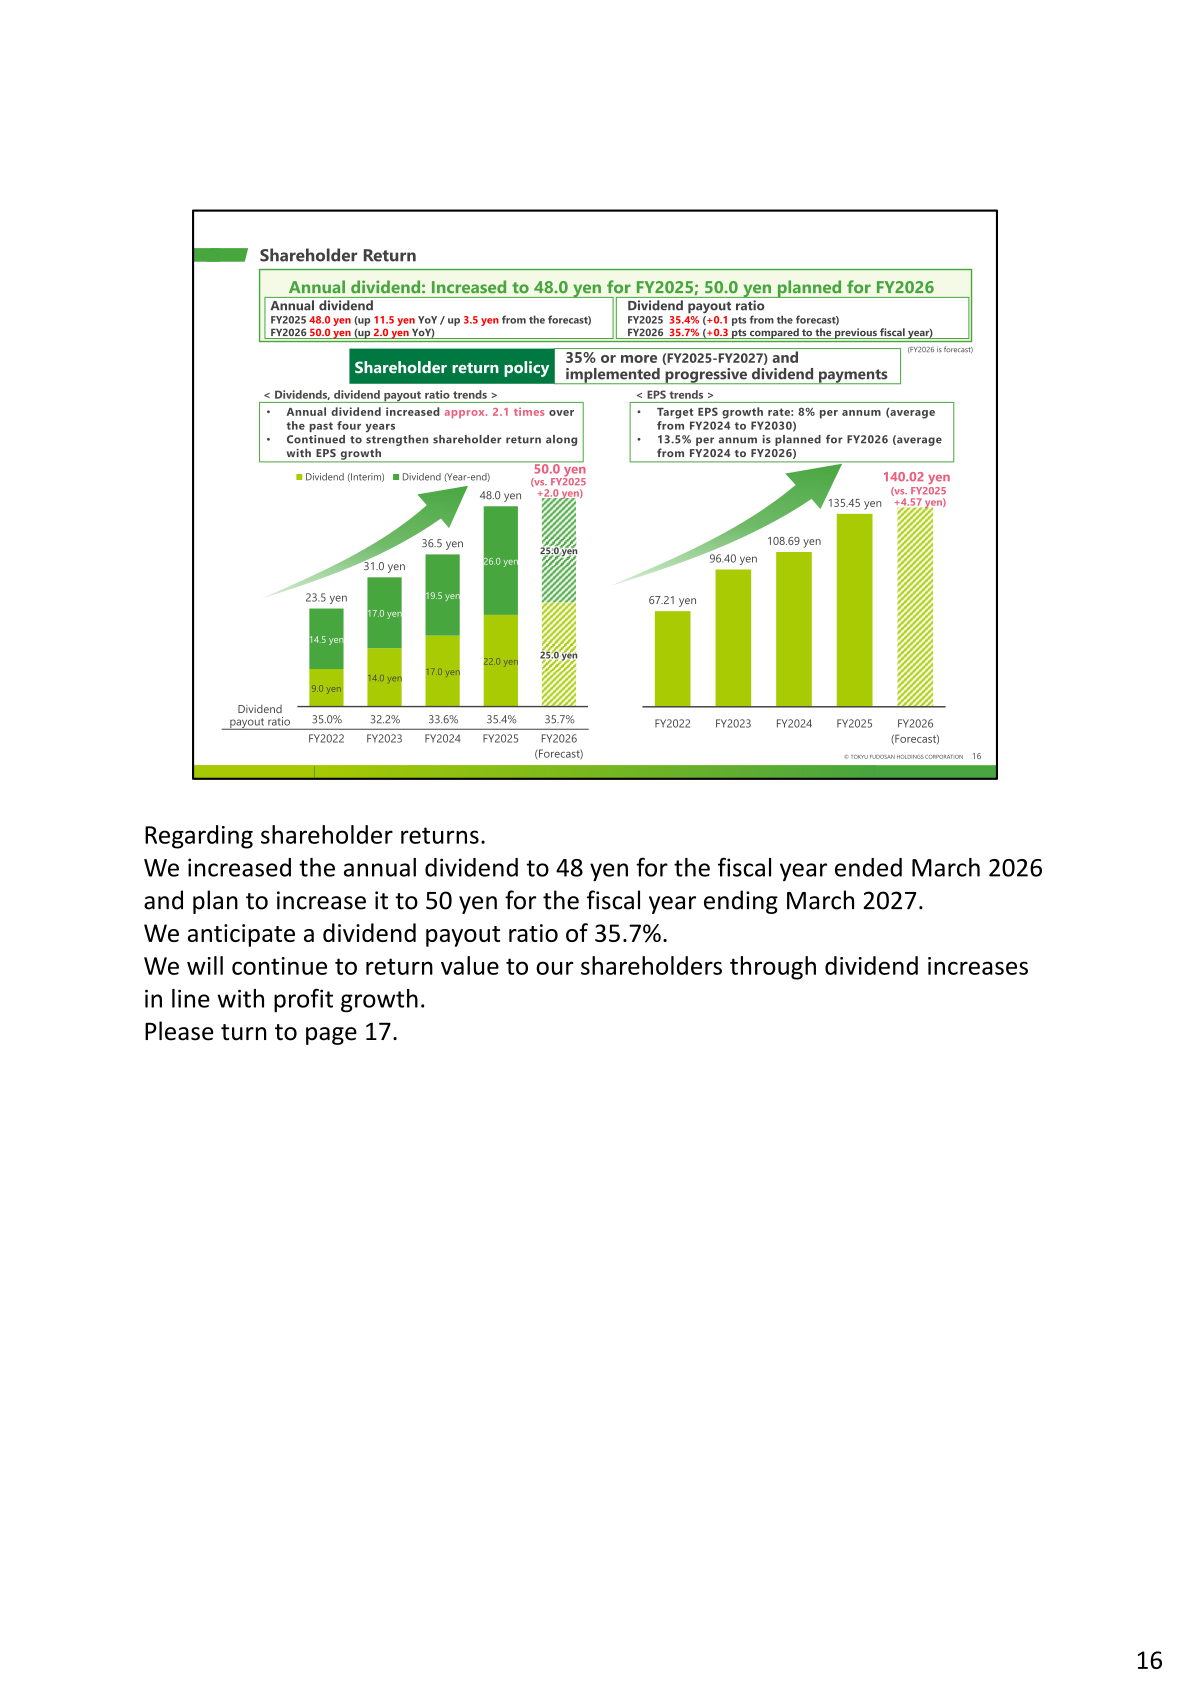
The annual dividend for FY2025 was increased to ¥48.0 yen (+¥11.5 yen year on year, +¥3.5 yen from the forecast), with a dividend payout ratio of 35.4% (+0.1pt from the forecast). For FY2026, the company plans an annual dividend of ¥50.0 yen (+¥2.0 yen year on year) with a dividend payout ratio of 35.7% (+0.3pt compared to the previous fiscal year). The shareholder return policy targets a dividend payout ratio of 35% or more for FY2025–FY2027 and calls for progressive dividend payments.
| Item | FY2024 | FY2025 | FY2026 Forecast |
|---|---|---|---|
| Annual dividend (yen) | 36.5 | 48.0 | 50.0 |
| Dividend payout ratio | 33.6% | 35.4% | 35.7% |
Medium-Term Plan / Topics
Under the Medium-Term Management Plan 2030 (announced May 2025), FY2027 targets are operating profit of ¥170.0 billion, net profit of ¥92.0 billion, and ROE of 9.5–10%, while FY2030 targets are operating profit of ¥220.0 billion or more, net profit of ¥120.0 billion or more, ROE of 10% or more, and average EPS growth of 8% per year. FY2025 results already exceeded the FY2027 net profit and ROE targets, two years ahead of schedule, and the FY2026 forecast (operating profit ¥190.0 billion, net profit ¥100.0 billion, ROE approx. 11%) is set to exceed the FY2027 operating profit target as well, one year ahead of schedule. Citing changes in the external environment over the past year — including the establishment of an inflationary environment, rising construction costs, rising domestic interest rates, and destabilization of the international situation — the company plans to update the Medium-Term Management Plan 2030 and announce a revised plan next year.
Topics for the period included the conclusion of a capital and business alliance with SBI Holdings, aimed at maximizing the value of the Greater Shibuya Area and its content industry, and selection as a “Digital Transformation Stocks 2026” (DX Stocks) company for the second time, in recognition of its DX vision “Digital Fusion — Removing all boundaries with the power of digital,” which includes planned cumulative DX and new business investment of more than ¥100 billion for fiscal 2025 to 2030.
This article is an analysis based on publicly available information and is not a recommendation to buy or sell any specific securities. Investment decisions are your own responsibility.
![[Obayashi] Investors’ Guide 2026 — The Complete 24-Article Breakdown](https://japan-equity.com/wp-content/uploads/2026/07/hub_cover-1024x1024.png)
![[Obayashi] IR & SR Policy — Feeding Dialogue Back into Management](https://japan-equity.com/wp-content/uploads/2026/07/p32_sq-1024x1024.jpg)
![[Obayashi] Real Estate Development — 18.7% Margin, ¥287.7bn Unrealized Gains](https://japan-equity.com/wp-content/uploads/2026/07/p20_sq-1024x1024.jpg)
![[Obayashi] Domestic Civil Engineering — Resilience Spending Supports 9.6% Margin](https://japan-equity.com/wp-content/uploads/2026/07/p11_sq-1024x1024.jpg)
![[Obayashi] Share Price & External Ratings — vs TOPIX, ESG Index Inclusion](https://japan-equity.com/wp-content/uploads/2026/07/p40_sq-1024x1024.jpg)
![[Construction] ¥75.5tn Investment, Shrinking Workforce — Big-5 Market Share](https://japan-equity.com/wp-content/uploads/2026/07/p12_sq-1024x1024.jpg)



![[Obayashi] Capital Policy & Shareholder Returns — ROE 10%+, DOE ~5%, ¥100bn Buyback](https://japan-equity.com/wp-content/uploads/2026/07/p27_sq-1024x1024.jpg)
![[Obayashi] Reducing Cross-Shareholdings — ¥285.2bn Sold in Five Years](https://japan-equity.com/wp-content/uploads/2026/07/p29_sq-1024x1024.jpg)
![[Obayashi] ¥750bn Investment Plan — ¥300bn to Development, ¥190bn to Tech/DX](https://japan-equity.com/wp-content/uploads/2026/07/p30_sq-1024x1024.jpg)
![[Obayashi] MTP2022 KPIs — Operating Profit ~2x Target, ROE 14.4%](https://japan-equity.com/wp-content/uploads/2026/07/p25_sq-1024x1024.jpg)
![[Obayashi] Cash Allocation — ¥420bn Investment CF Over Five Years](https://japan-equity.com/wp-content/uploads/2026/07/p26_sq-1024x1024.jpg)
![[Obayashi] Green Energy — 44 Plants, 344MW, and the Green Hydrogen Challenge](https://japan-equity.com/wp-content/uploads/2026/07/p21_sq-1024x1024.jpg)
![[Obayashi] Tackling the Labor Shortage — Robotics Construction®](https://japan-equity.com/wp-content/uploads/2026/07/p14_sq-1024x1024.jpg)
