
This article is based on publicly available IR materials and is not a recommendation to buy or sell any specific securities.
Note: Kirin Holdings’ fiscal year is the calendar year. “FY2025” in this article refers to the twelve months ended December 31, 2025 (results announced February 13, 2026), and “FY2026” refers to the year ending December 31, 2026, exactly as labeled in the source material.
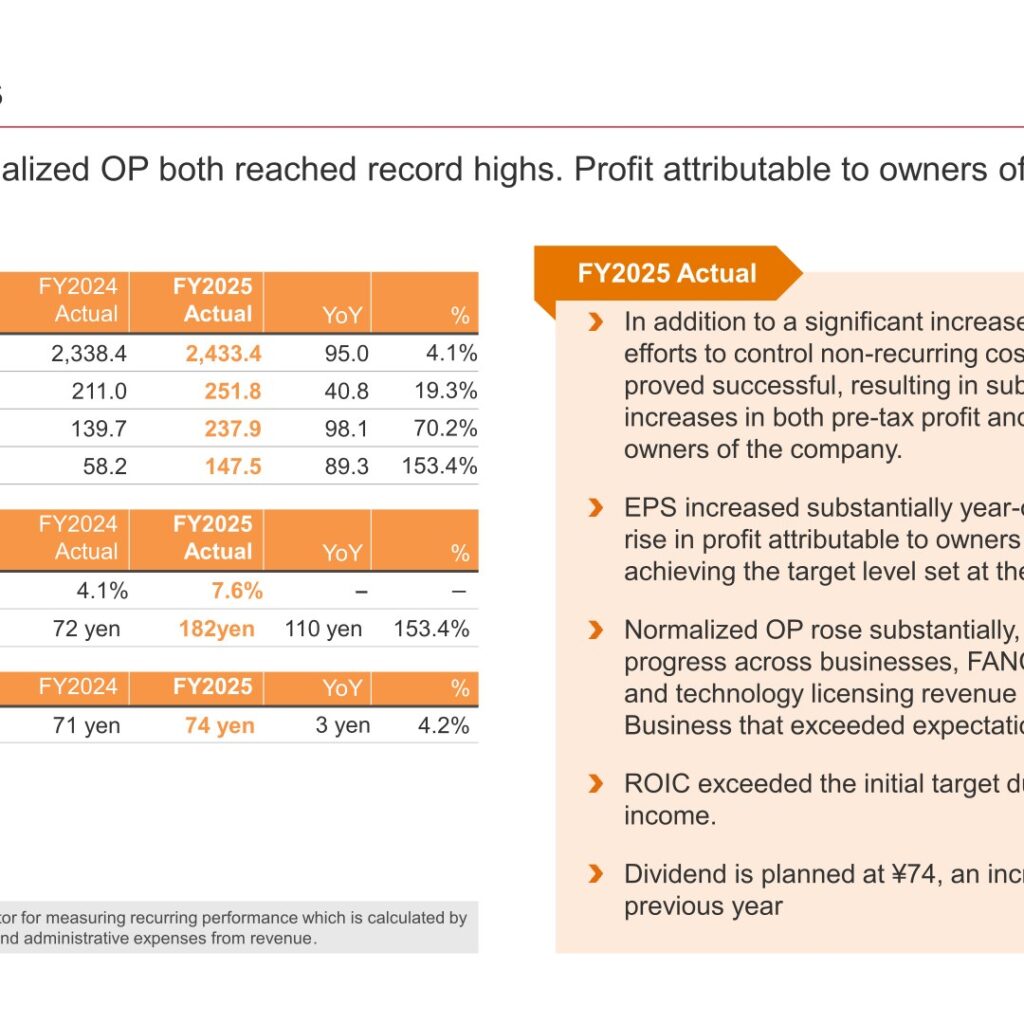
Kirin Holdings Company, Limited (2503) reported FY2025 revenue of ¥2,433.4 bn (up 4.1% year on year) and Normalized OP of ¥251.8 bn (up 19.3%), both record highs. Profit before tax rose 70.2% to ¥237.9 bn and profit attributable to owners of the Company rose 153.4% to ¥147.5 bn — a 2.5-fold increase — helped by control of non-recurring costs below Normalized OP and a lower effective tax rate (25.1% versus 38.6% in FY2024). EPS rose to ¥182 from ¥72, largely achieving the target set at the beginning of the year, and ROIC rose to 7.6% from 4.1%, exceeding the initial target. The company plans a dividend of ¥74 per share for FY2025, up ¥3 year on year, and forecasts FY2026 revenue of ¥2,480.0 bn, Normalized OP of ¥235.0 bn, and profit attributable to owners of the Company of ¥156.0 bn, with dividend per share of ¥76.
Consolidated Results (Full-Year Actual)
Revenue and Normalized OP both reached record highs in FY2025, with Normalized OP up ¥40.8 bn year on year driven by steady progress across businesses, FANCL’s full-year contribution, and technology licensing revenue in the Pharmaceuticals Business that exceeded expectations. Profit before tax increased ¥98.1 bn (up 70.2%) and profit attributable to owners of the Company increased ¥89.3 bn (up 153.4%) to ¥147.5 bn, as efforts to control non-recurring costs below Normalized OP proved successful. The effective tax rate fell to 25.1% from 38.6% in FY2024. ROIC rose to 7.6% from 4.1%, exceeding the initial target due to the increase in net income, and EPS rose to ¥182 from ¥72 in line with the rise in profit attributable to owners of the Company.
| Item | FY2025 Actual | FY2024 Actual | YoY |
|---|---|---|---|
| Revenue (bn yen) | 2,433.4 | 2,338.4 | +95.0 (+4.1%) |
| Normalized OP (bn yen) | 251.8 | 211.0 | +40.8 (+19.3%) |
| Profit before tax (bn yen) | 237.9 | 139.7 | +98.1 (+70.2%) |
| Profit attributable to owners of the Company (bn yen) | 147.5 | 58.2 | +89.3 (+153.4%) |
| ROIC | 7.6% | 4.1% | - |
| EPS | 182 yen | 72 yen | +110 yen (+153.4%) |
| Dividend per share | 74 yen | 71 yen | +3 yen (+4.2%) |
Segment Results
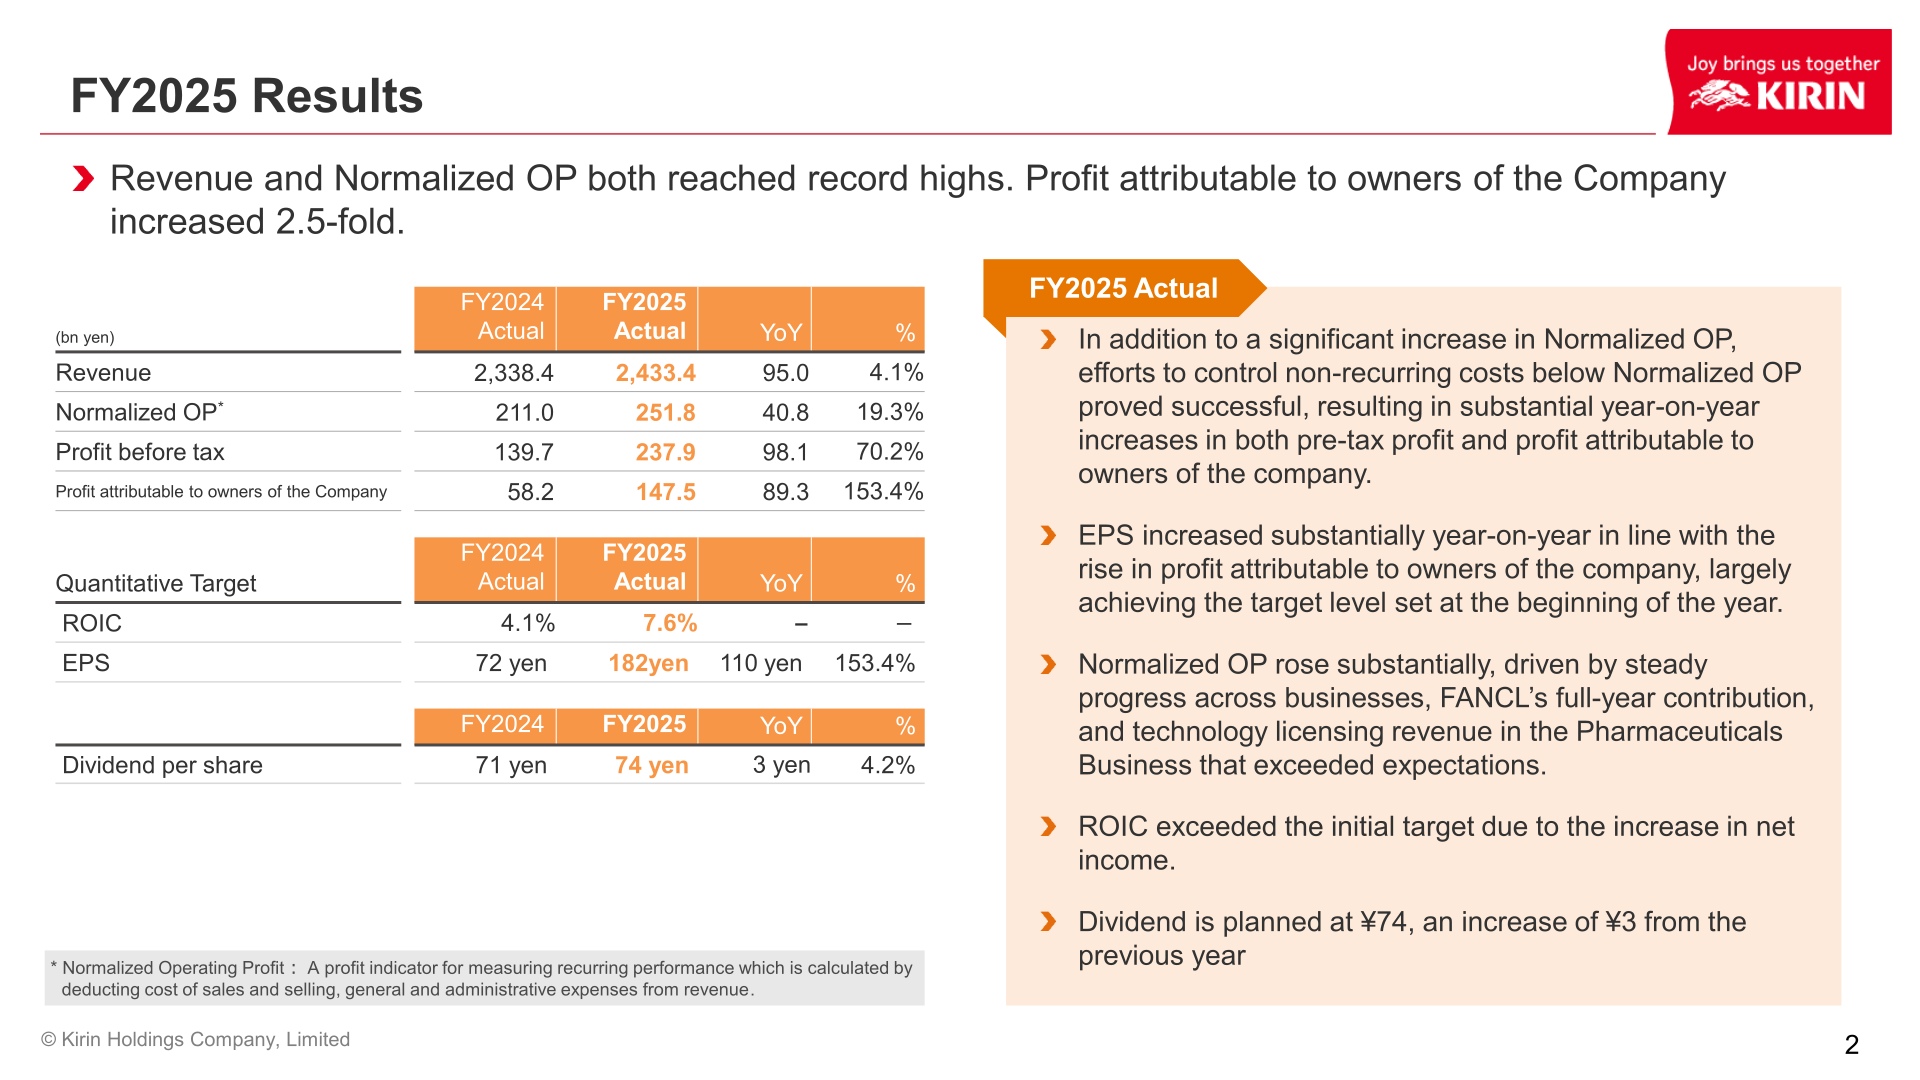
After adjusting for foreign exchange, nearly all businesses saw increased profits, and all four segments achieved balanced profit growth. Alcoholic Beverages Normalized OP rose ¥11.3 bn (up 9.1%) to ¥135.4 bn, led by Kirin Brewery (+¥13.8 bn), reflecting the effect of price revisions and a favorable year-on-year profit impact from a competitor’s cyberattack, chiefly in the domestic alcoholic-beverages segment and related areas; Four Roses declined ¥1.8 bn. Non-Alcoholic Beverages Normalized OP rose ¥3.7 bn (up 5.8%) to ¥67.7 bn, with Kirin Beverage +¥1.8 bn and Coke Northeast +¥2.3 bn. Pharmaceuticals Normalized OP at Kyowa Kirin rose ¥10.5 bn (up 11.4%) to ¥102.3 bn; although a profit decline had initially been planned, an unexpected increase in technology licensing revenue and strict cost management resulted in a shift to profit growth. Health Science Normalized OP improved ¥22.0 bn to ¥11.1 bn (from ¥-10.9 bn in FY2024), achieving a significant improvement in profitability due to FANCL’s annual contribution (+¥7.6 bn) and Kyowa Hakko Bio’s return to profitability (+¥14.2 bn). Corporate expenses/inter-segment eliminations increased by ¥5.5 bn to ¥-63.6 bn, mainly due to increased IT investment costs.
| Segment | FY2025 Actual (bn yen) | FY2024 Actual (bn yen) | YoY |
|---|---|---|---|
| Normalized OP (Total) | 251.8 | 211.0 | +40.8 (+19.3%) |
| Alcoholic Beverages | 135.4 | 124.0 | +11.3 (+9.1%) |
| — Kirin Brewery | 88.9 | 75.1 | +13.8 (+18.4%) |
| — Lion | 30.9 | 31.4 | -0.4 (-1.4%) |
| — Four Roses | 8.3 | 10.1 | -1.8 (-17.5%) |
| Non-Alcoholic Beverages | 67.7 | 64.0 | +3.7 (+5.8%) |
| — Kirin Beverage | 20.1 | 18.3 | +1.8 (+10.0%) |
| — Coke Northeast | 46.6 | 44.3 | +2.3 (+5.1%) |
| Pharmaceuticals (Kyowa Kirin) | 102.3 | 91.9 | +10.5 (+11.4%) |
| Health Science | 11.1 | -10.9 | +22.0 (-) |
| — FANCL | 9.6 | 2.0 | +7.6 (+378.9%) |
| — Blackmores | 6.3 | 6.0 | +0.3 (+5.0%) |
| — Kyowa Hakko Bio | 0.2 | -14.0 | +14.2 (-) |
| Other | -1.1 | 0.0 | -1.1 (-) |
| Corporate expenses/inter-segment | -63.6 | -58.0 | -5.5 (-) |
FY2026 Forecast
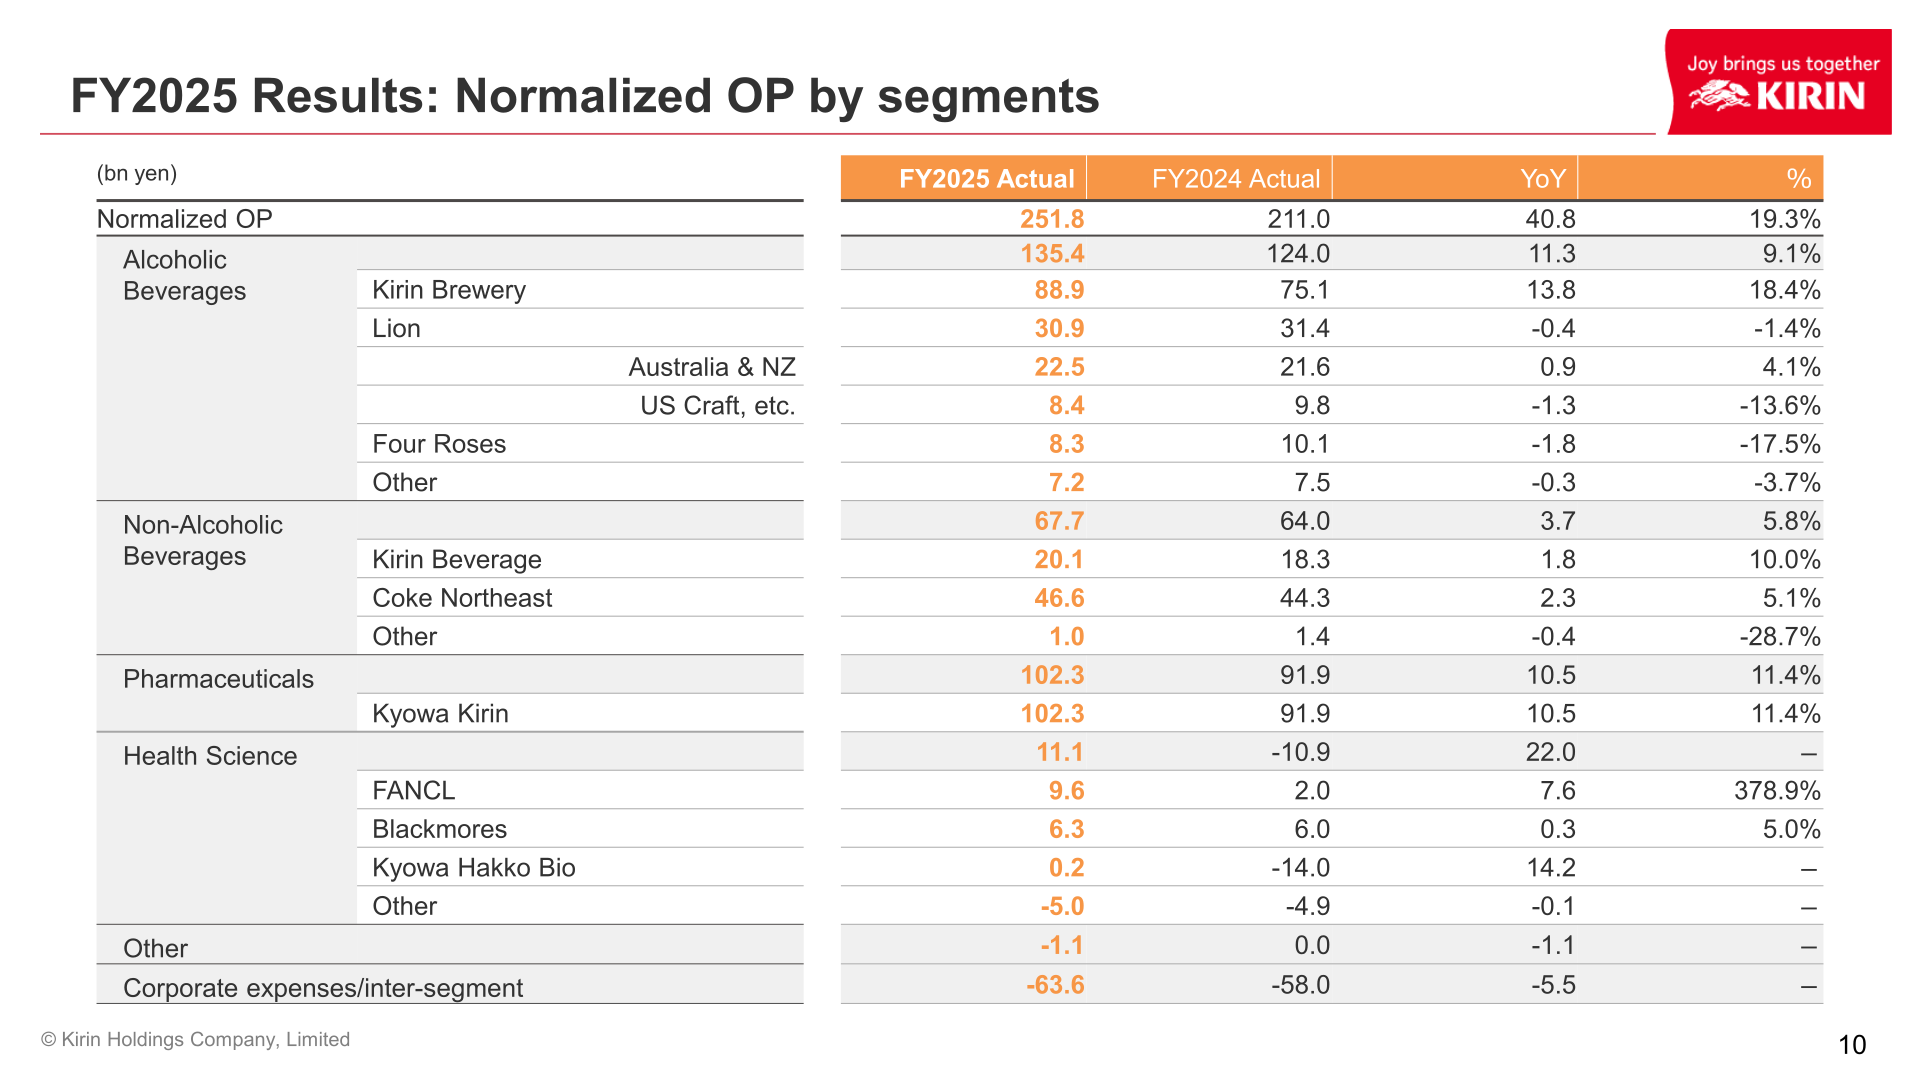
For FY2026, Kirin forecasts revenue of ¥2,480.0 bn (up 1.9%) and Normalized OP of ¥235.0 bn (down 6.7%), while pre-tax profit and profit attributable to owners of the Company are both projected to increase year on year through further suppression of non-recurring costs below Normalized OP, reaching ¥258.0 bn (up 8.5%) and ¥156.0 bn (up 5.7%) respectively. The decline in Normalized OP mainly reflects a year-on-year adverse swing from the reversal of prior-year effects related to a competitor’s cyberattack (an approximately ¥17.0 bn impact on Kirin Brewery) and increased R&D expenses and preparation costs for the U.S. launch of rocatinlimab following the rights regain within the Pharmaceuticals business, with Normalized OP at Kyowa Kirin forecast to fall ¥13.3 bn to ¥89.0 bn. EPS is projected to grow to ¥193 (up 6.0%), and ROIC is projected to improve to 7.7% through further enhancement of net income and repayment of interest-bearing debt. Impacts of the Four Roses divestment are not included in the FY2026 forecast.
| Item | FY2026 Forecast | FY2025 Actual | YoY |
|---|---|---|---|
| Revenue (bn yen) | 2,480.0 | 2,433.4 | +46.6 (+1.9%) |
| Normalized OP (bn yen) | 235.0 | 251.8 | -16.8 (-6.7%) |
| Profit before tax (bn yen) | 258.0 | 237.9 | +20.1 (+8.5%) |
| Profit attributable to owners of the Company (bn yen) | 156.0 | 147.5 | +8.5 (+5.7%) |
| ROIC | 7.7% | 7.6% | - |
| EPS | 193 yen | 182 yen | +11 yen (+6.0%) |
| Dividend per share | 76 yen | 74 yen | +2 yen (+2.7%) |
Shareholder Returns
Kirin plans a dividend per share of ¥74 for FY2025 (up ¥3 year on year) and forecasts ¥76 per share for FY2026 (up ¥2 year on year). The company states ROIC will be improved through further enhancement of net income and repayment of interest-bearing debt. The Gross Debt Equity Ratio was 0.72 at FY2025 year-end versus 0.73 a year earlier, as interest-bearing debt increased 8% while shareholders’ equity increased 9%, and Net Debt / Normalized EBITDA improved to 2.22 from 2.39.
| Item | FY2024 | FY2025 | FY2026 Forecast |
|---|---|---|---|
| Dividend per share | 71 yen | 74 yen | 76 yen |
| YoY change | - | +3 yen (+4.2%) | +2 yen (+2.7%) |
Financial Position and Cash Flow
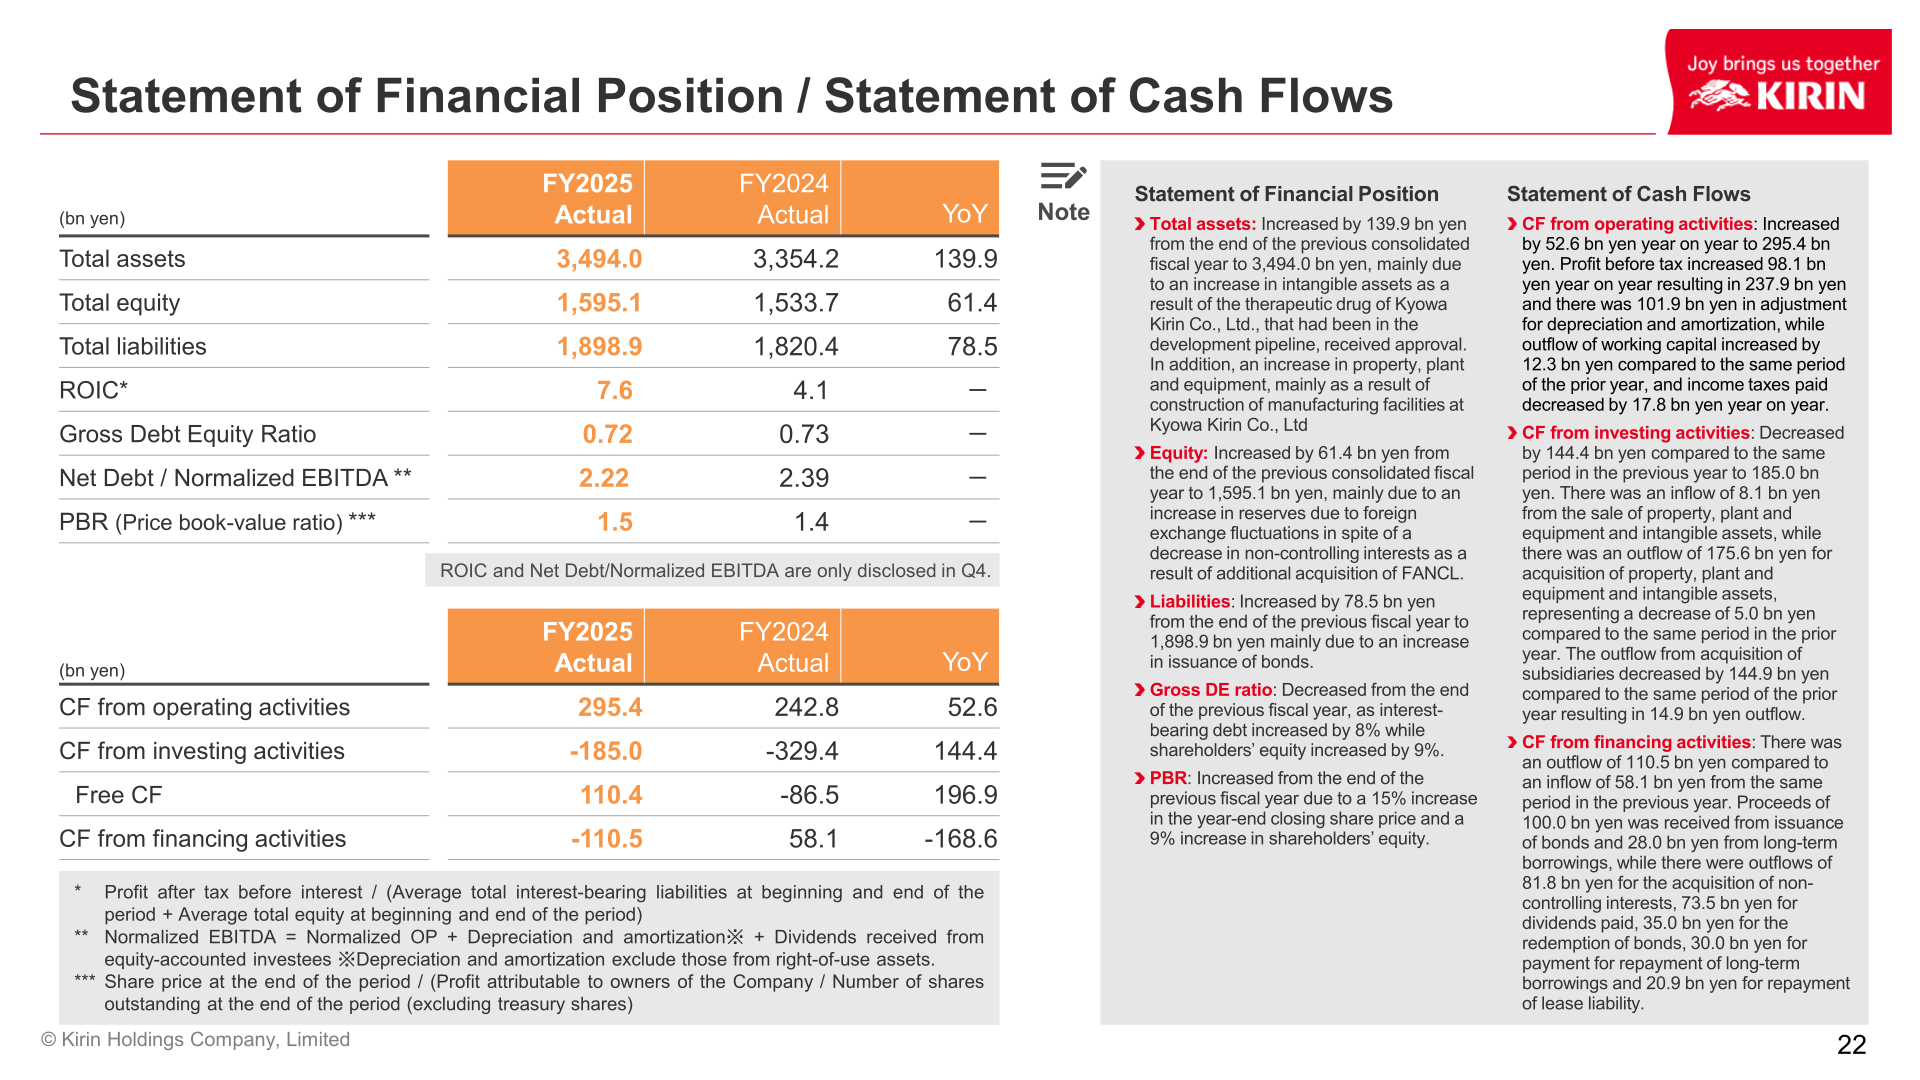
Total assets increased ¥139.9 bn to ¥3,494.0 bn from the end of the previous fiscal year, mainly due to an increase in intangible assets following regulatory approval of a therapeutic drug in Kyowa Kirin’s development pipeline, along with an increase in property, plant and equipment from construction of manufacturing facilities at Kyowa Kirin. Total equity increased ¥61.4 bn to ¥1,595.1 bn, mainly due to an increase in reserves from foreign exchange fluctuations, despite a decrease in non-controlling interests from the additional acquisition of FANCL. Total liabilities increased ¥78.5 bn to ¥1,898.9 bn, mainly due to an increase in bond issuance. PBR rose to 1.5 from 1.4, reflecting a 15% increase in the year-end closing share price and a 9% increase in shareholders’ equity. Cash flow from operating activities increased ¥52.6 bn to ¥295.4 bn, cash flow from investing activities was ¥-185.0 bn (an improvement of ¥144.4 bn year on year), resulting in free cash flow of ¥110.4 bn versus ¥-86.5 bn in FY2024; cash flow from financing activities was ¥-110.5 bn, including outflows of ¥81.8 bn for the acquisition of non-controlling interests and ¥73.5 bn for dividends paid.
Topics: Pharmaceuticals Pipeline and Equity-Method Affiliate
In Kyowa Kirin’s main development pipeline as of February 9, 2026, rocatinlimab (KHK4083/AMG 451) is in Phase 3 global development for moderate to severe atopic dermatitis with a planned approval year of 2027, and is also in Phase 3 global development for prurigo nodularis and Phase 2 global development for moderate to severe asthma. For the equity-method affiliate San Miguel Brewery, Kirin Holdings’ FY2025 consolidation period (October 2024 to September 2025) showed Net Income (SMB) of ¥67.8 bn (up 4.4%), with consolidated net income to Kirin of ¥32.7 bn (up 5.5%) and dividend income of ¥27.5 bn (up 12.0%); on a local-disclosure basis, San Miguel Brewery’s Sales rose 1.8% to 152,884 million PHP and Operating Income rose 10.3% to 33,888 million PHP, with the company noting San Miguel Brewery holds over 90% market share in the Philippines.
This article is an analysis based on publicly available information and is not a recommendation to buy or sell any specific securities. Investment decisions are your own responsibility.
![[Obayashi] Investors’ Guide 2026 — The Complete 24-Article Breakdown](https://japan-equity.com/wp-content/uploads/2026/07/hub_cover-1024x1024.png)
![[Obayashi] IR & SR Policy — Feeding Dialogue Back into Management](https://japan-equity.com/wp-content/uploads/2026/07/p32_sq-1024x1024.jpg)
![[Obayashi] Domestic Civil Engineering — Resilience Spending Supports 9.6% Margin](https://japan-equity.com/wp-content/uploads/2026/07/p11_sq-1024x1024.jpg)
![[Obayashi] Overseas Construction — Orders Reach ¥1.2tn](https://japan-equity.com/wp-content/uploads/2026/07/p15_sq-1024x1024.jpg)
![[Obayashi] Share Price & External Ratings — vs TOPIX, ESG Index Inclusion](https://japan-equity.com/wp-content/uploads/2026/07/p40_sq-1024x1024.jpg)
![[Construction] ¥75.5tn Investment, Shrinking Workforce — Big-5 Market Share](https://japan-equity.com/wp-content/uploads/2026/07/p12_sq-1024x1024.jpg)



![[Obayashi] Capital Policy & Shareholder Returns — ROE 10%+, DOE ~5%, ¥100bn Buyback](https://japan-equity.com/wp-content/uploads/2026/07/p27_sq-1024x1024.jpg)
![[Obayashi] Reducing Cross-Shareholdings — ¥285.2bn Sold in Five Years](https://japan-equity.com/wp-content/uploads/2026/07/p29_sq-1024x1024.jpg)
![[Obayashi] ¥750bn Investment Plan — ¥300bn to Development, ¥190bn to Tech/DX](https://japan-equity.com/wp-content/uploads/2026/07/p30_sq-1024x1024.jpg)
![[Obayashi] MTP2022 KPIs — Operating Profit ~2x Target, ROE 14.4%](https://japan-equity.com/wp-content/uploads/2026/07/p25_sq-1024x1024.jpg)
![[Obayashi] Cash Allocation — ¥420bn Investment CF Over Five Years](https://japan-equity.com/wp-content/uploads/2026/07/p26_sq-1024x1024.jpg)
![[Obayashi] Green Energy — 44 Plants, 344MW, and the Green Hydrogen Challenge](https://japan-equity.com/wp-content/uploads/2026/07/p21_sq-1024x1024.jpg)
![[Obayashi] Tackling the Labor Shortage — Robotics Construction®](https://japan-equity.com/wp-content/uploads/2026/07/p14_sq-1024x1024.jpg)
